Chicago, IL Investment Properties for Sale
Browse homes for sale and investment properties in Chicago, IL. Refine your search by price, property type, or more.
Best cash flowing properties in Chicago, IL
Active
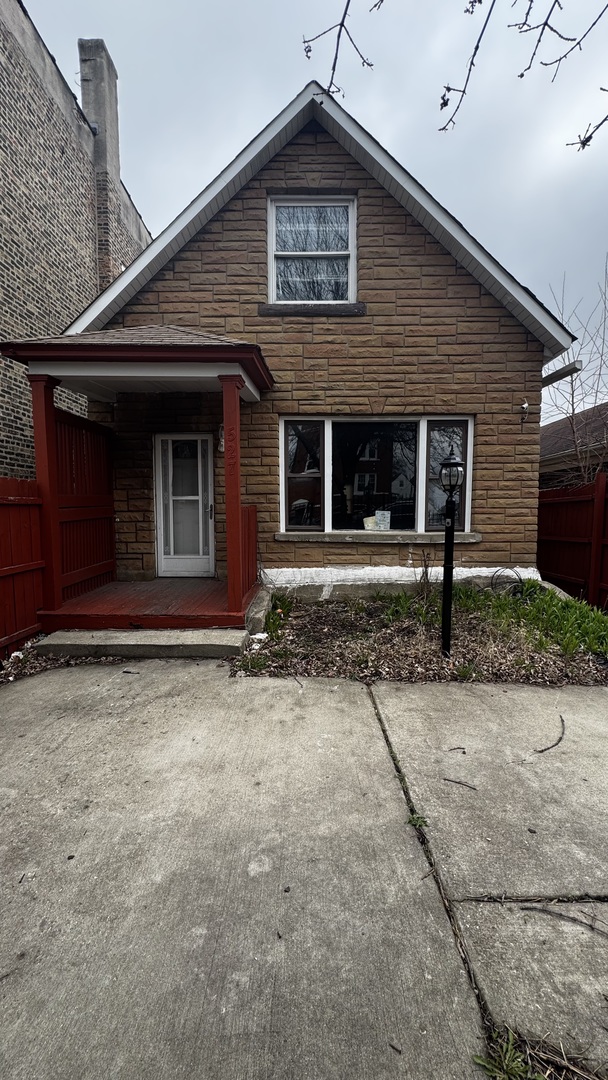
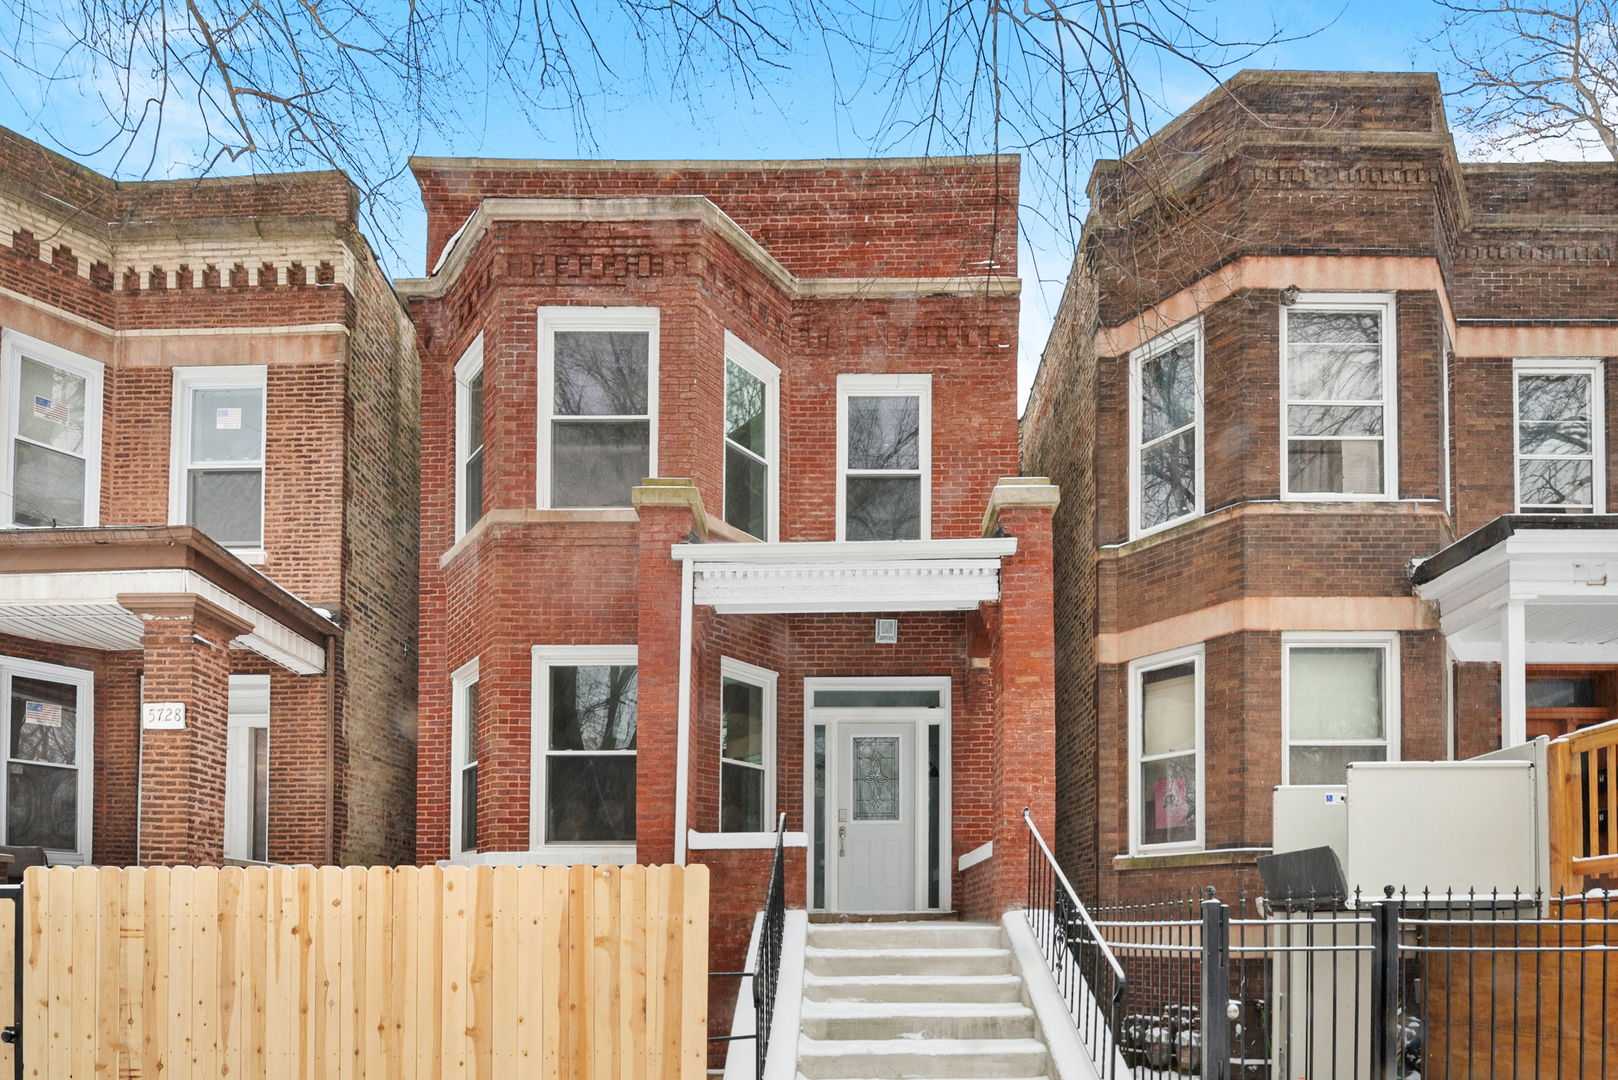
$89,900
3
bds
|
2
ba
|
1,000
sqft
|
built
1885
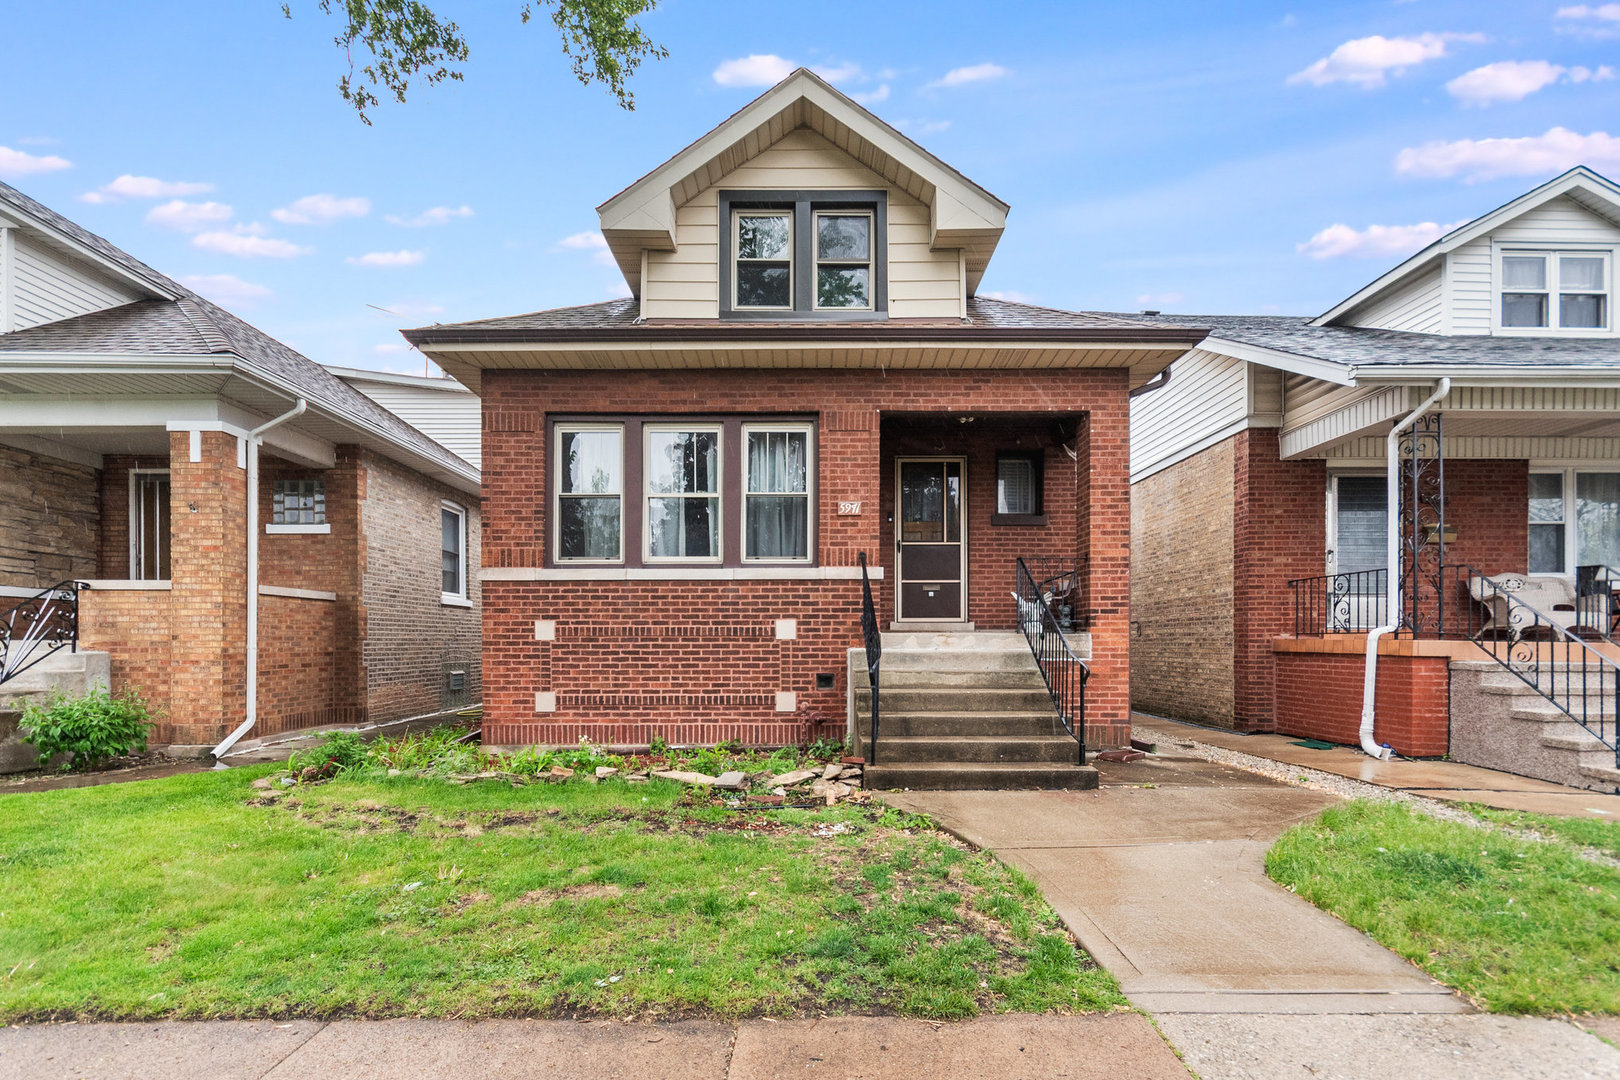
527 N Springfield Ave, Chicago, IL 60624
$793
Cash flow
46.0%
Cash-on-Cash Return
16.9%
Cap rate
2.1%
Rent to Value Ratio
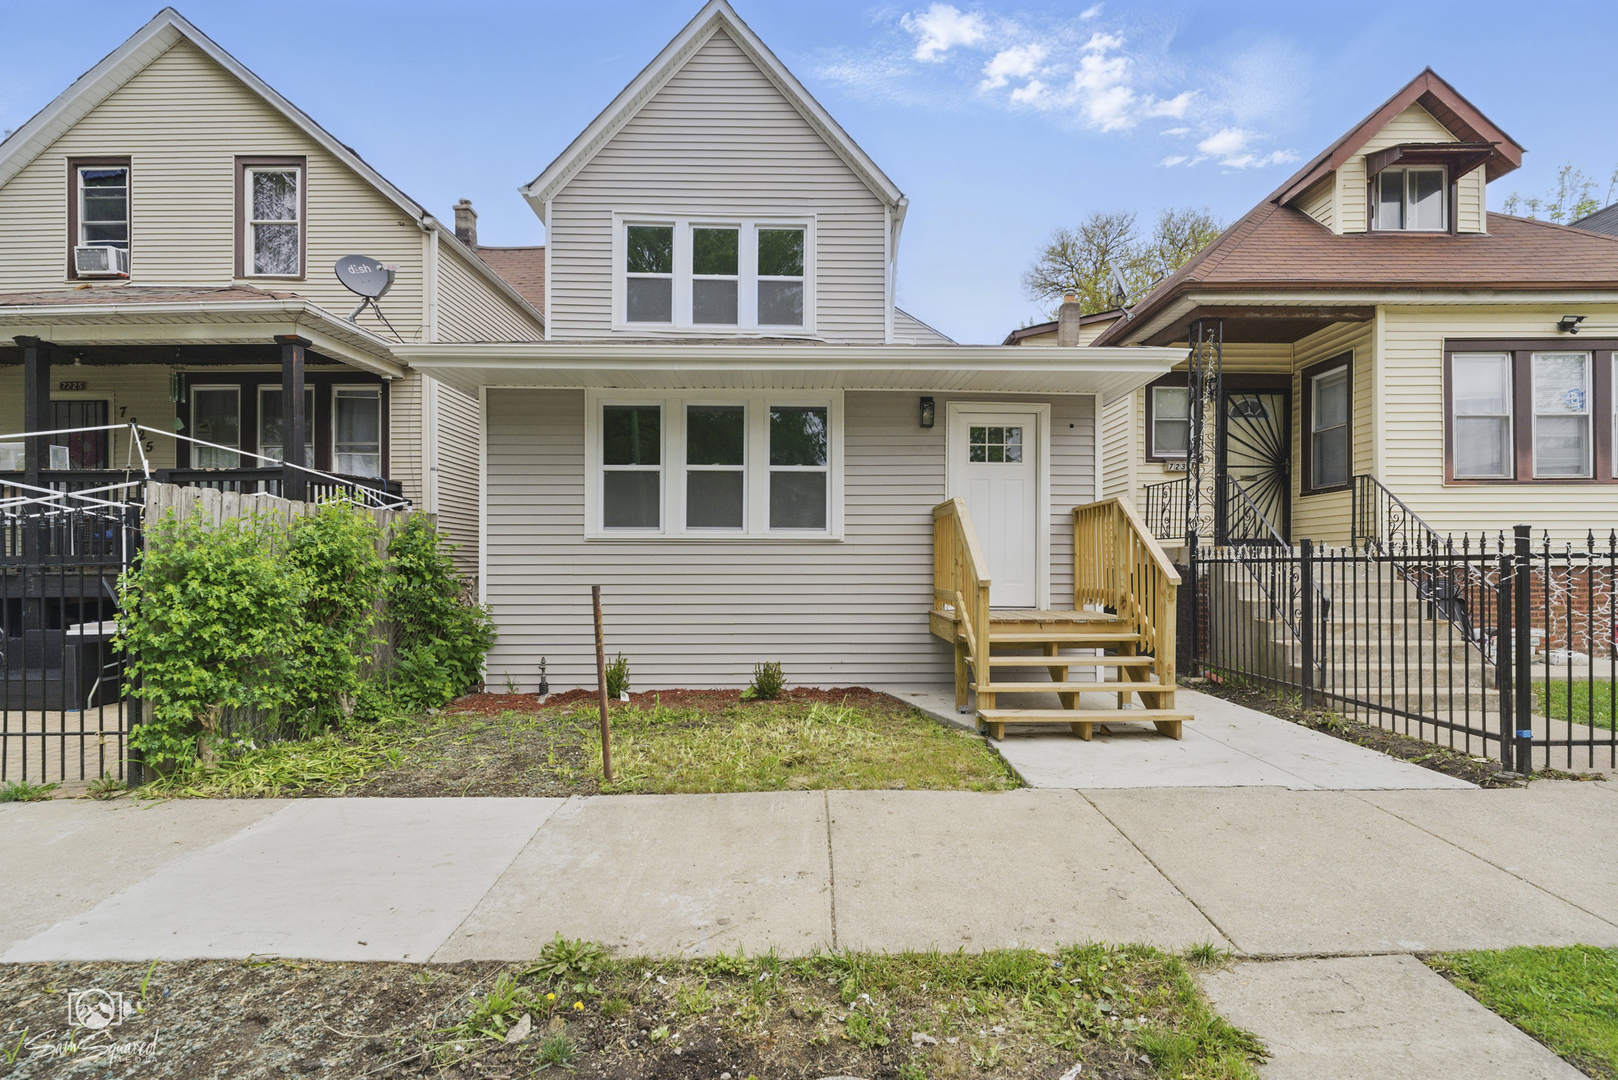
Active
$245,000
4
bds
|
2
ba
|
1,439
sqft
|
built
1898
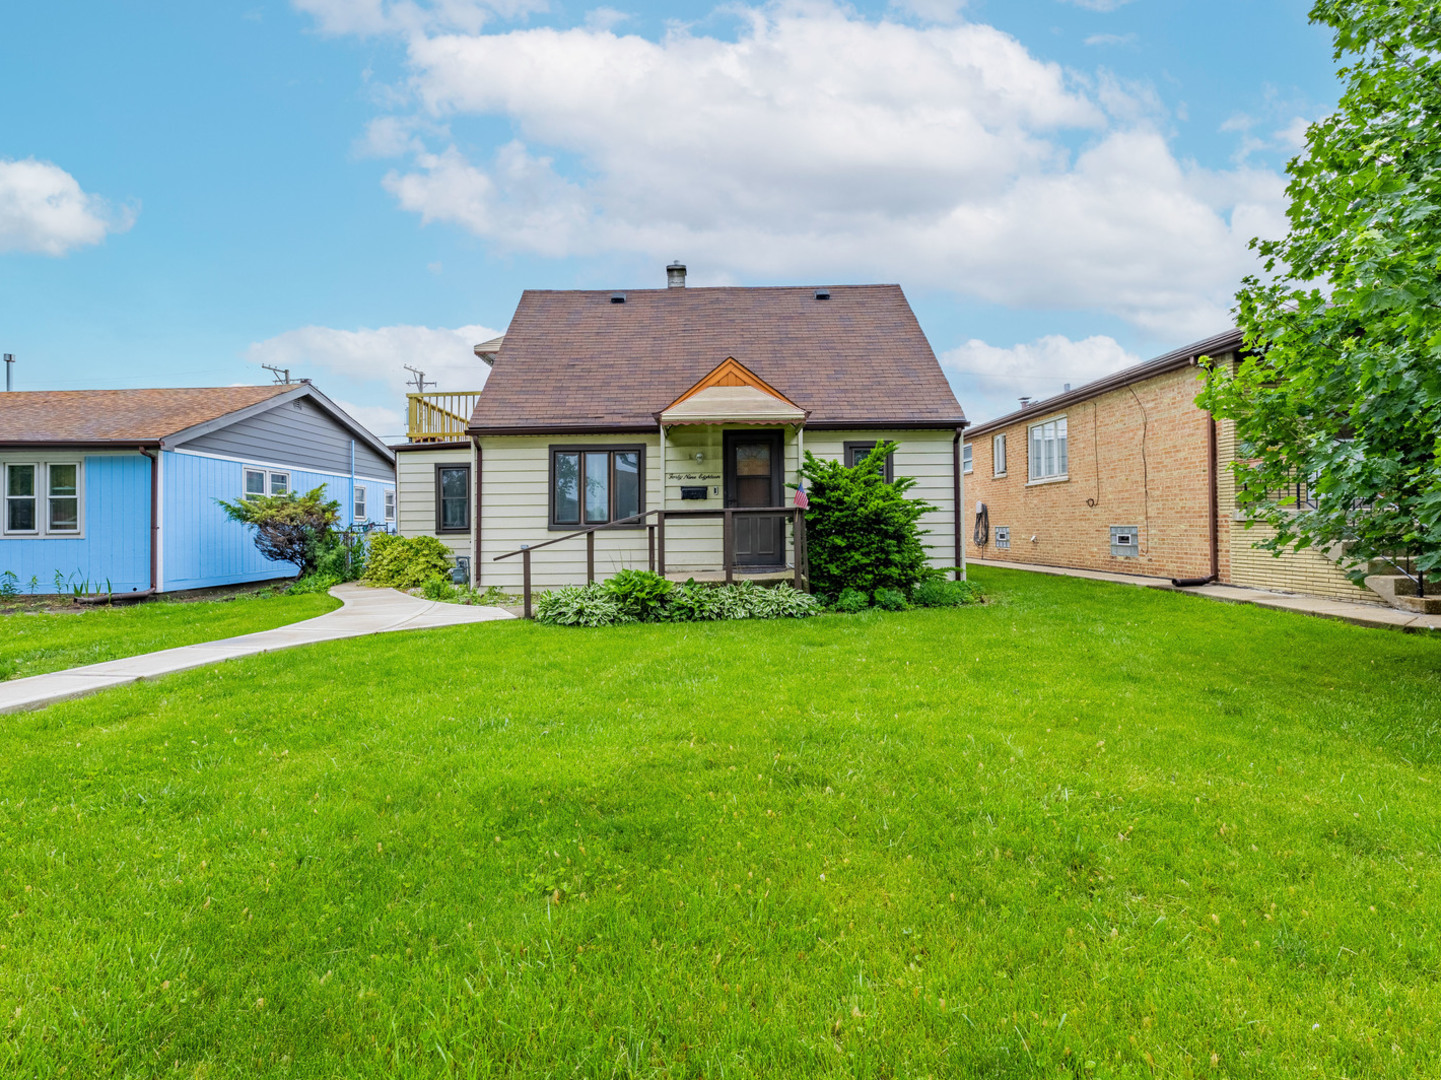
7227 S Paulina St, Chicago, IL 60636
$458
Cash flow
9.8%
Cash-on-Cash Return
8.5%
Cap rate
1.1%
Rent to Value Ratio
3,740 out of 4,294 properties for sale in Chicago, IL
Limited Results Shown
Create a free account, or log in to reveal all property listings and enjoy the complete experience.
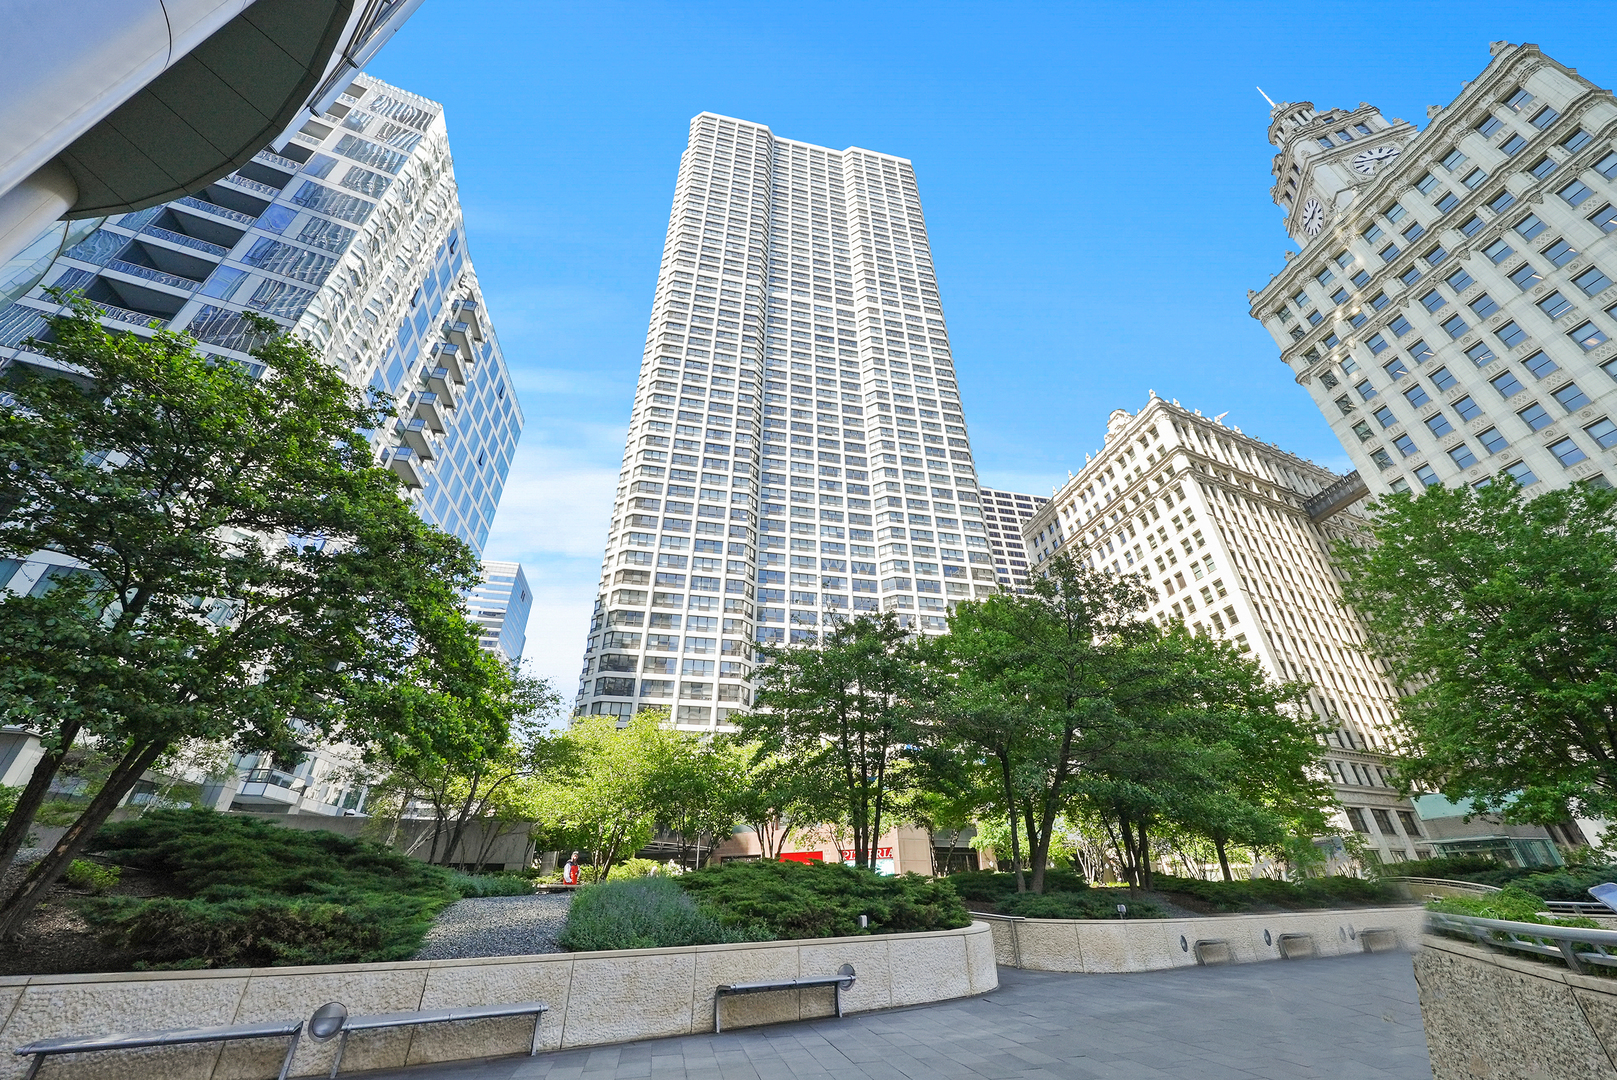
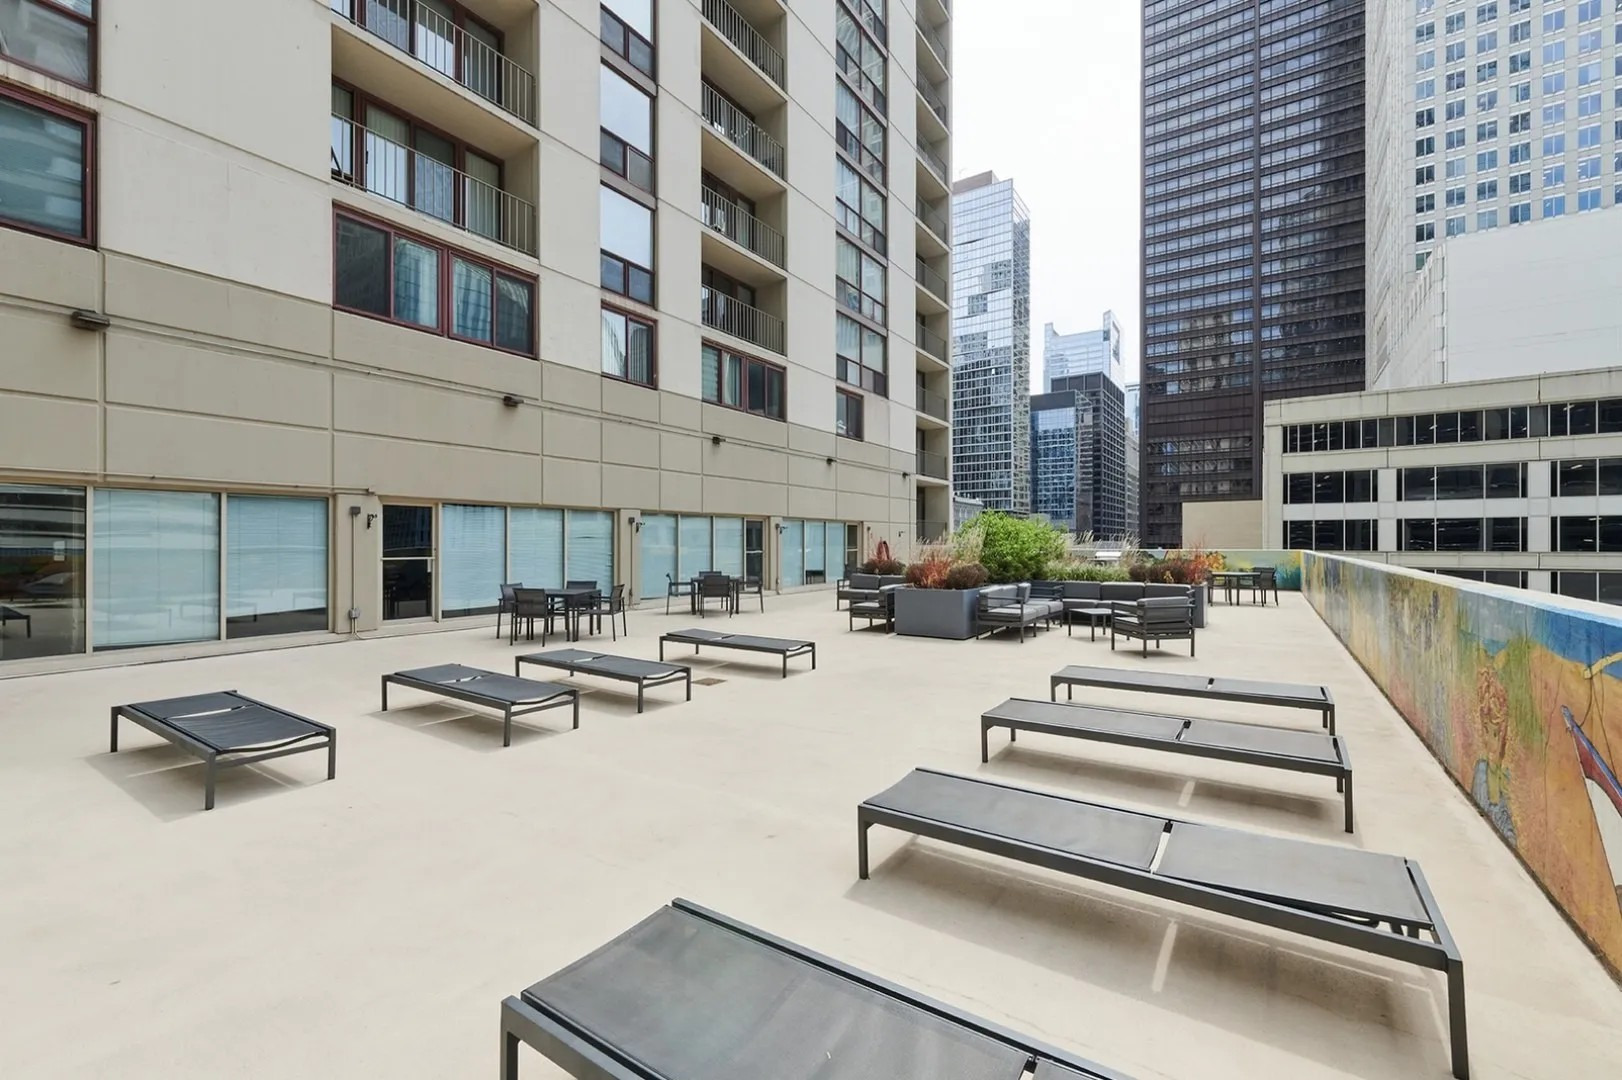
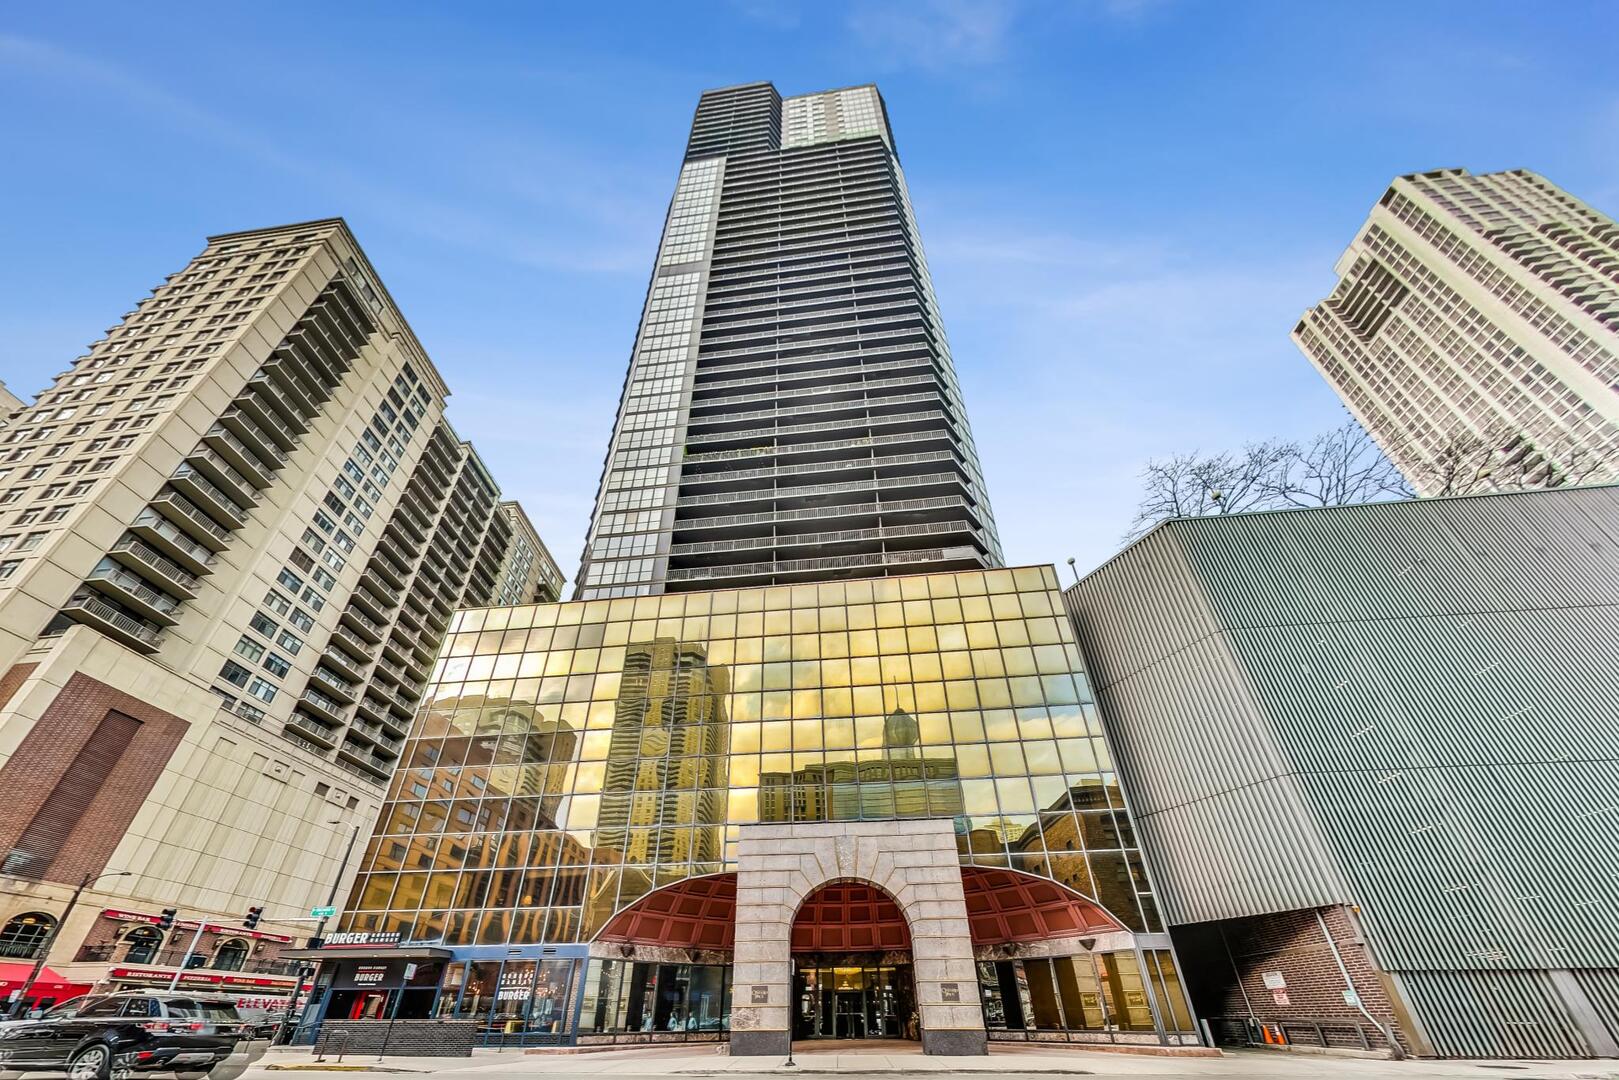
Active
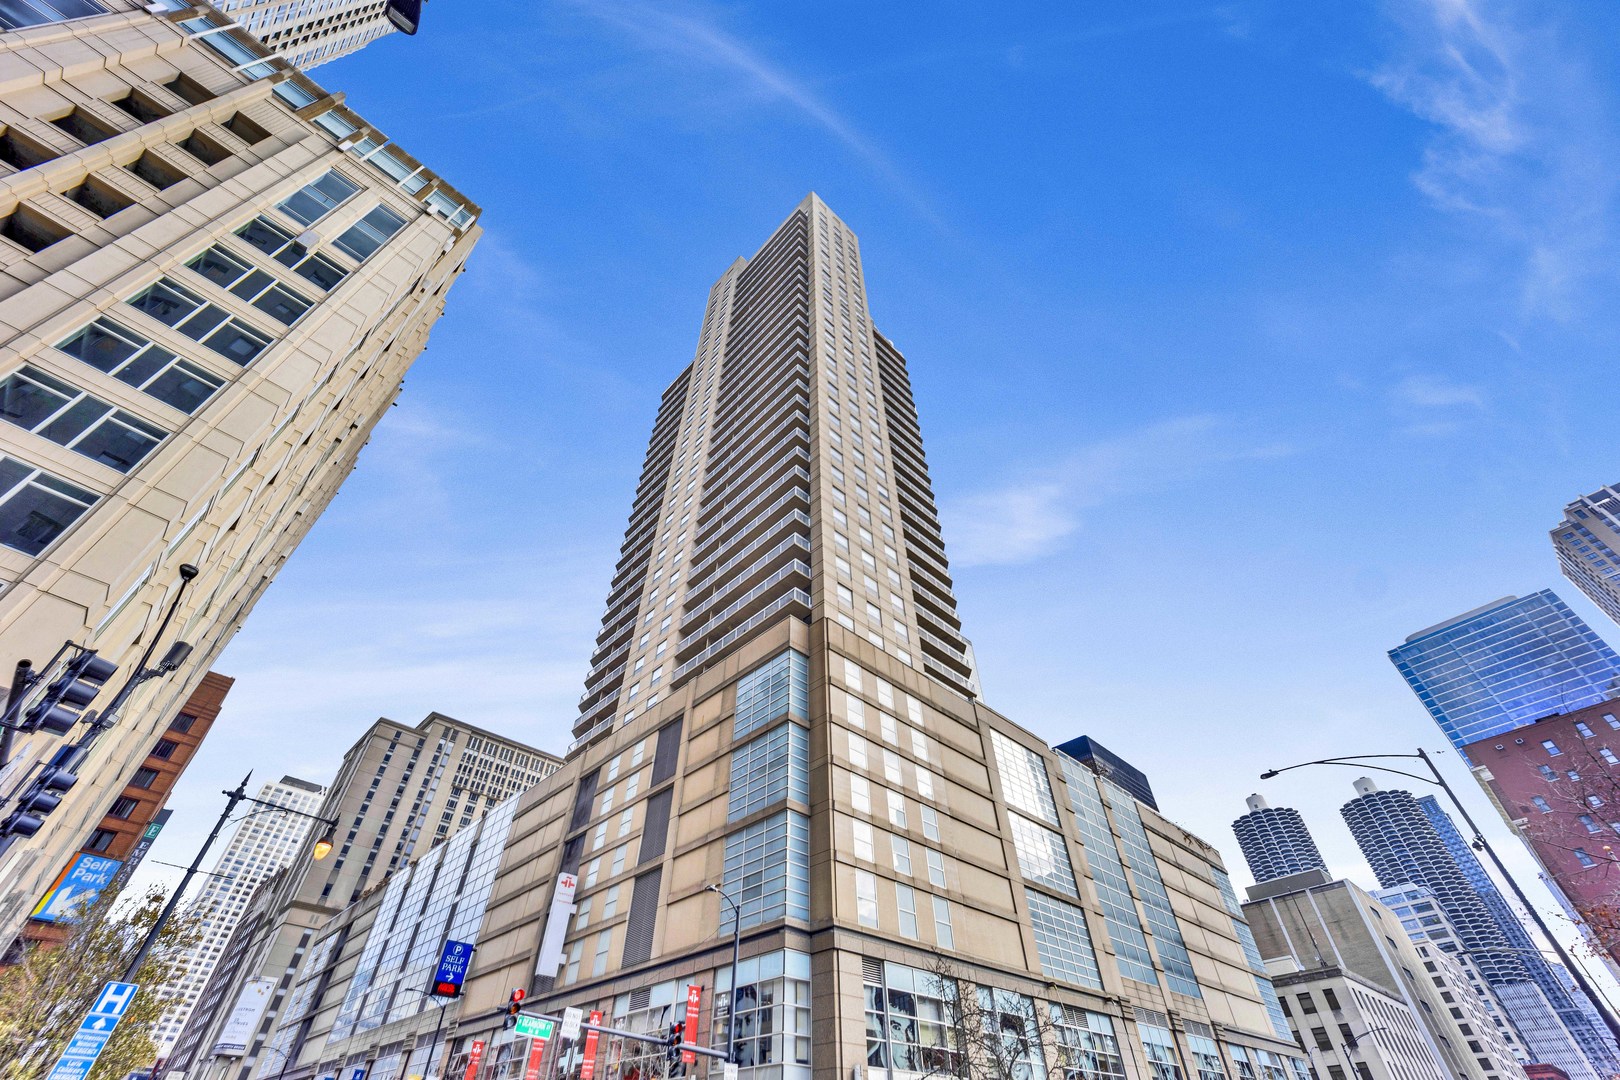
$435,000
2
bds
|
2
ba
|
1,300
sqft
|
built
1977
405 N Wabash Ave, Chicago, IL 60611
$-2,187
Cash flow
-26.2%
Cash-on-Cash Return
0.3%
Cap rate
0.9%
Rent to Value Ratio
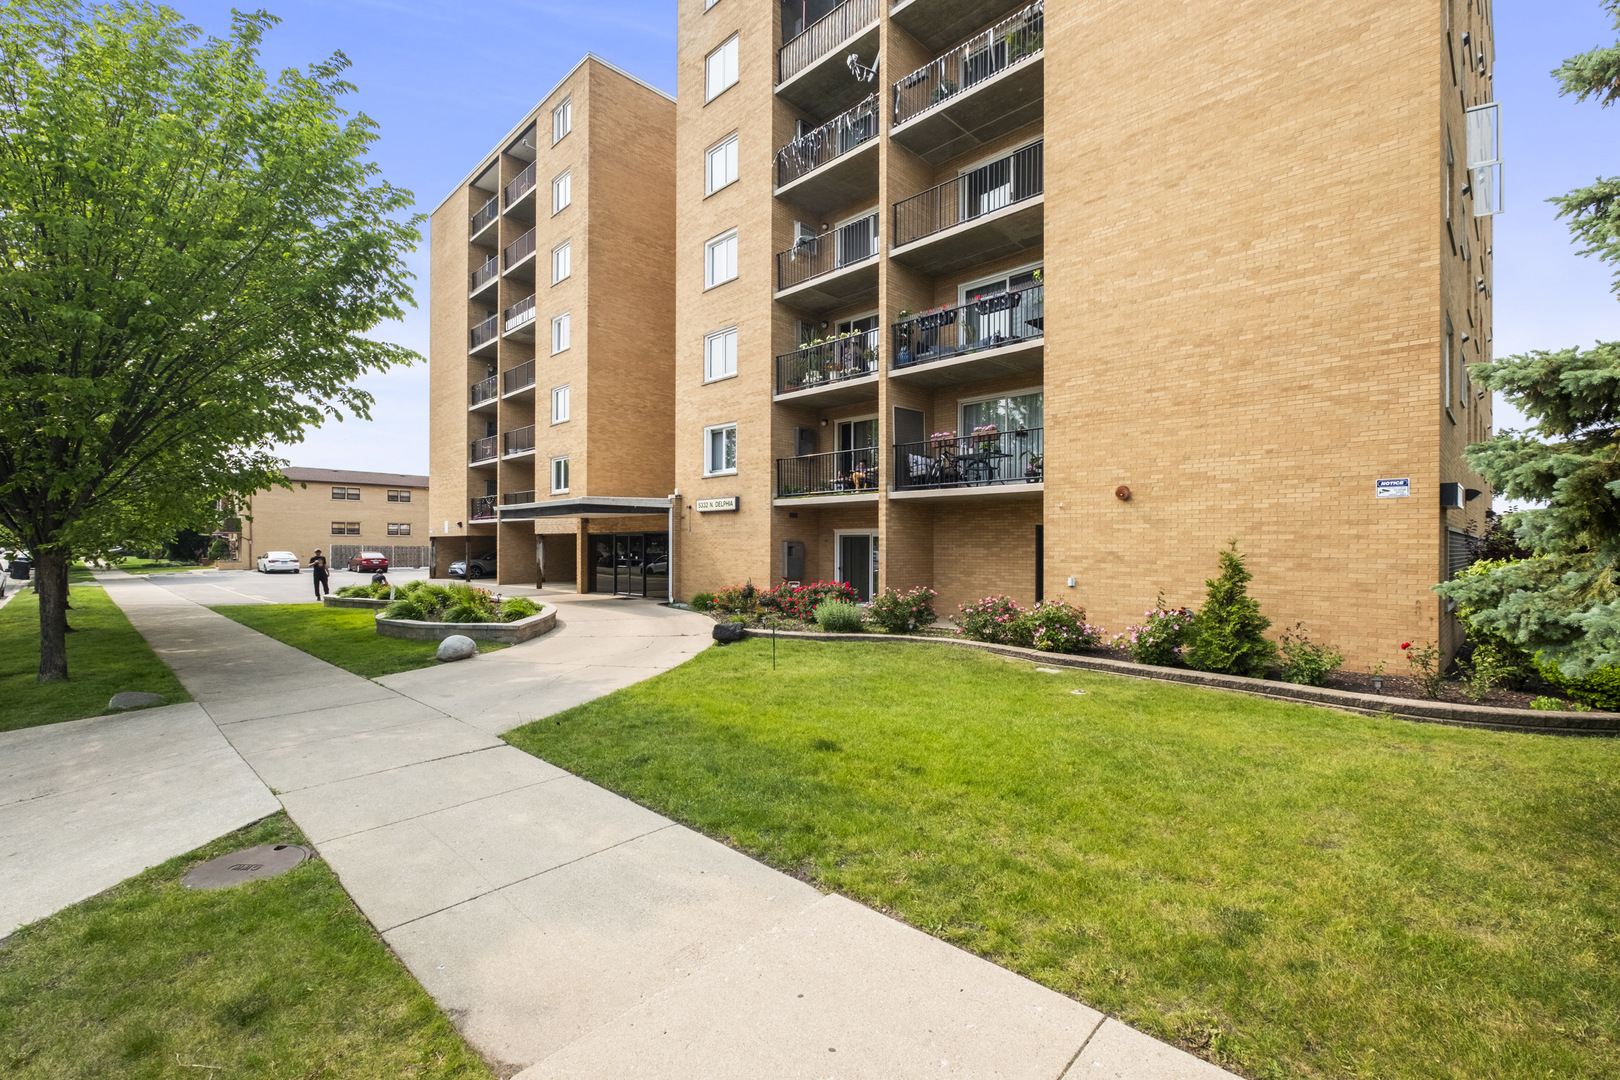
Active
$247,000
2
bds
|
2
ba
|
1,000
sqft
|
built
1974
5332 N Delphia Ave, Chicago, IL 60656
$-320
Cash flow
-6.8%
Cash-on-Cash Return
4.7%
Cap rate
0.8%
Rent to Value Ratio
Active
$470,000
4
bds
|
2
ba
|
0
sqft
|
built
1926
1009 N Harding Ave, Chicago, IL 60651
$-1,201
Cash flow
-13.3%
Cash-on-Cash Return
3.2%
Cap rate
0.4%
Rent to Value Ratio
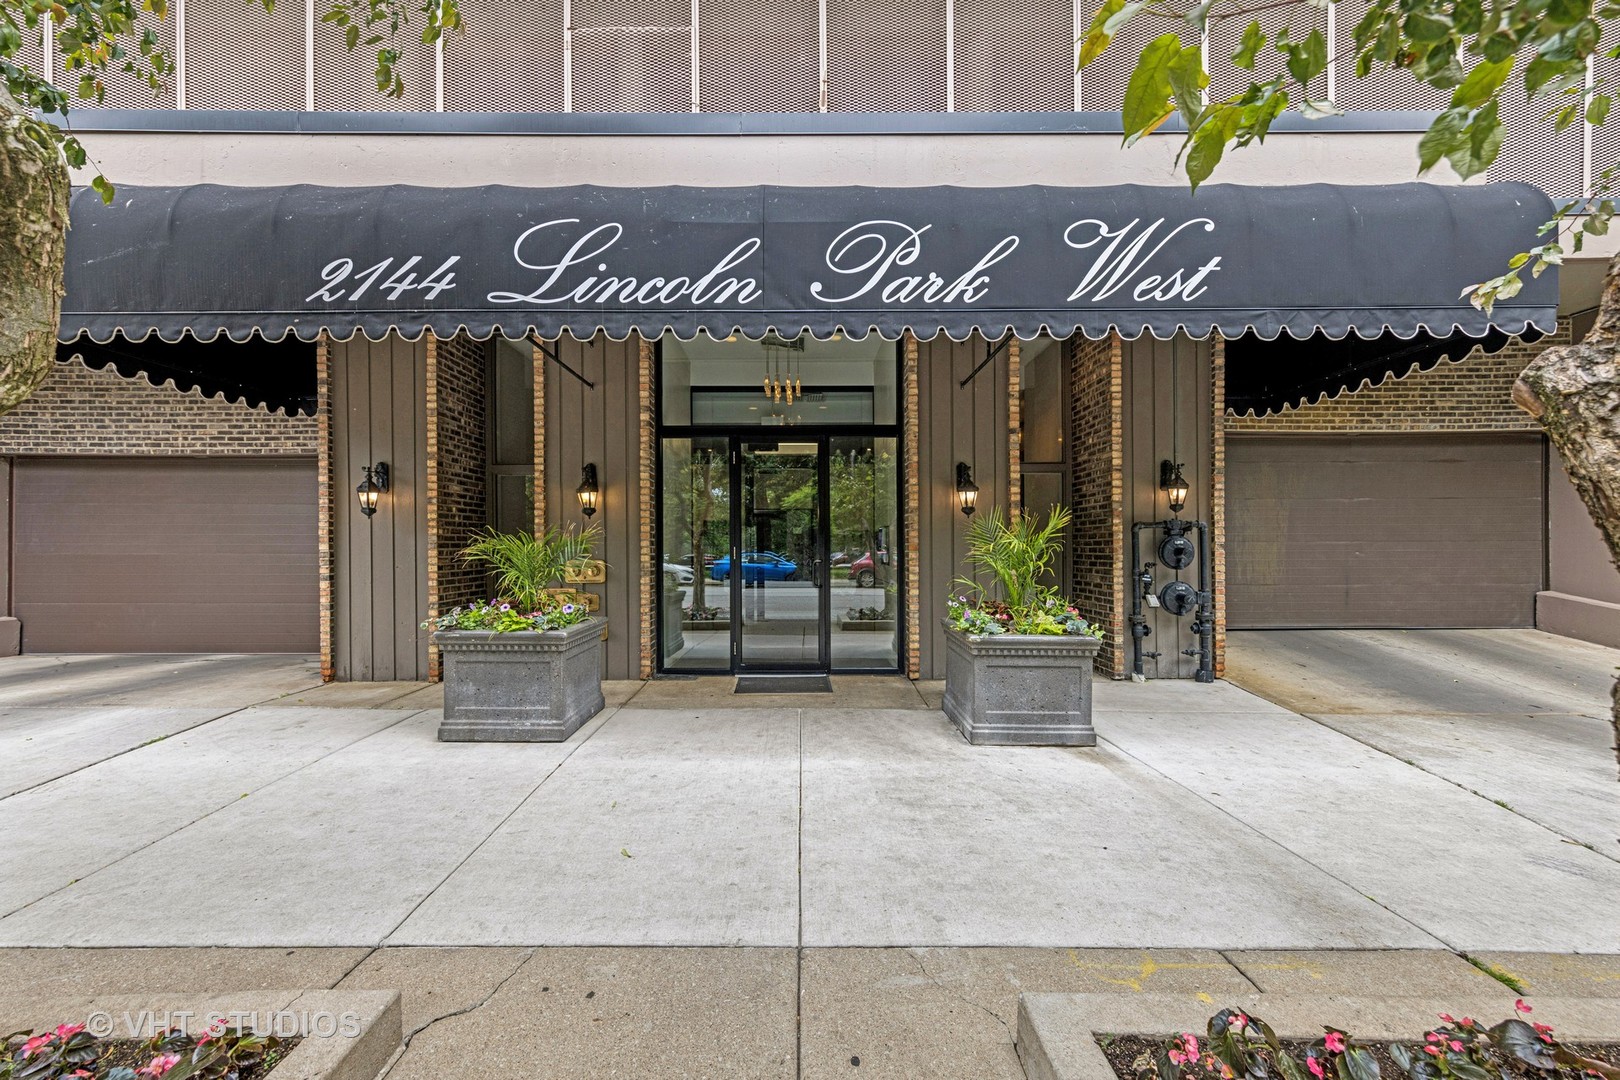
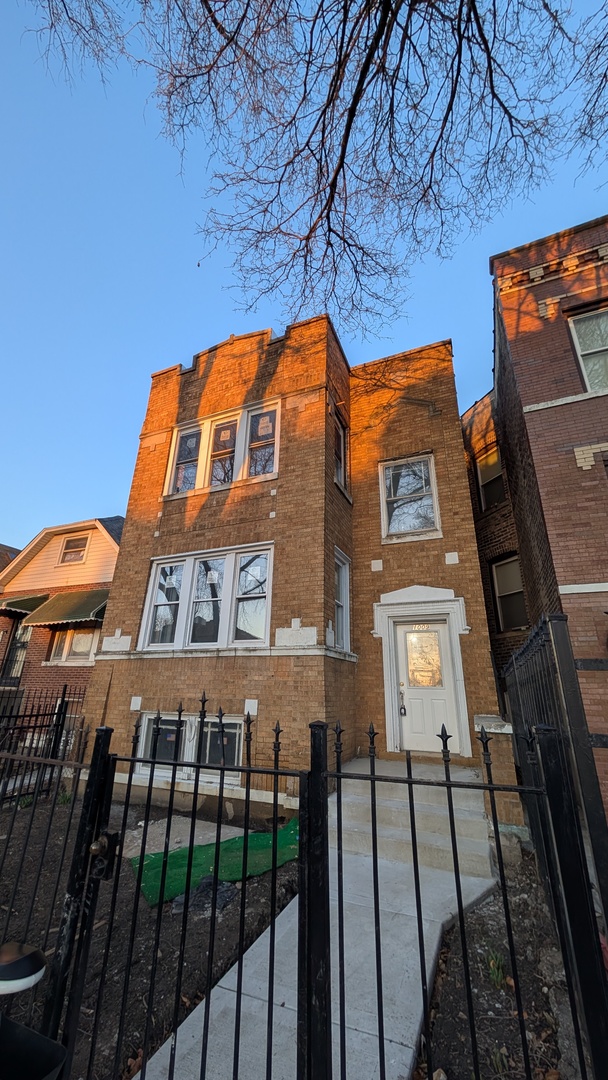
Active
$485,000
2
bds
|
2
ba
|
0
sqft
|
built
1974
2144 N Lincoln Park W, Chicago, IL 60614
$-2,105
Cash flow
-22.6%
Cash-on-Cash Return
1.1%
Cap rate
0.5%
Rent to Value Ratio
Active
$1,685,000
3
bds
|
4
ba
|
2,130
sqft
|
built
2017
540 W Webster Ave, Chicago, IL 60614
$-8,297
Cash flow
-25.7%
Cash-on-Cash Return
0.4%
Cap rate
0.4%
Rent to Value Ratio
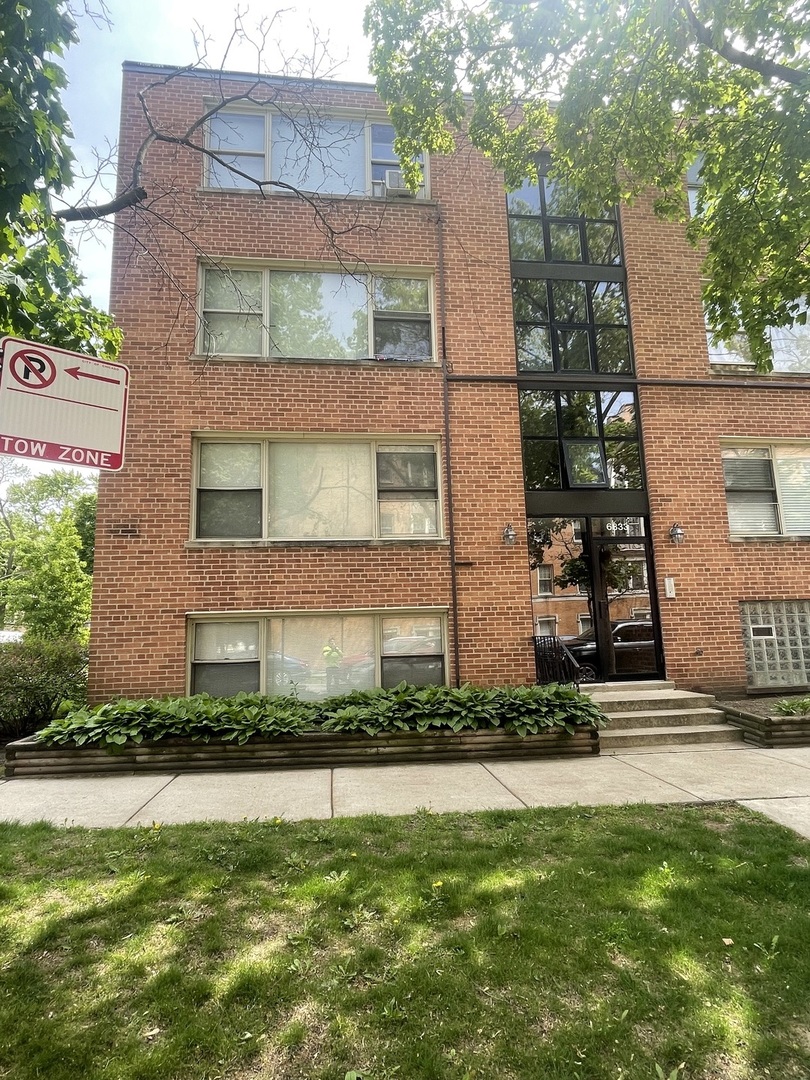
Active
$145,000
1
bds
|
1
ba
|
700
sqft
|
built
1950
6833 N Oakley Ave, Chicago, IL 60645
$-254
Cash flow
-9.1%
Cash-on-Cash Return
4.2%
Cap rate
1.0%
Rent to Value Ratio
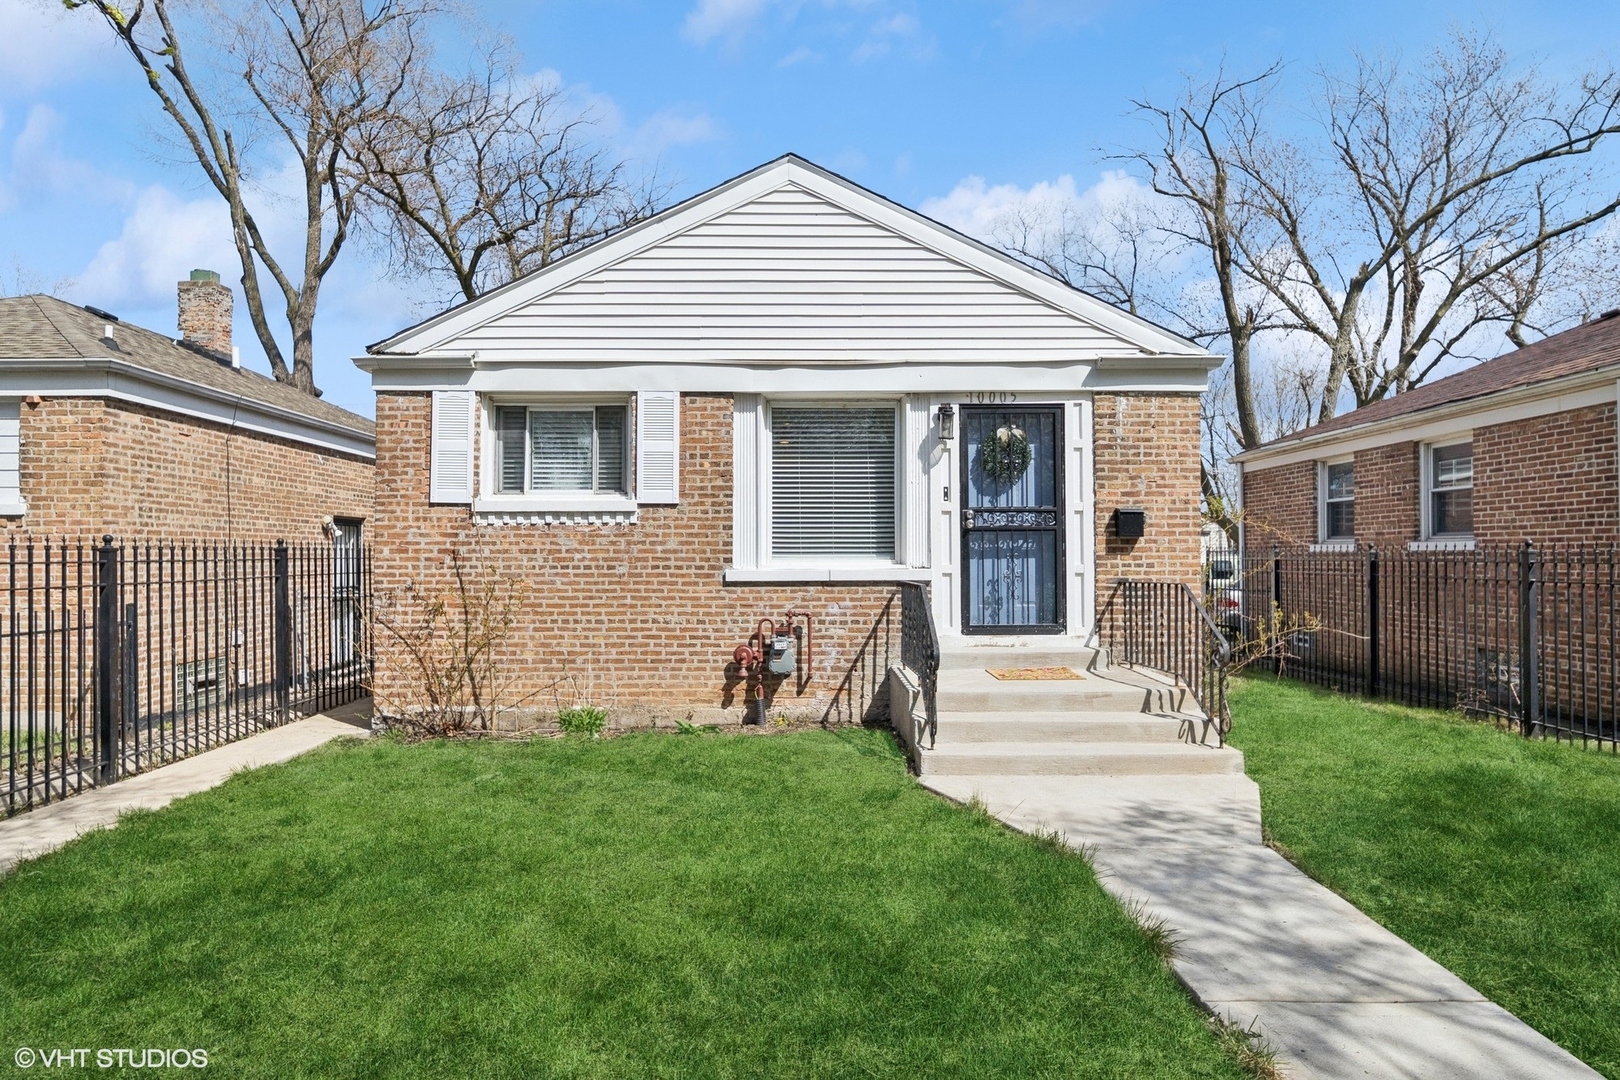
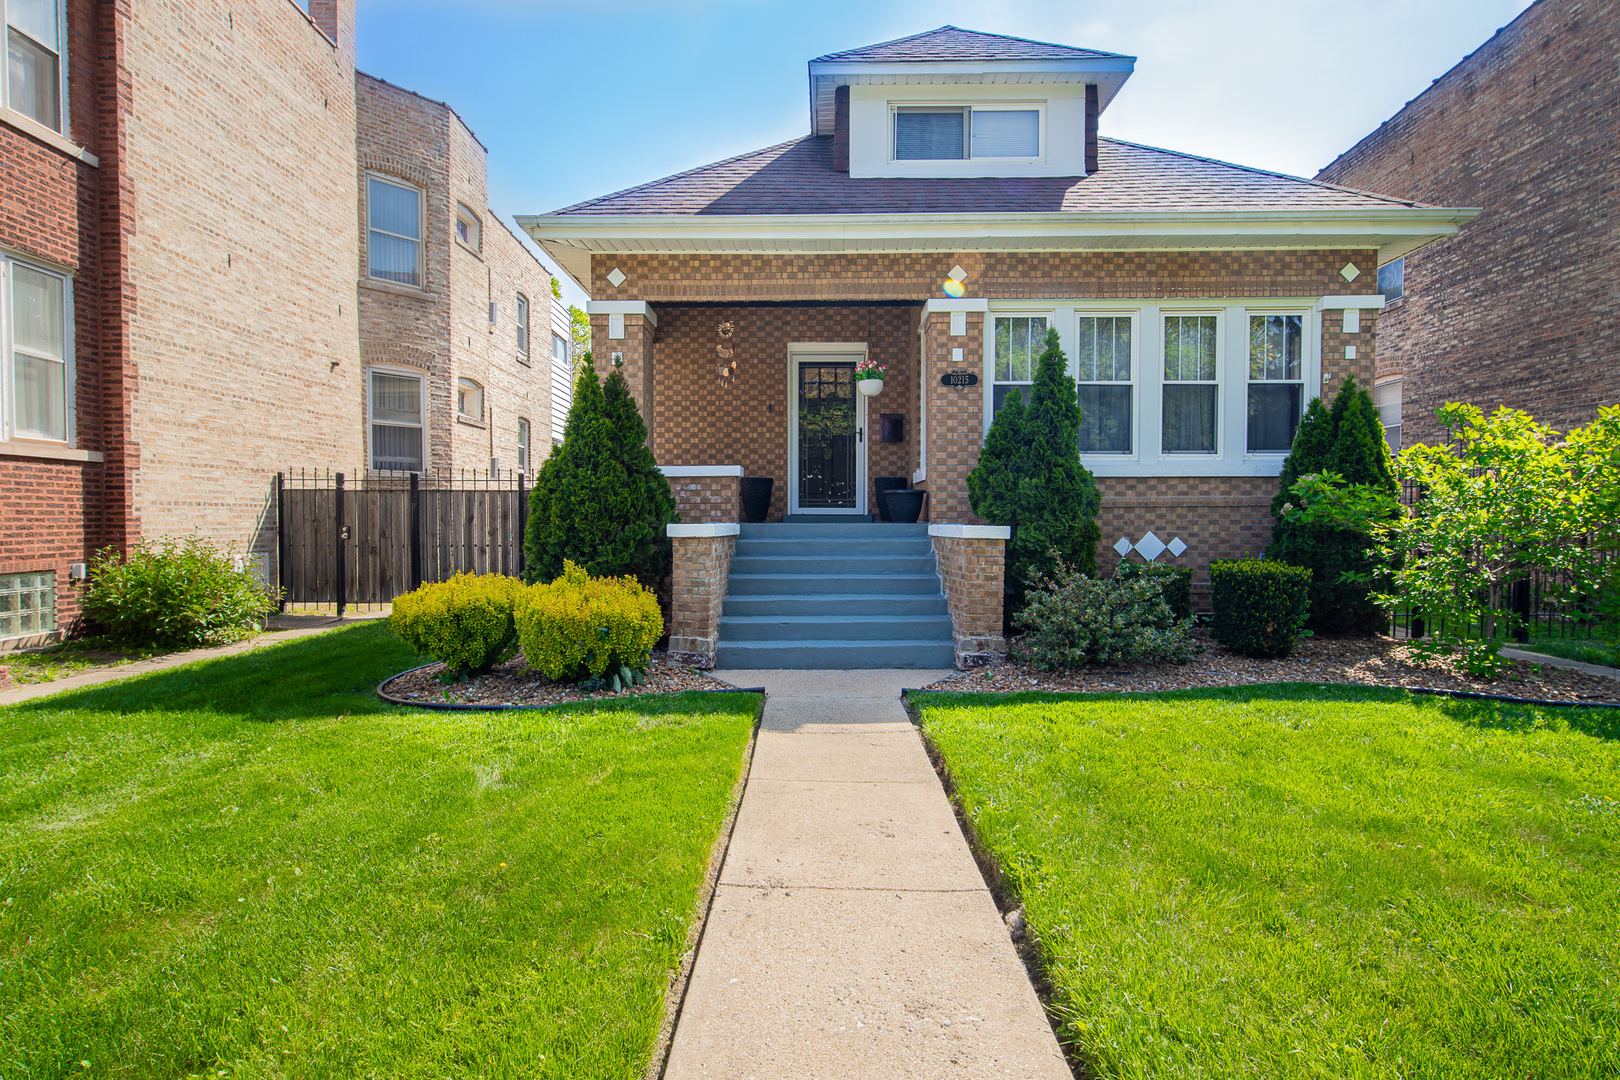
Active
$225,000
2
bds
|
2
ba
|
792
sqft
|
built
1951
10005 S Calhoun Ave, Chicago, IL 60617
$225
Cash flow
5.2%
Cash-on-Cash Return
7.5%
Cap rate
1.0%
Rent to Value Ratio
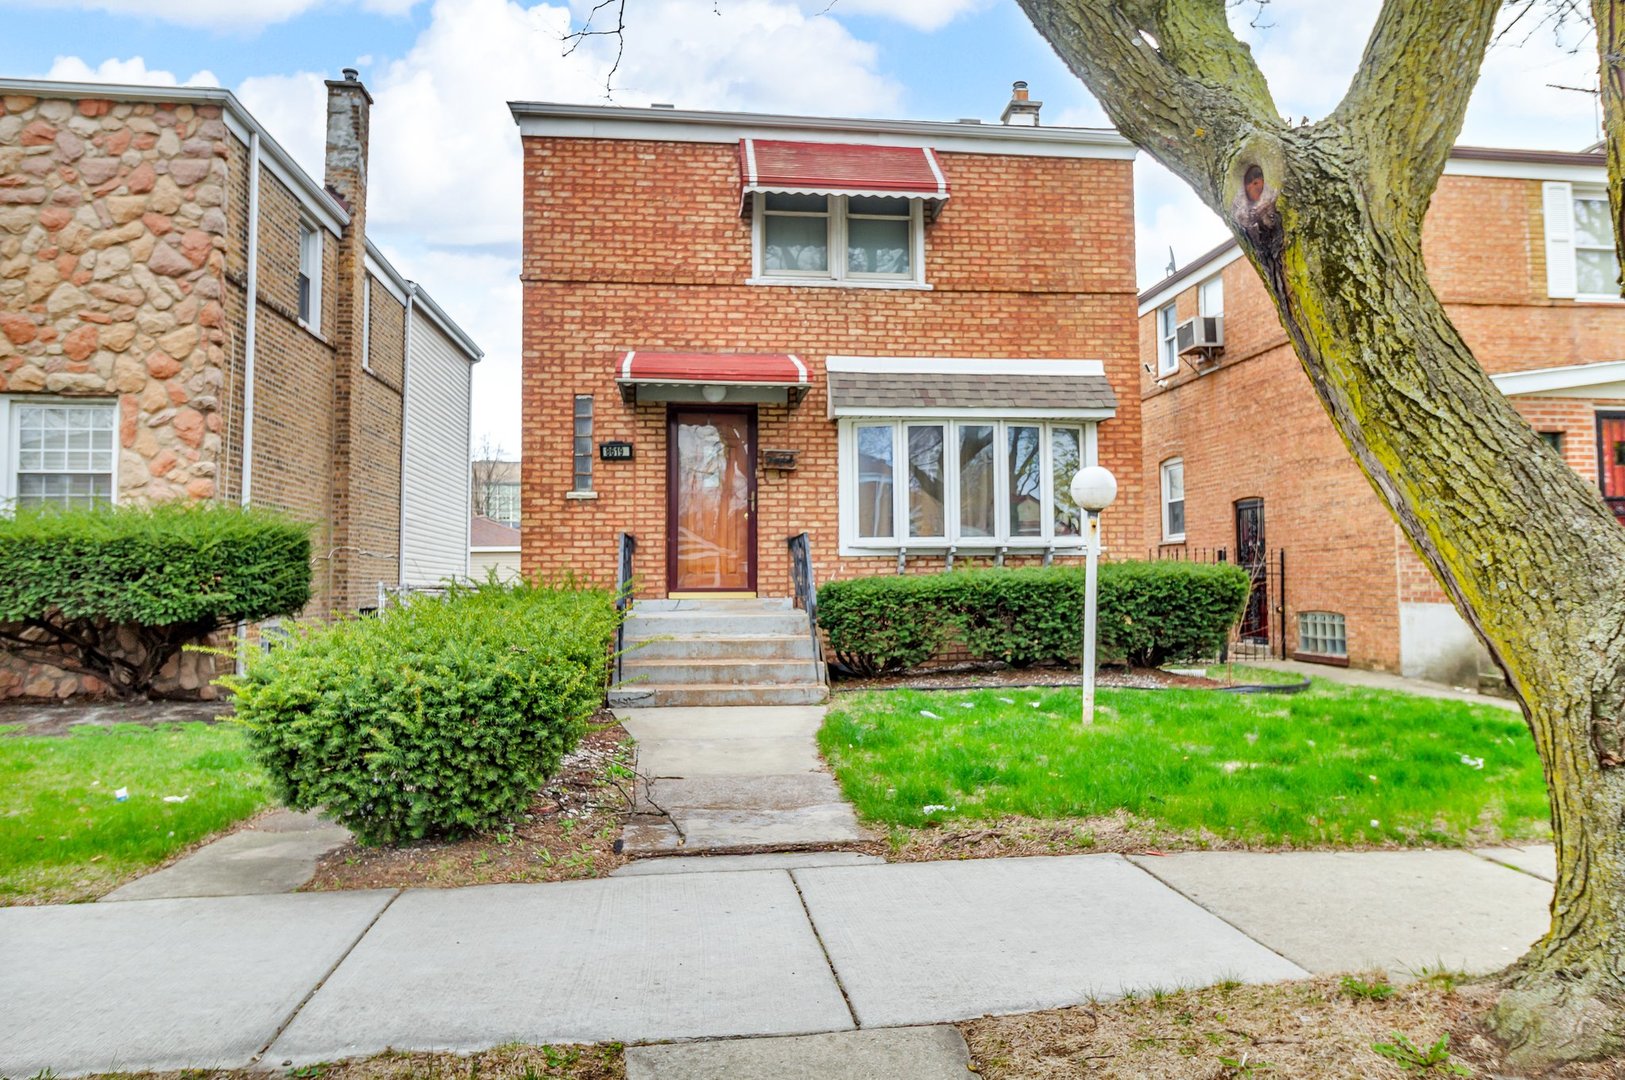
Active
$170,000
2
bds
|
1
ba
|
1,082
sqft
|
built
1943
8619 S Jeffery Blvd, Chicago, IL 60617
$337
Cash flow
10.3%
Cash-on-Cash Return
8.7%
Cap rate
1.2%
Rent to Value Ratio
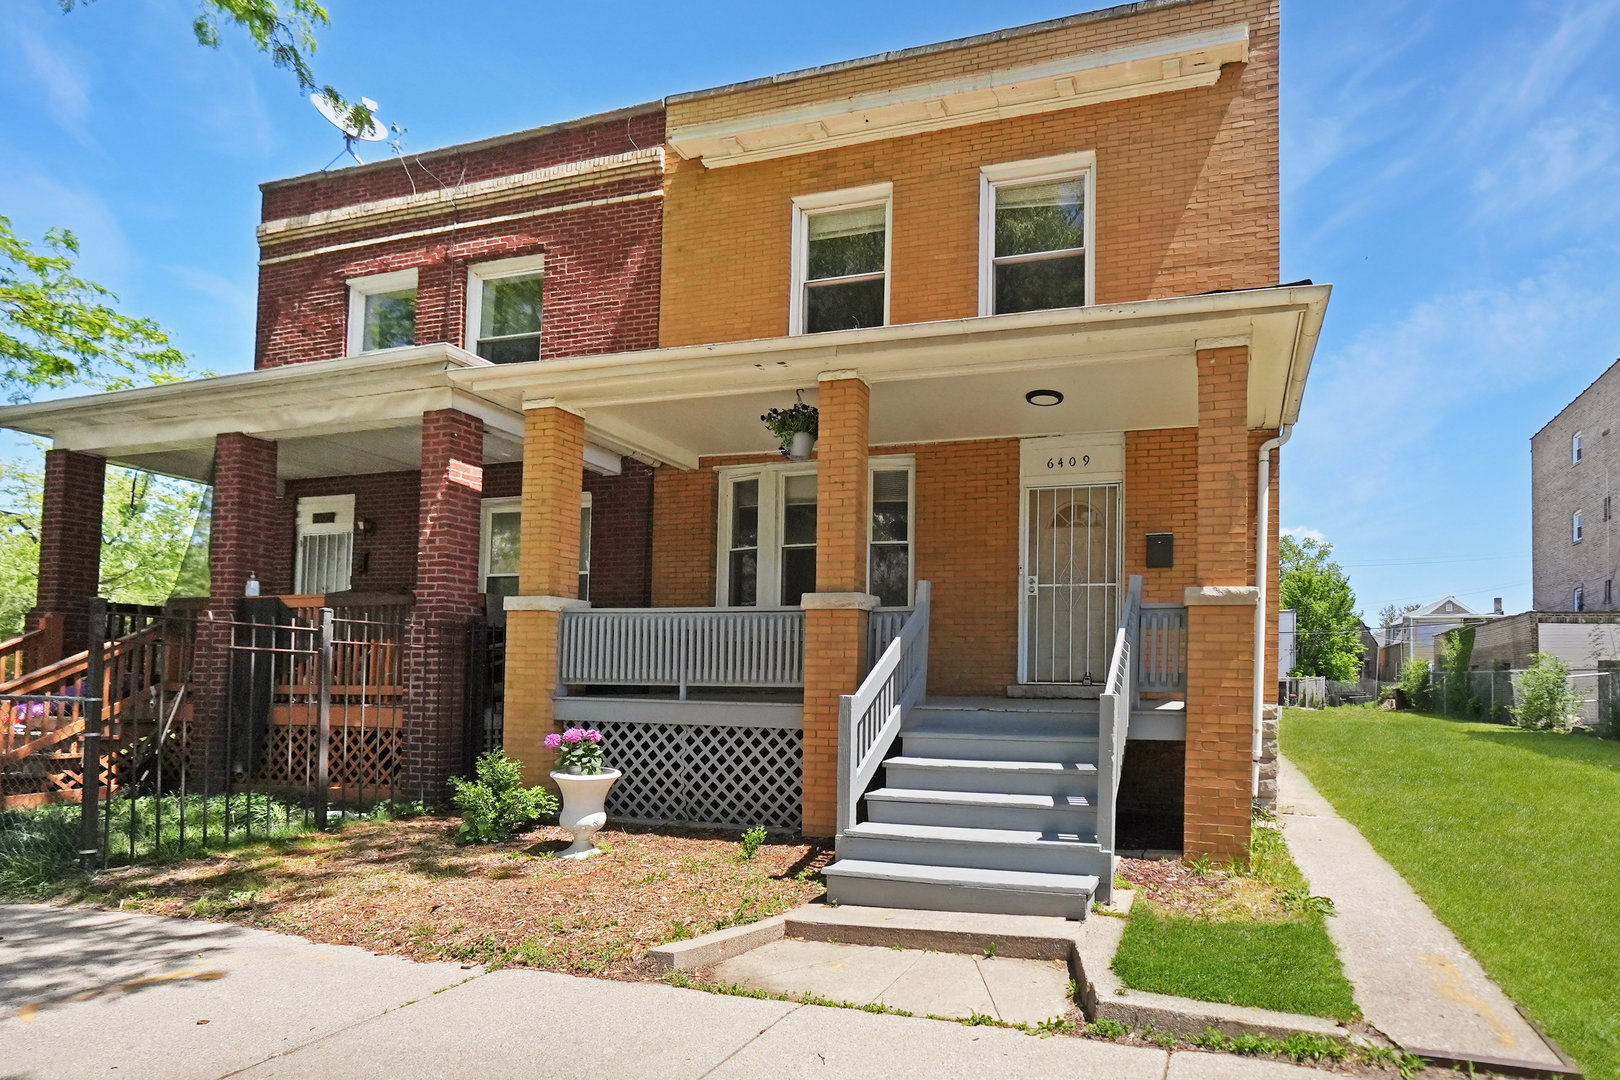
Active
$269,000
4
bds
|
2
ba
|
1,496
sqft
|
built
1910
6409 S Champlain Ave, Chicago, IL 60637
$122
Cash flow
2.4%
Cash-on-Cash Return
6.8%
Cap rate
0.9%
Rent to Value Ratio
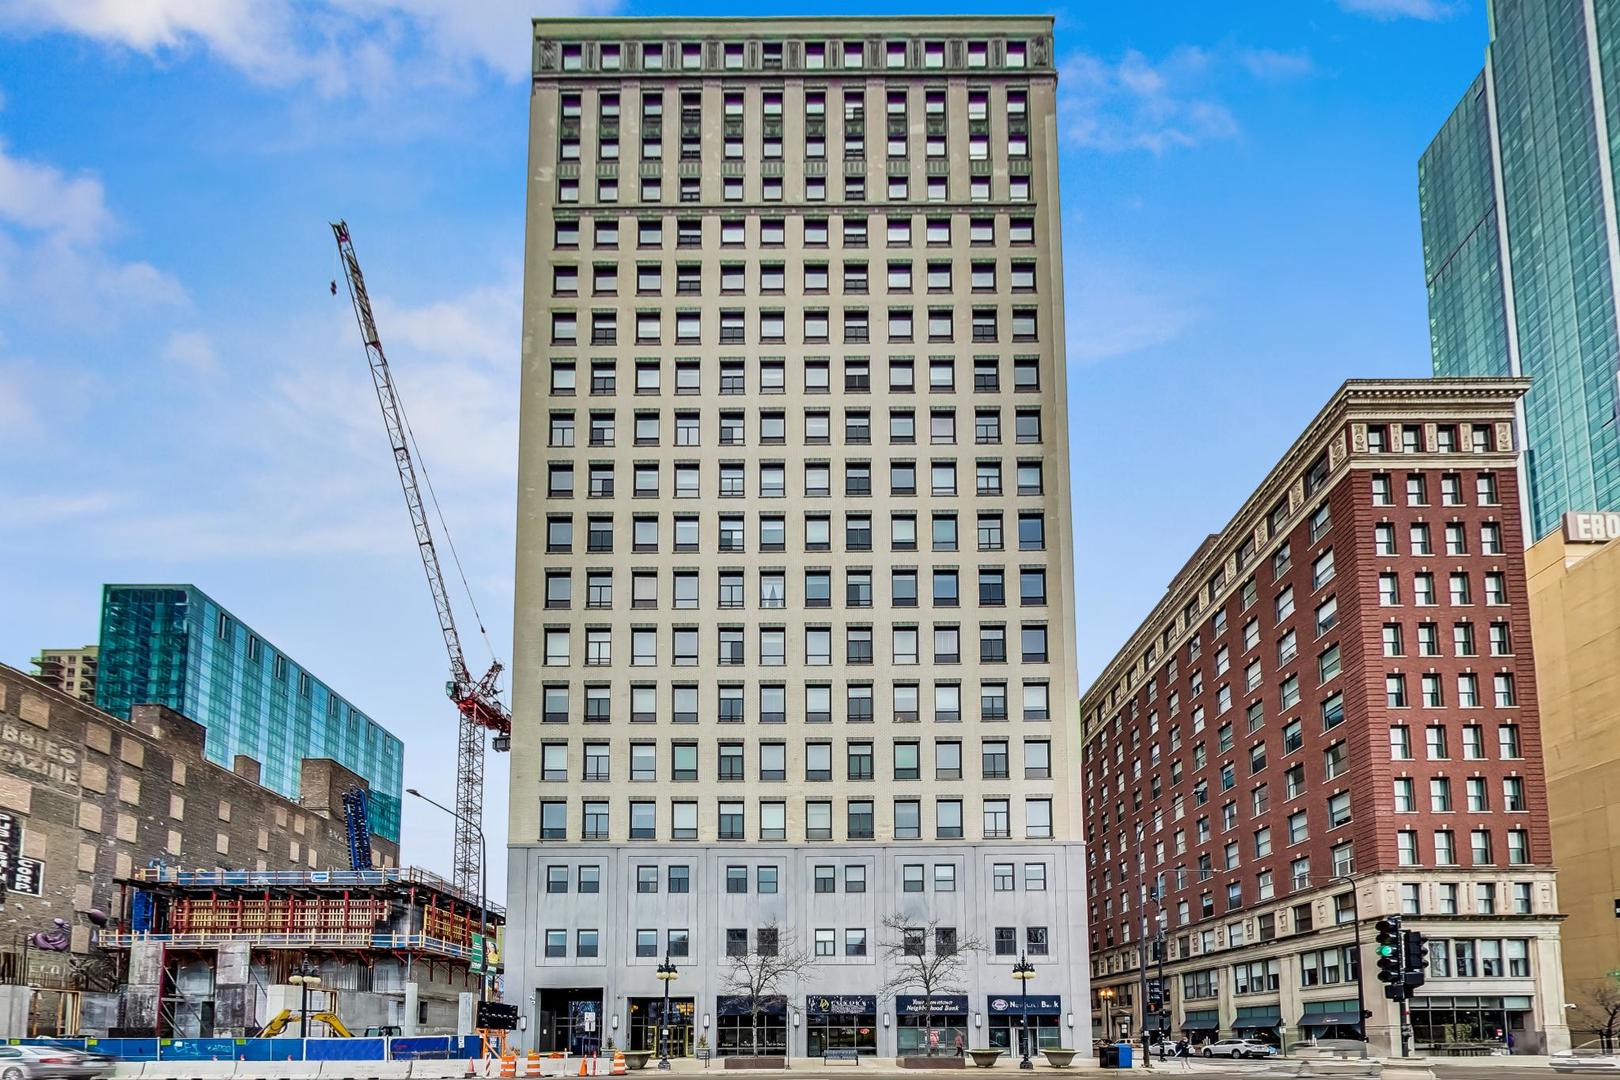
Active
$240,000
1
bds
|
1
ba
|
875
sqft
|
built
1911
910 S Michigan Ave, Chicago, IL 60605
$-544
Cash flow
-11.8%
Cash-on-Cash Return
3.6%
Cap rate
1.0%
Rent to Value Ratio
Active
$89,900
3
bds
|
2
ba
|
1,000
sqft
|
built
1885
527 N Springfield Ave, Chicago, IL 60624
$793
Cash flow
46.0%
Cash-on-Cash Return
16.9%
Cap rate
2.1%
Rent to Value Ratio
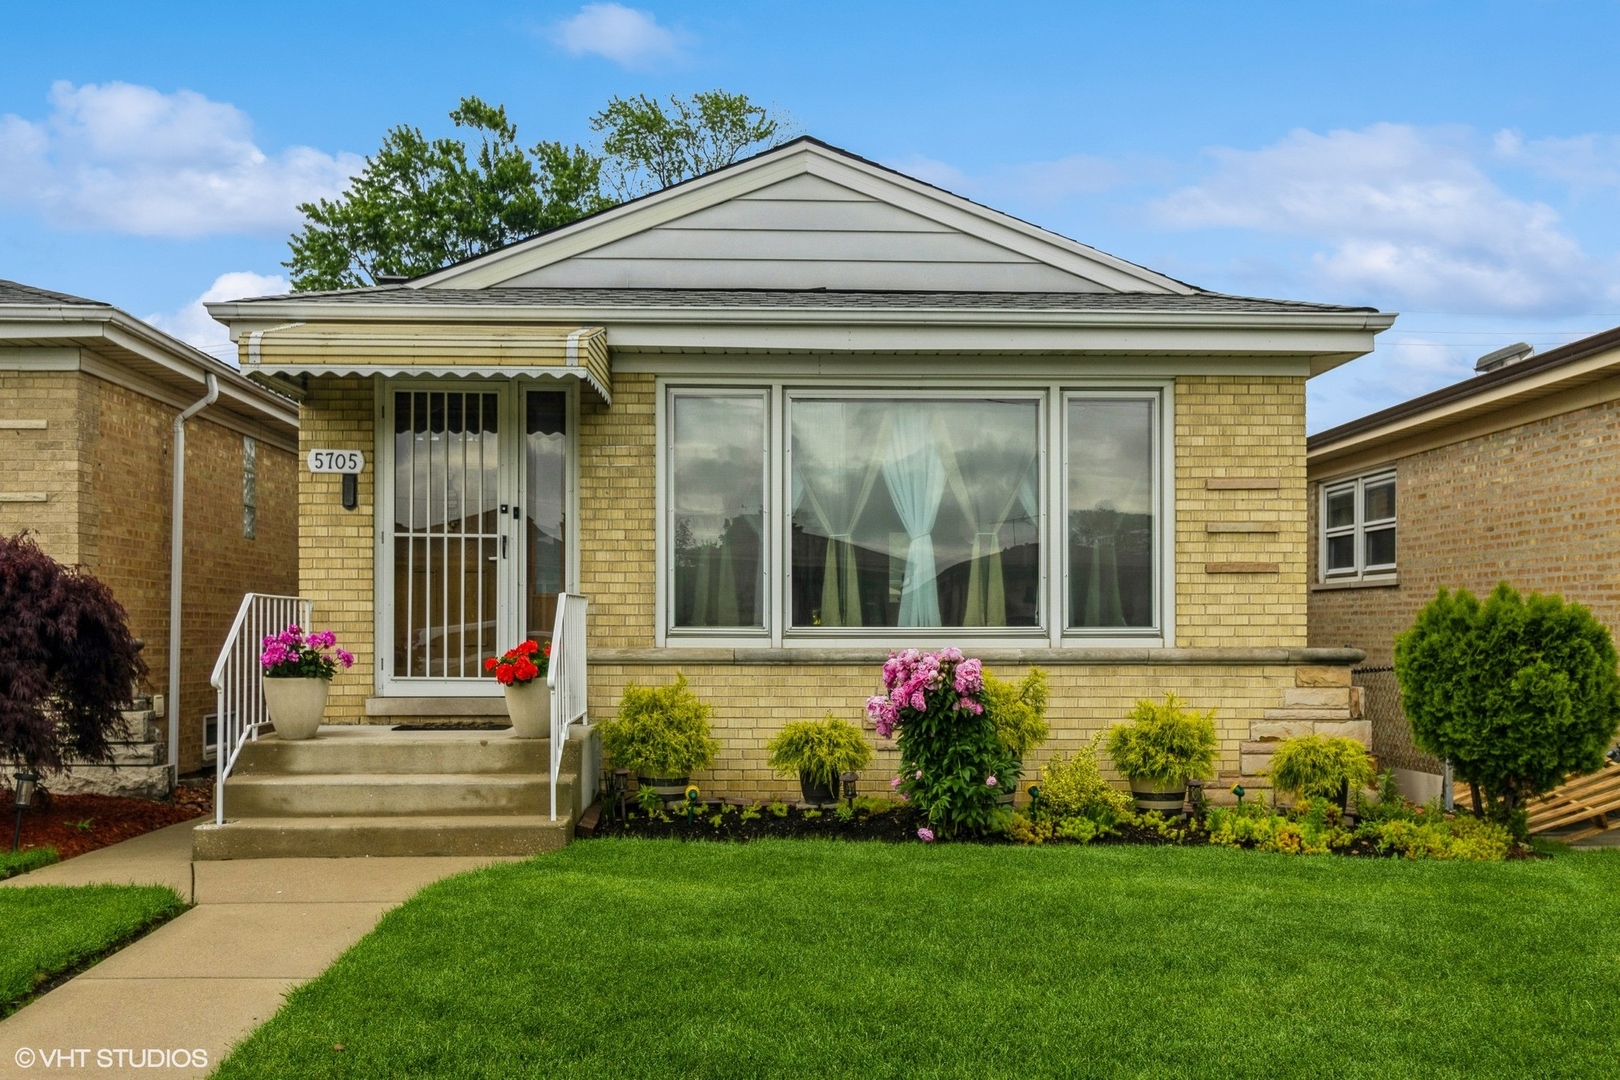
Active under contract
$399,000
3
bds
|
2
ba
|
1,104
sqft
|
built
1961
5705 N Oketo Ave, Chicago, IL 60631
$-548
Cash flow
-7.2%
Cash-on-Cash Return
4.6%
Cap rate
0.7%
Rent to Value Ratio
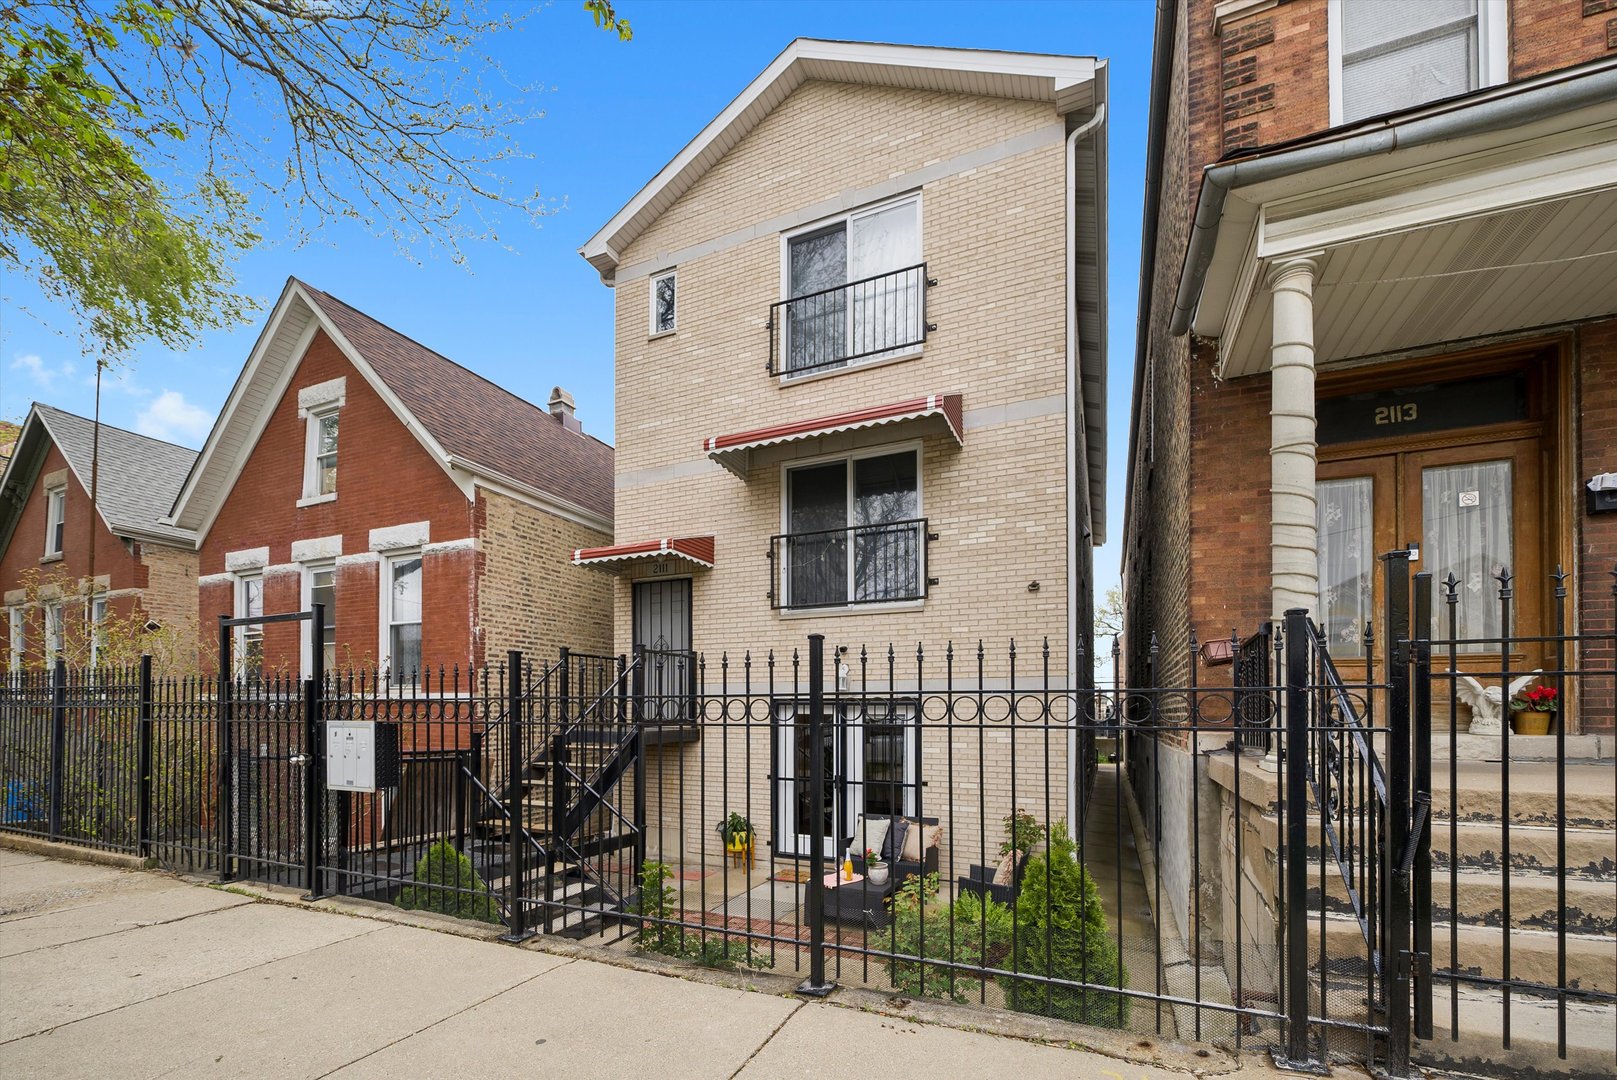
Active
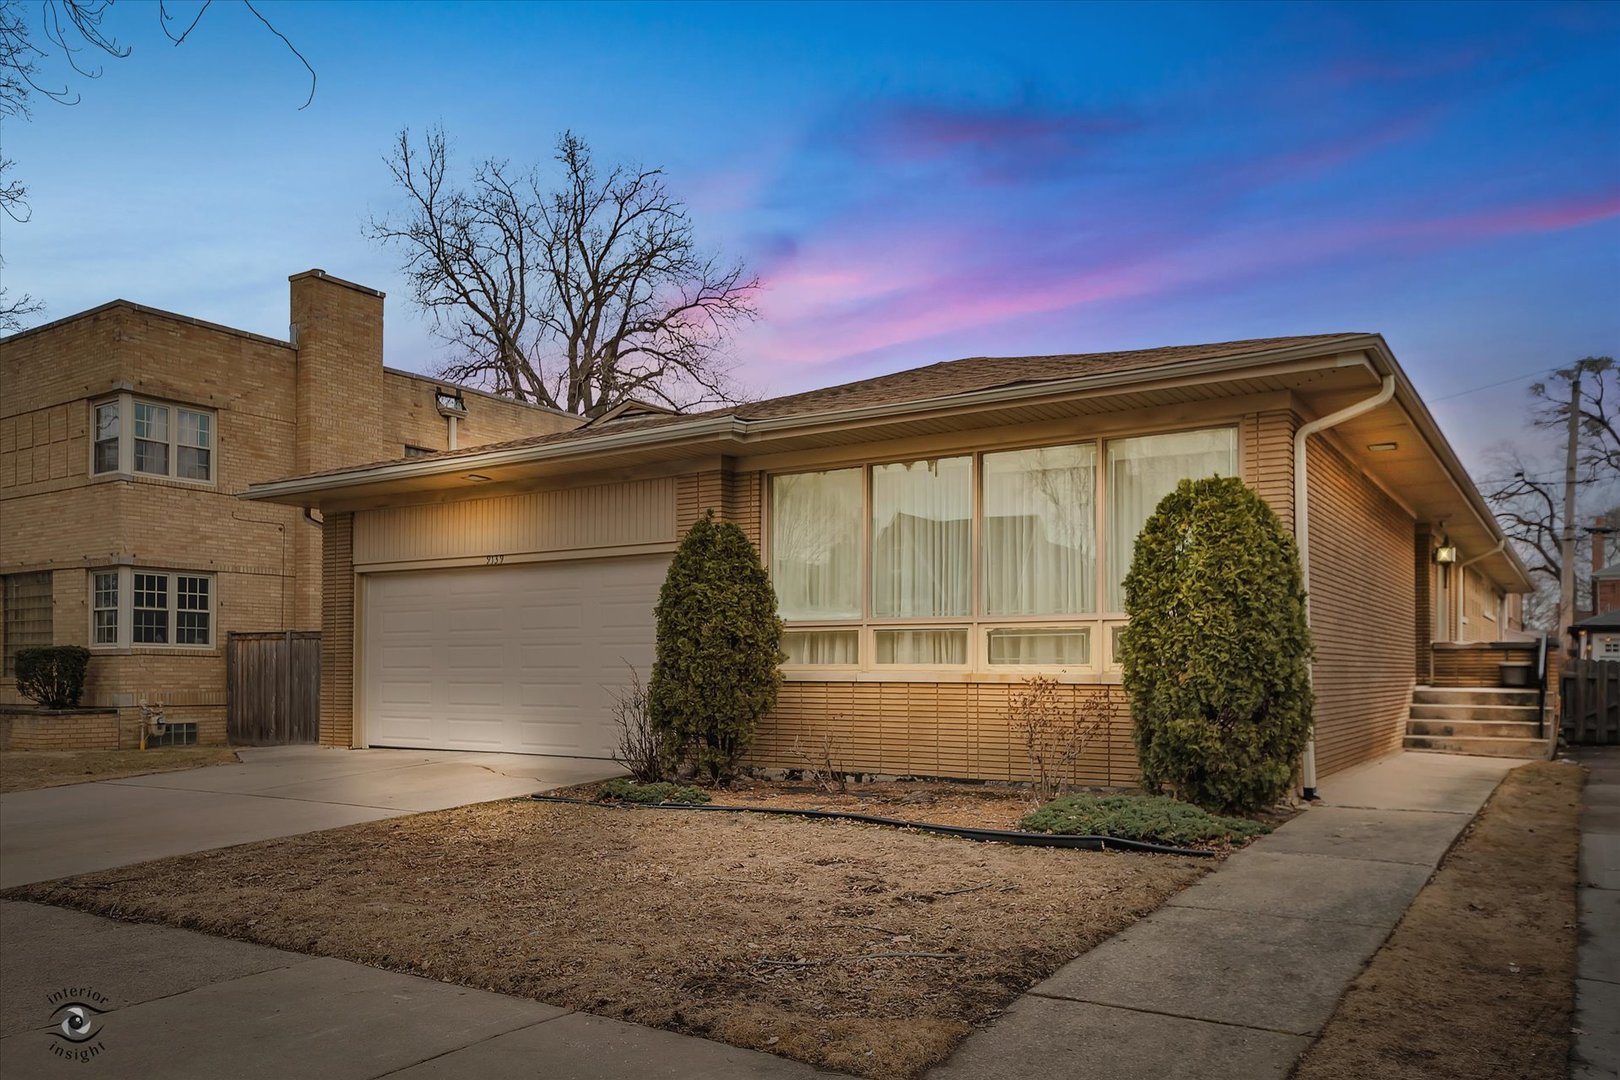
$234,900
3
bds
|
2
ba
|
1,300
sqft
|
built
2007
2111 S Fairfield Ave, Chicago, IL 60608
$87
Cash flow
1.9%
Cash-on-Cash Return
6.7%
Cap rate
1.0%
Rent to Value Ratio
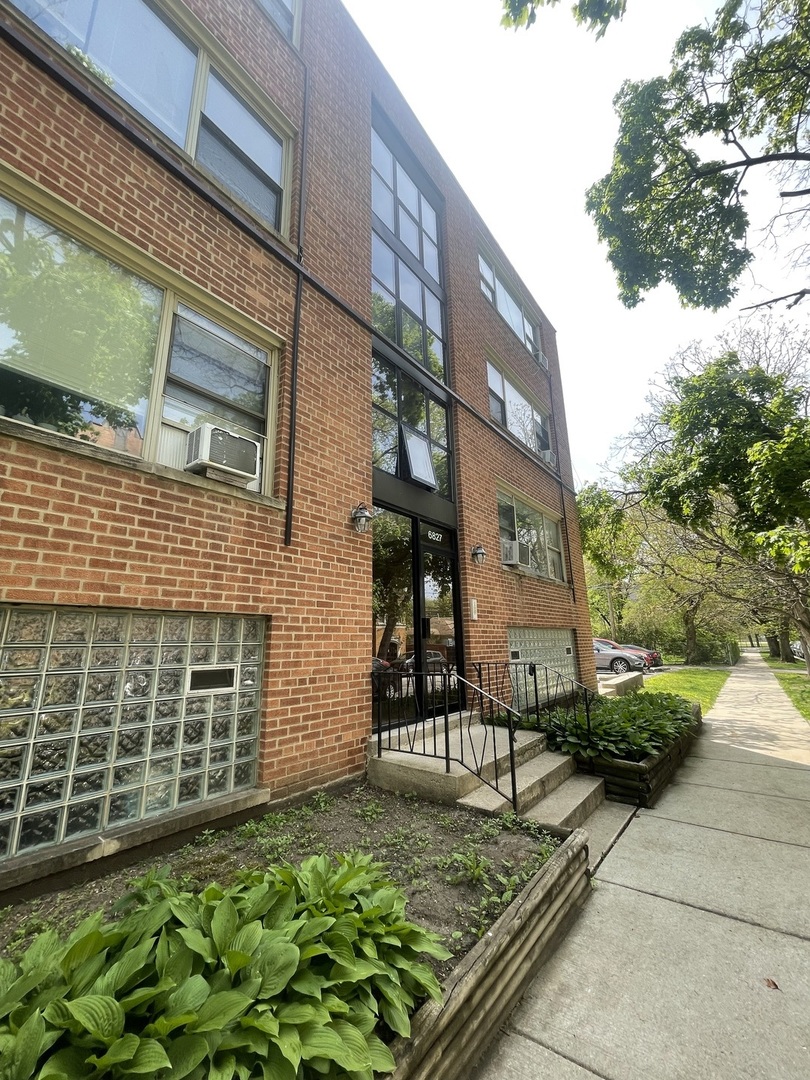
Active
$145,000
1
bds
|
1
ba
|
700
sqft
|
built
1970
6827 N Oakley Ave, Chicago, IL 60645
$-323
Cash flow
-11.6%
Cash-on-Cash Return
3.6%
Cap rate
0.9%
Rent to Value Ratio
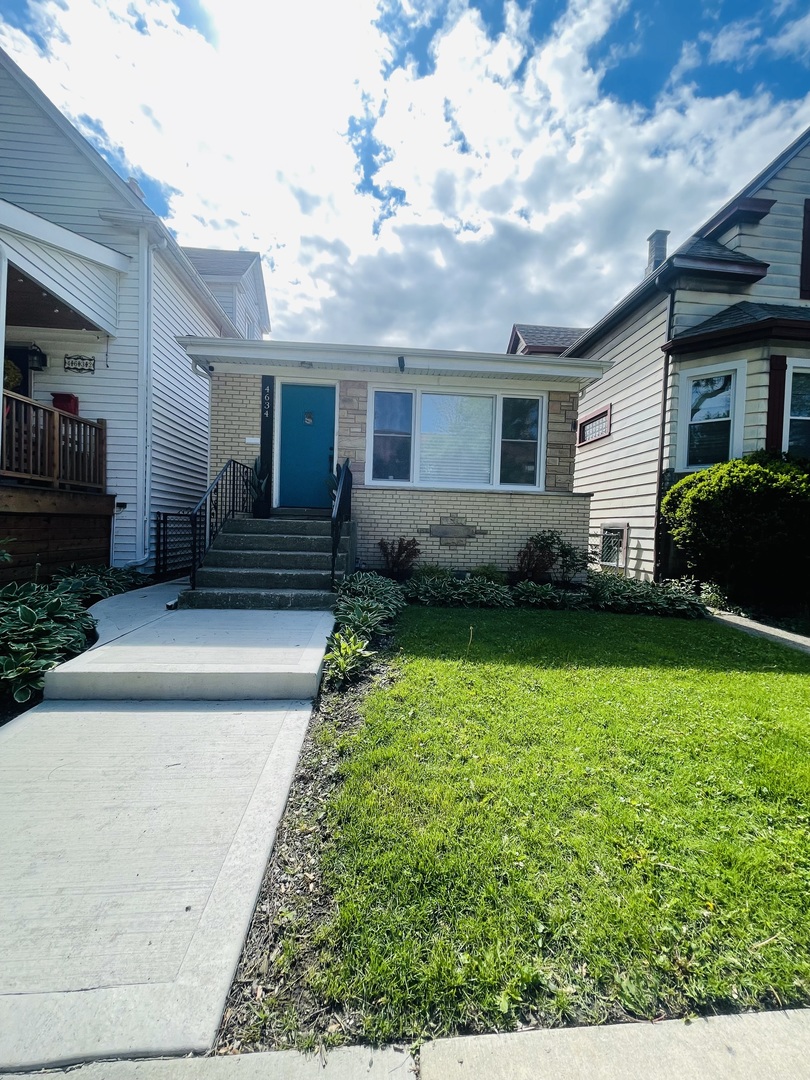
Active
$520,000
3
bds
|
2
ba
|
2,016
sqft
|
built
1961
4634 N Hamlin Ave, Chicago, IL 60625
$-663
Cash flow
-6.7%
Cash-on-Cash Return
4.8%
Cap rate
0.7%
Rent to Value Ratio
Active
$359,900
3
bds
|
2
ba
|
1,371
sqft
|
built
1948
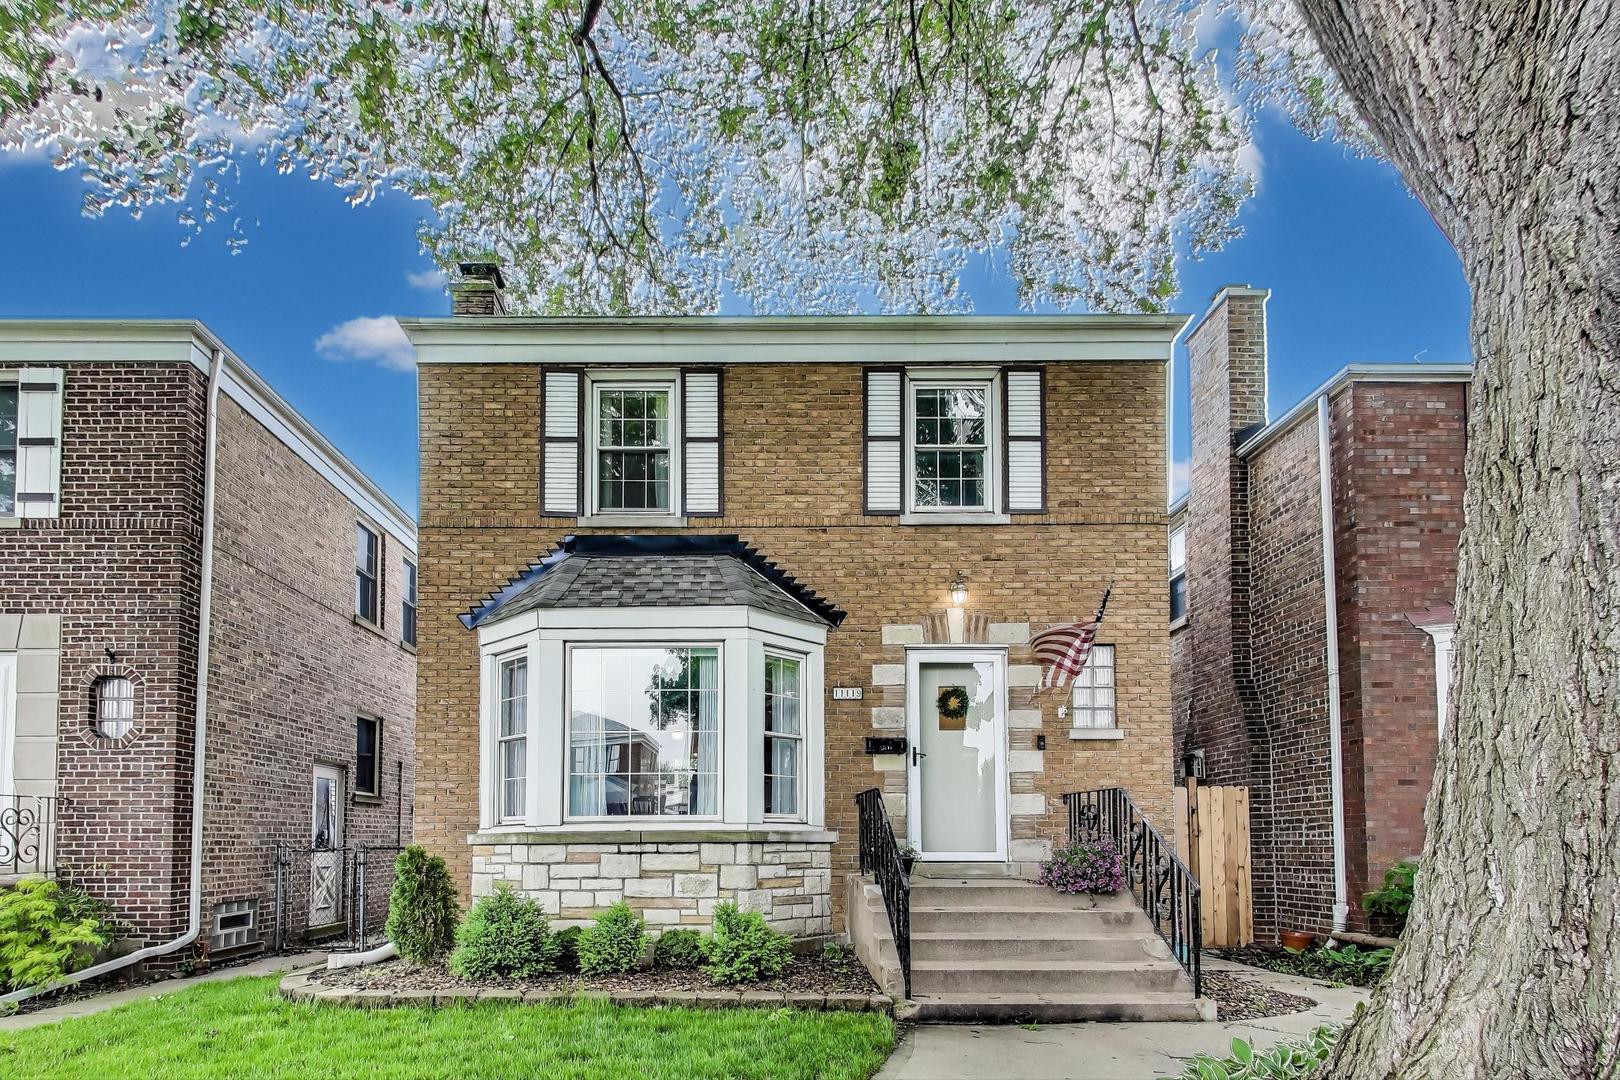
11119 S Maplewood Ave, Chicago, IL 60655
$-496
Cash flow
-7.2%
Cash-on-Cash Return
4.6%
Cap rate
0.7%
Rent to Value Ratio
Active
$815,000
3
bds
|
4
ba
|
3,600
sqft
|
built
1921
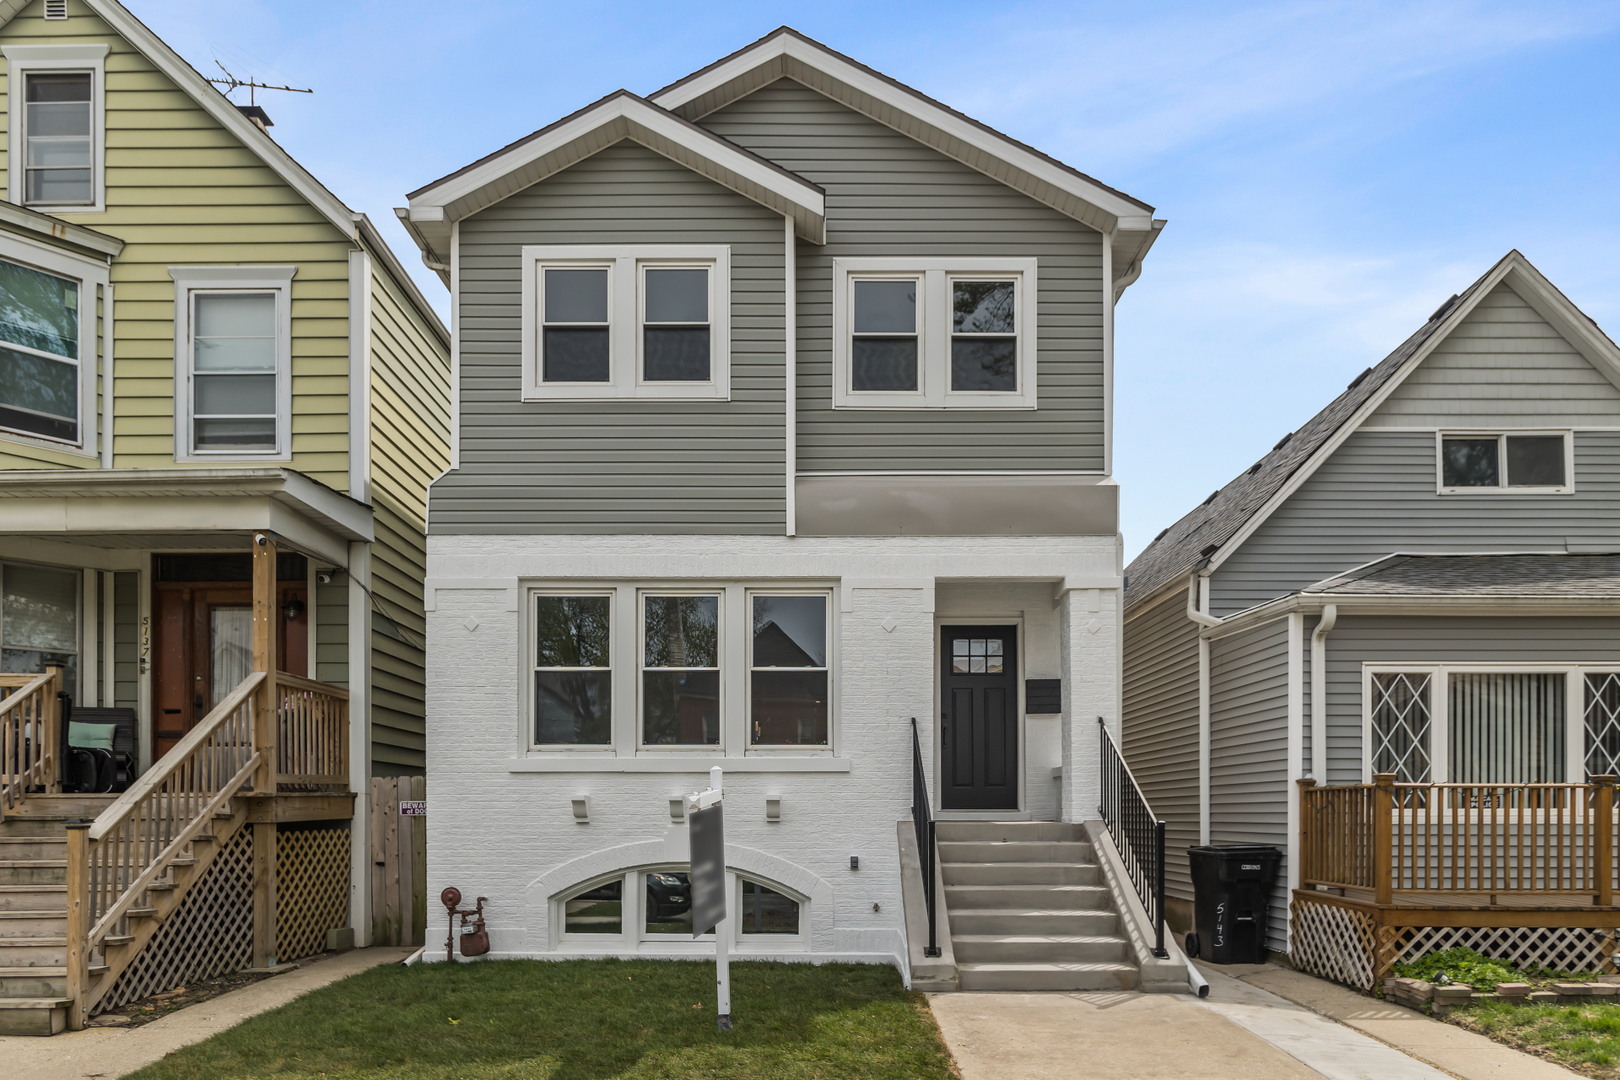
5141 W Dakin St, Chicago, IL 60641
$-2,140
Cash flow
-13.7%
Cash-on-Cash Return
3.1%
Cap rate
0.5%
Rent to Value Ratio
Active
$415,000
1
bds
|
1
ba
|
706
sqft
|
built
1968
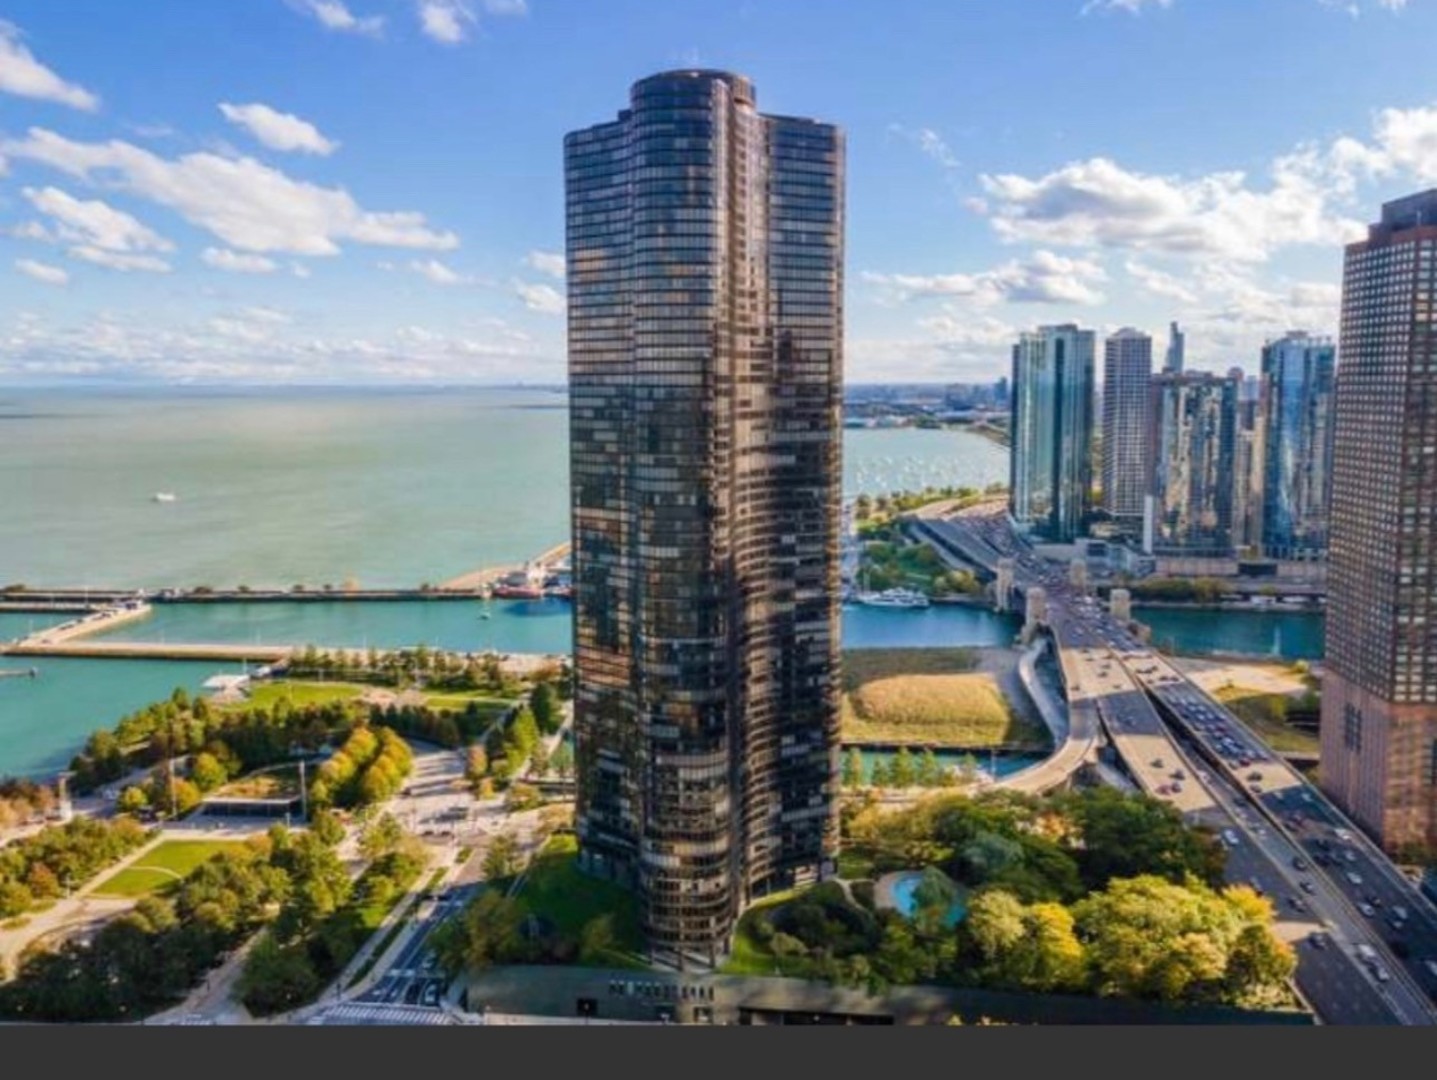
505 N Lake Shore Dr, Chicago, IL 60611
$256
Cash flow
3.2%
Cash-on-Cash Return
7.0%
Cap rate
1.2%
Rent to Value Ratio
Active
$415,000
3
bds
|
2
ba
|
1,914
sqft
|
built
1993
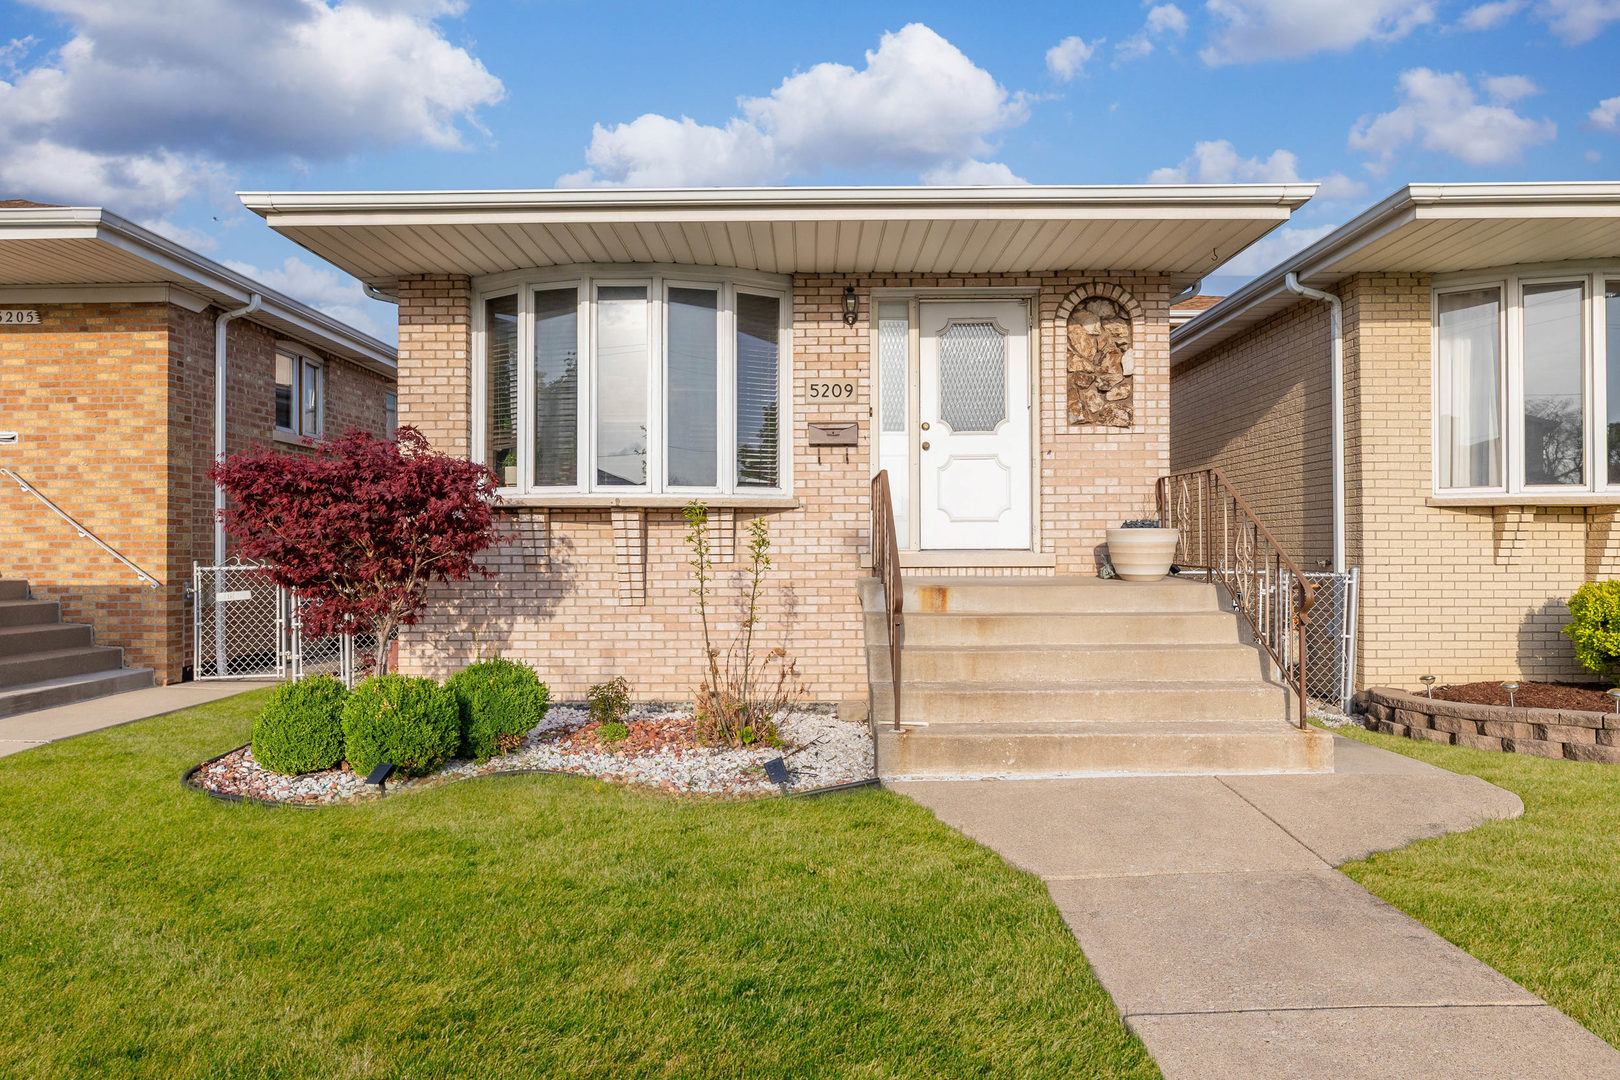
5209 S Narragansett Ave, Chicago, IL 60638
$-523
Cash flow
-6.6%
Cash-on-Cash Return
4.8%
Cap rate
0.7%
Rent to Value Ratio
Active
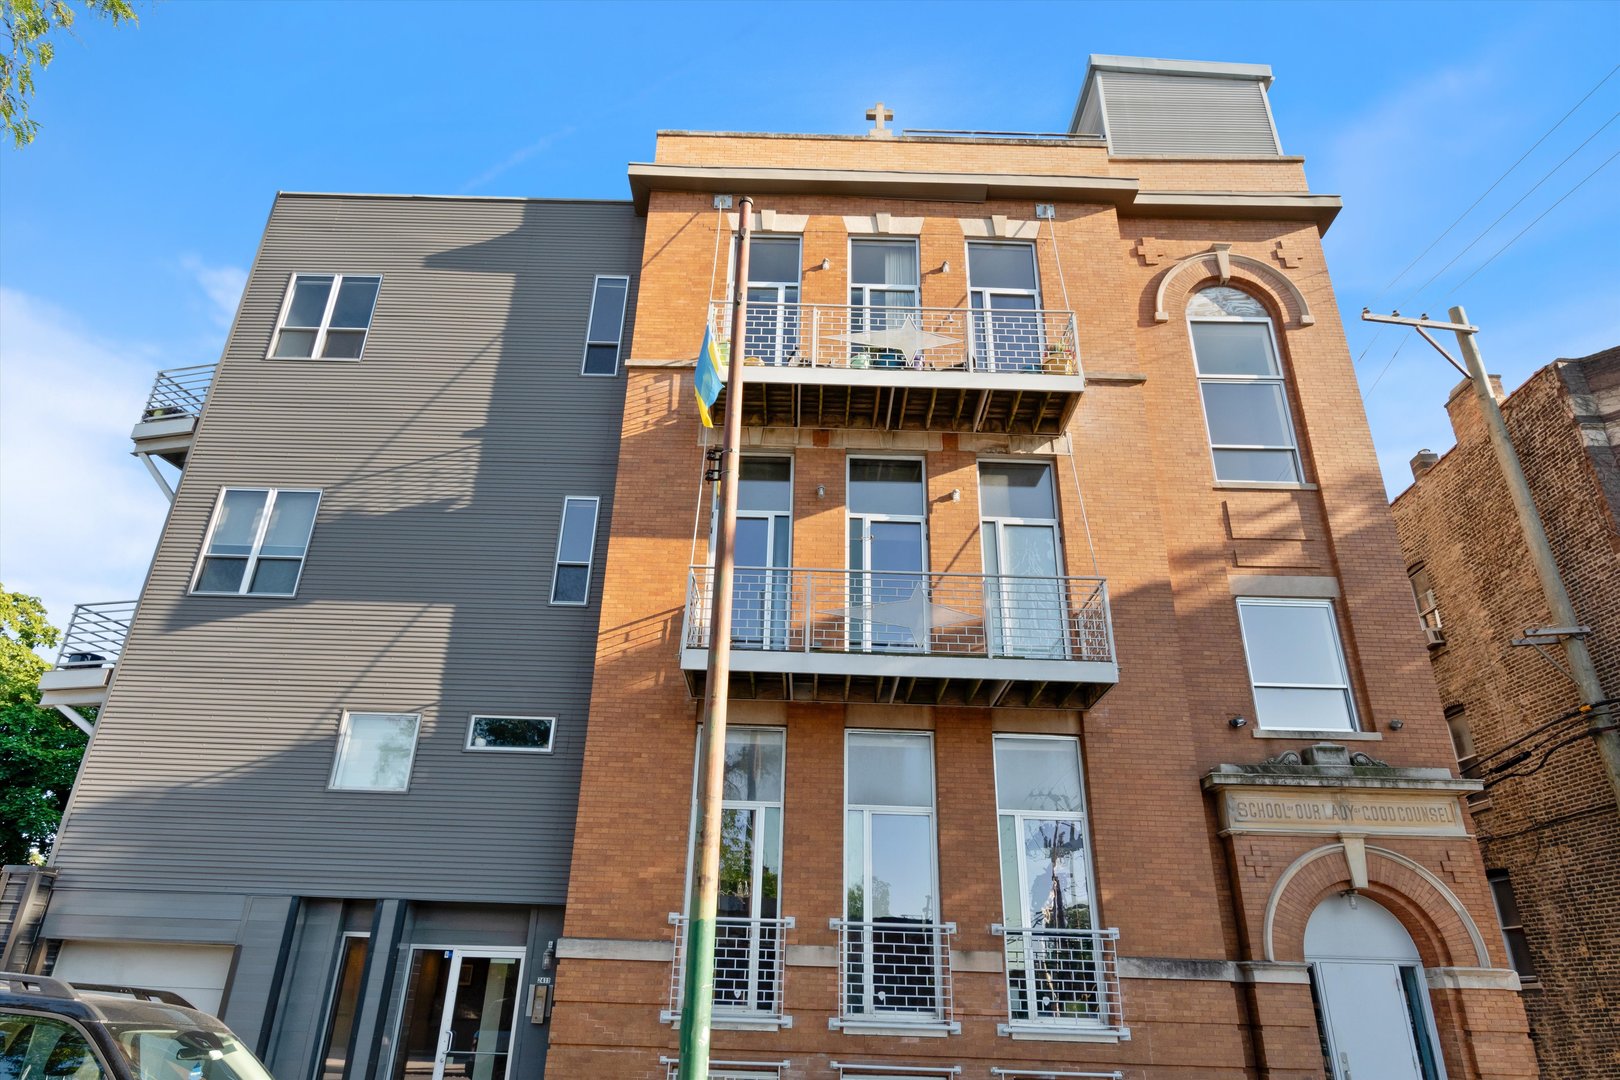
$325,000
1
bds
|
2
ba
|
0
sqft
|
built
1997
1418 W Cortez St, Chicago, IL 60642
$-470
Cash flow
-7.5%
Cash-on-Cash Return
4.5%
Cap rate
0.8%
Rent to Value Ratio
Active
$260,000
1
bds
|
1
ba
|
825
sqft
|
built
1963
1355 N Clark St, Chicago, IL 60610
$-654
Cash flow
-13.1%
Cash-on-Cash Return
3.3%
Cap rate
1.1%
Rent to Value Ratio
Active
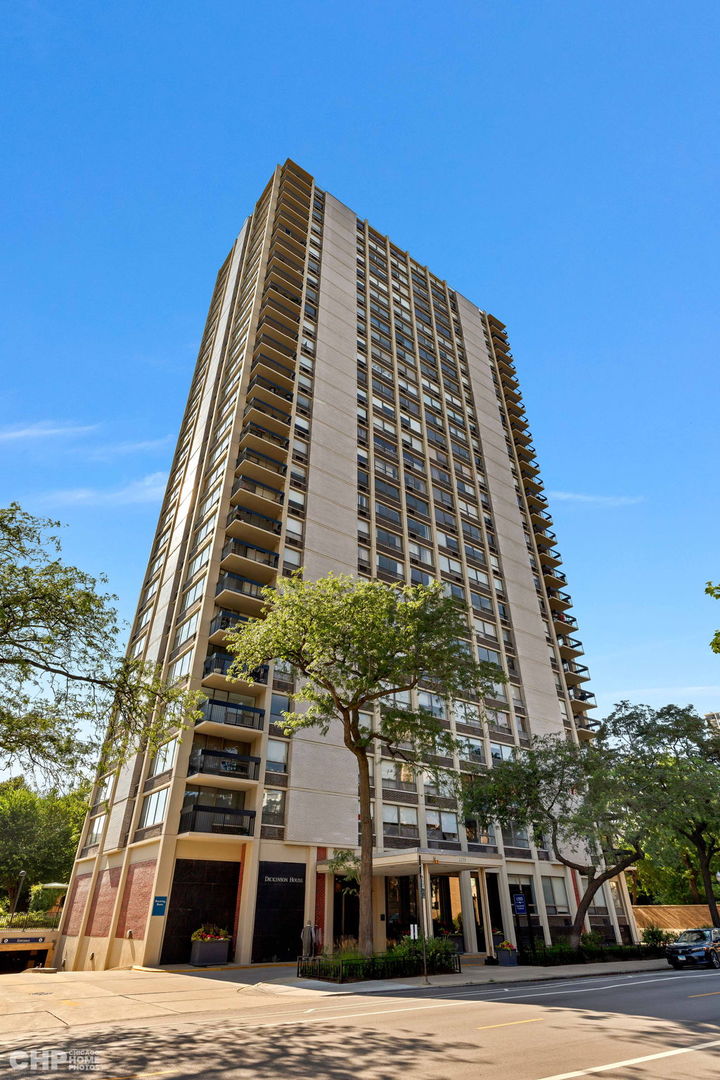
$625,000
1
bds
|
2
ba
|
1,897
sqft
|
built
1974
1516 N State Pkwy, Chicago, IL 60610
$-2,436
Cash flow
-20.3%
Cash-on-Cash Return
1.6%
Cap rate
0.7%
Rent to Value Ratio
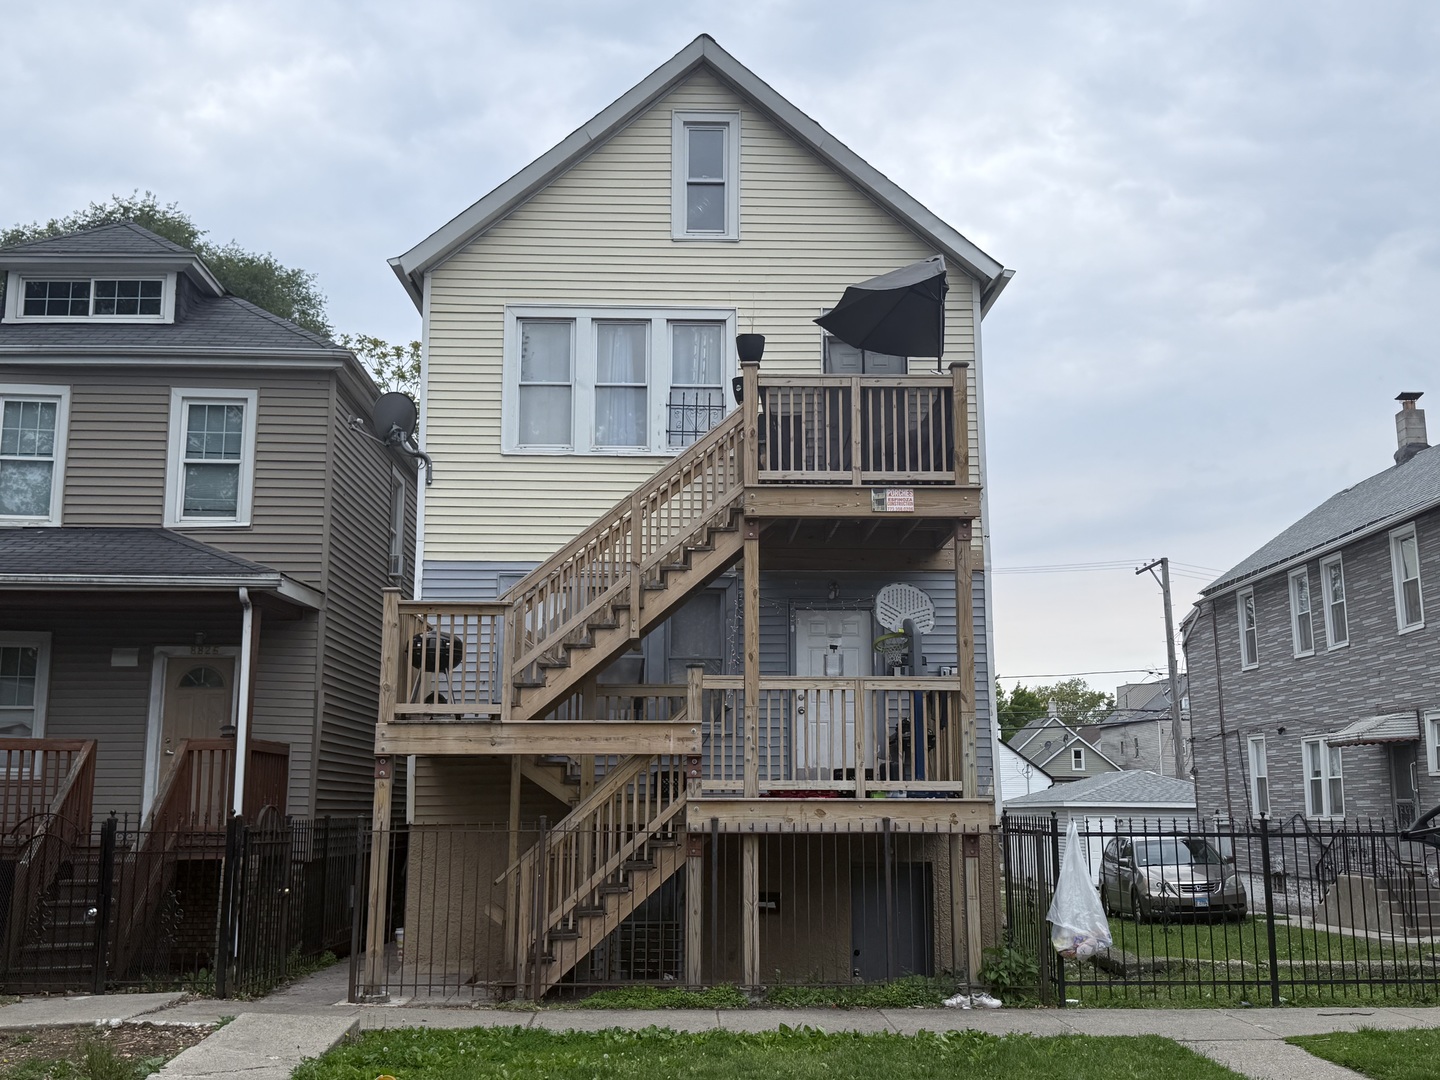
Active
$319,900
8
bds
|
3
ba
|
0
sqft
|
built
1898
6948 S Eberhart Ave, Chicago, IL 60637
$-574
Cash flow
-9.4%
Cash-on-Cash Return
4.1%
Cap rate
0.6%
Rent to Value Ratio
Active
$389,900
4
bds
|
2
ba
|
1,107
sqft
|
built
1923
5941 W Waveland Ave, Chicago, IL 60634
$-464
Cash flow
-6.2%
Cash-on-Cash Return
4.9%
Cap rate
0.7%
Rent to Value Ratio
Active
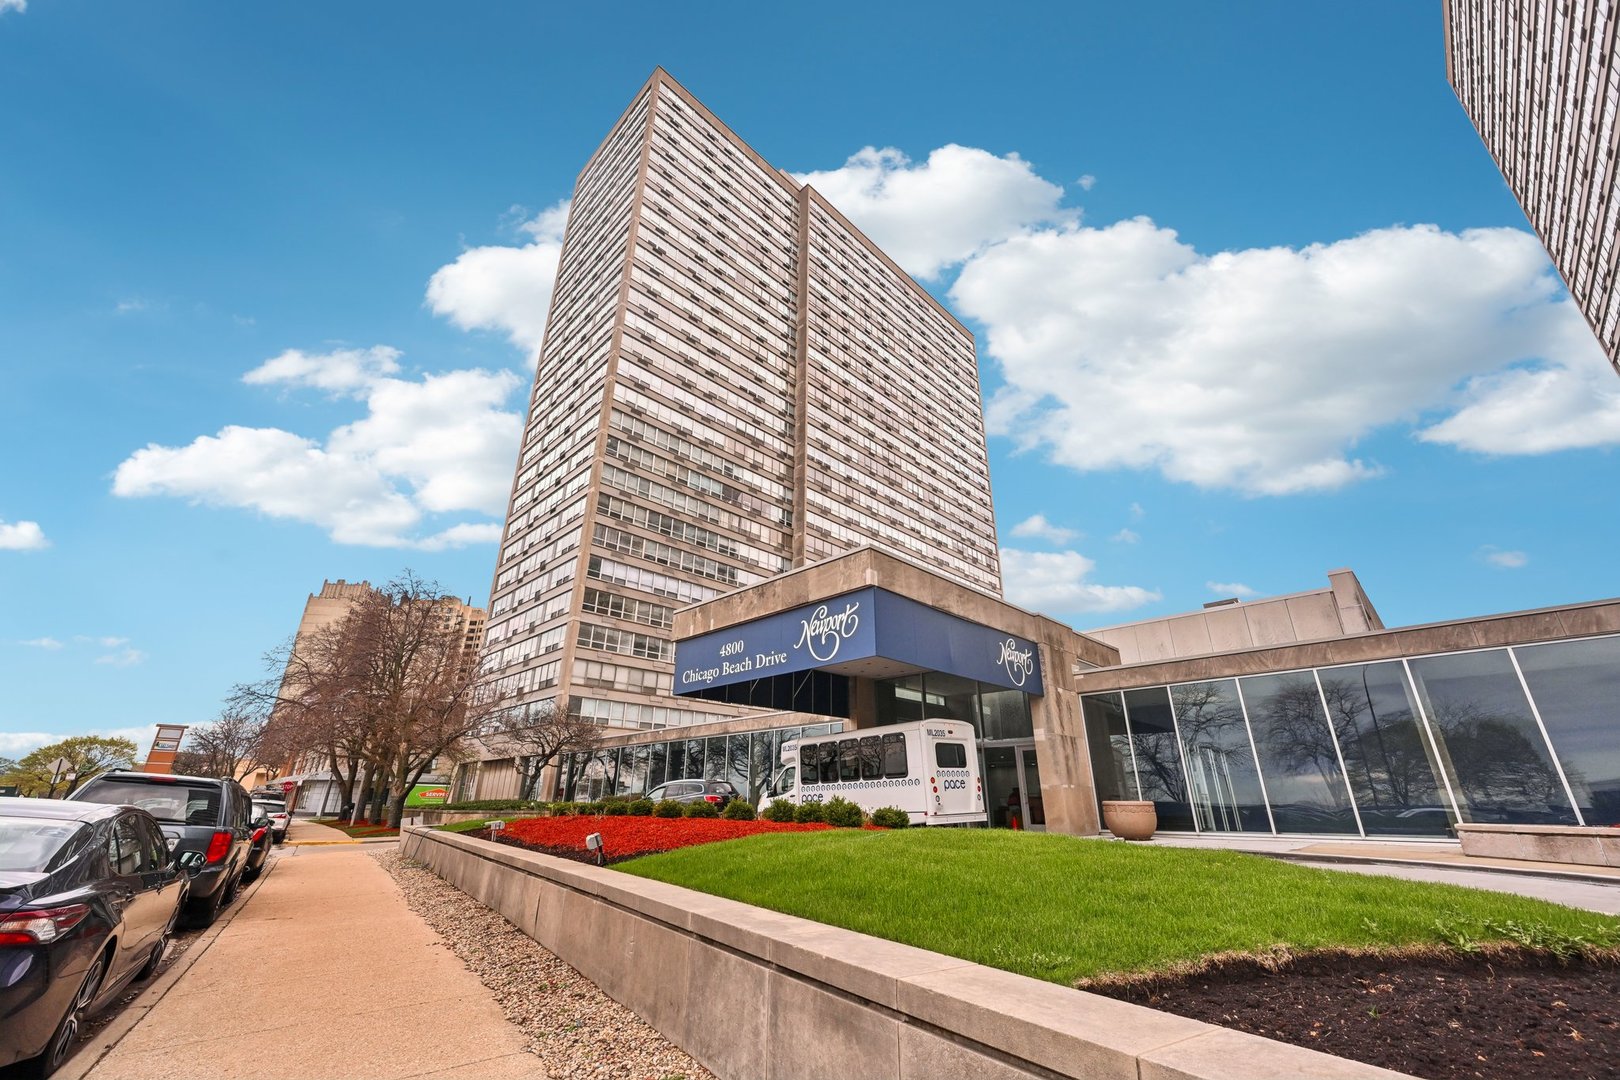
$145,000
1
bds
|
1
ba
|
796
sqft
|
built
1982
4800 S Chicago Beach Dr, Chicago, IL 60615
$-388
Cash flow
-14.0%
Cash-on-Cash Return
3.1%
Cap rate
1.4%
Rent to Value Ratio
Active
$304,999
4
bds
|
2
ba
|
1,312
sqft
|
built
1956
4918 S Luna Ave, Chicago, IL 60638
$-354
Cash flow
-6.1%
Cash-on-Cash Return
4.9%
Cap rate
0.8%
Rent to Value Ratio
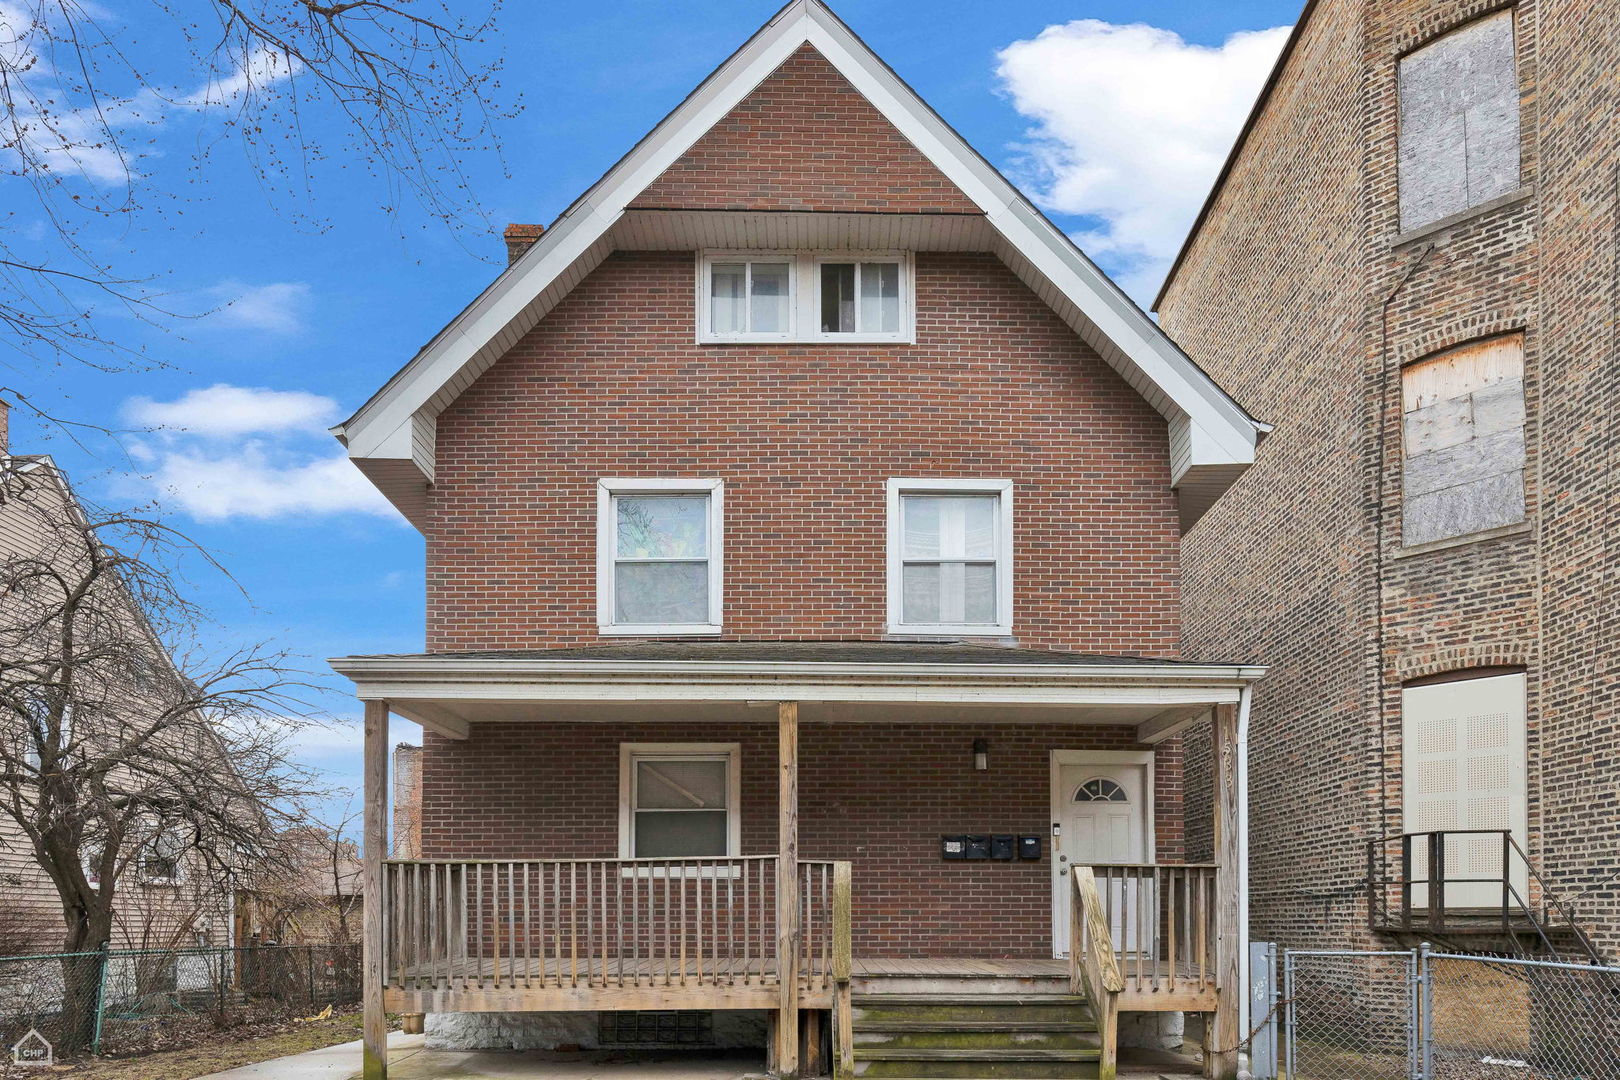
Active
$245,000
4
bds
|
2
ba
|
1,439
sqft
|
built
1898
7227 S Paulina St, Chicago, IL 60636
$458
Cash flow
9.8%
Cash-on-Cash Return
8.5%
Cap rate
1.1%
Rent to Value Ratio
Active
$385,000
2
bds
|
2
ba
|
1,165
sqft
|
built
1989
200 N Dearborn St, Chicago, IL 60601
$-1,653
Cash flow
-22.4%
Cash-on-Cash Return
1.1%
Cap rate
0.8%
Rent to Value Ratio
Active
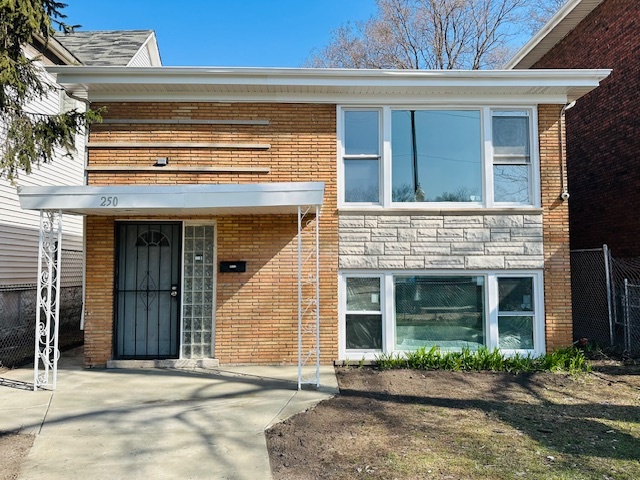
$249,900
5
bds
|
2
ba
|
2,065
sqft
|
built
1963
250 W 119th St, Chicago, IL 60628
$-450
Cash flow
-9.4%
Cash-on-Cash Return
4.1%
Cap rate
0.6%
Rent to Value Ratio
Active
$549,900
2
bds
|
2
ba
|
1,240
sqft
|
built
1983
10 E Ontario St, Chicago, IL 60611
$-2,332
Cash flow
-22.1%
Cash-on-Cash Return
1.2%
Cap rate
0.7%
Rent to Value Ratio
Pending
$549,900
10
bds
|
4
ba
|
0
sqft
|
built
1895
1533 E 65th Pl, Chicago, IL 60637
$-1,540
Cash flow
-14.6%
Cash-on-Cash Return
2.9%
Cap rate
0.4%
Rent to Value Ratio
Active
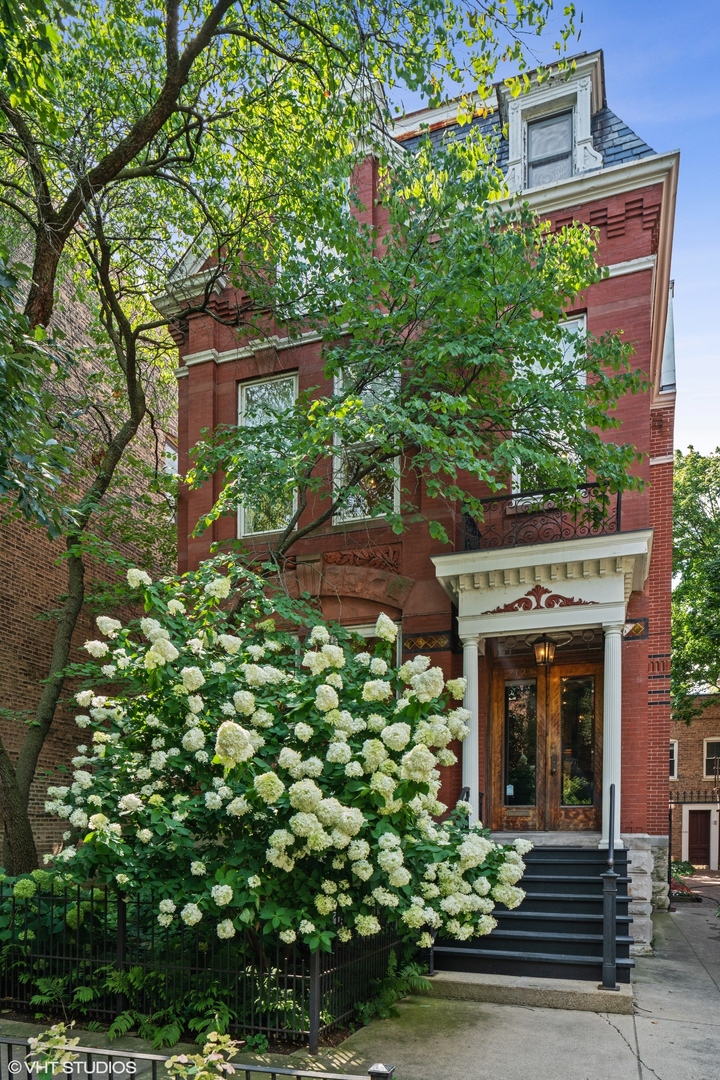
$949,999
3
bds
|
3
ba
|
0
sqft
|
built
2005
2411 W Walton St, Chicago, IL 60622
$-2,444
Cash flow
-13.4%
Cash-on-Cash Return
3.2%
Cap rate
0.7%
Rent to Value Ratio
Active
$389,999
5
bds
|
2
ba
|
0
sqft
|
built
1910
5726 S Elizabeth St, Chicago, IL 60636
$-603
Cash flow
-8.1%
Cash-on-Cash Return
4.4%
Cap rate
0.6%
Rent to Value Ratio
Active
$292,000
1
bds
|
1
ba
|
850
sqft
|
built
2005
545 N Dearborn St, Chicago, IL 60654
$-943
Cash flow
-16.8%
Cash-on-Cash Return
2.4%
Cap rate
0.9%
Rent to Value Ratio
Active
$499,900
3
bds
|
3
ba
|
3,400
sqft
|
built
1929
10215 S Charles St, Chicago, IL 60643
$-603
Cash flow
-6.3%
Cash-on-Cash Return
4.8%
Cap rate
0.7%
Rent to Value Ratio
Active
$2,795,000
6
bds
|
6
ba
|
6,500
sqft
|
built
1890
2124 N Cleveland Ave, Chicago, IL 60614
$-13,883
Cash flow
-25.9%
Cash-on-Cash Return
0.3%
Cap rate
0.3%
Rent to Value Ratio
Active
$575,000
4
bds
|
5
ba
|
2,954
sqft
|
built
1956
9139 S Oakley Ave, Chicago, IL 60643
$-763
Cash flow
-6.9%
Cash-on-Cash Return
4.7%
Cap rate
0.7%
Rent to Value Ratio
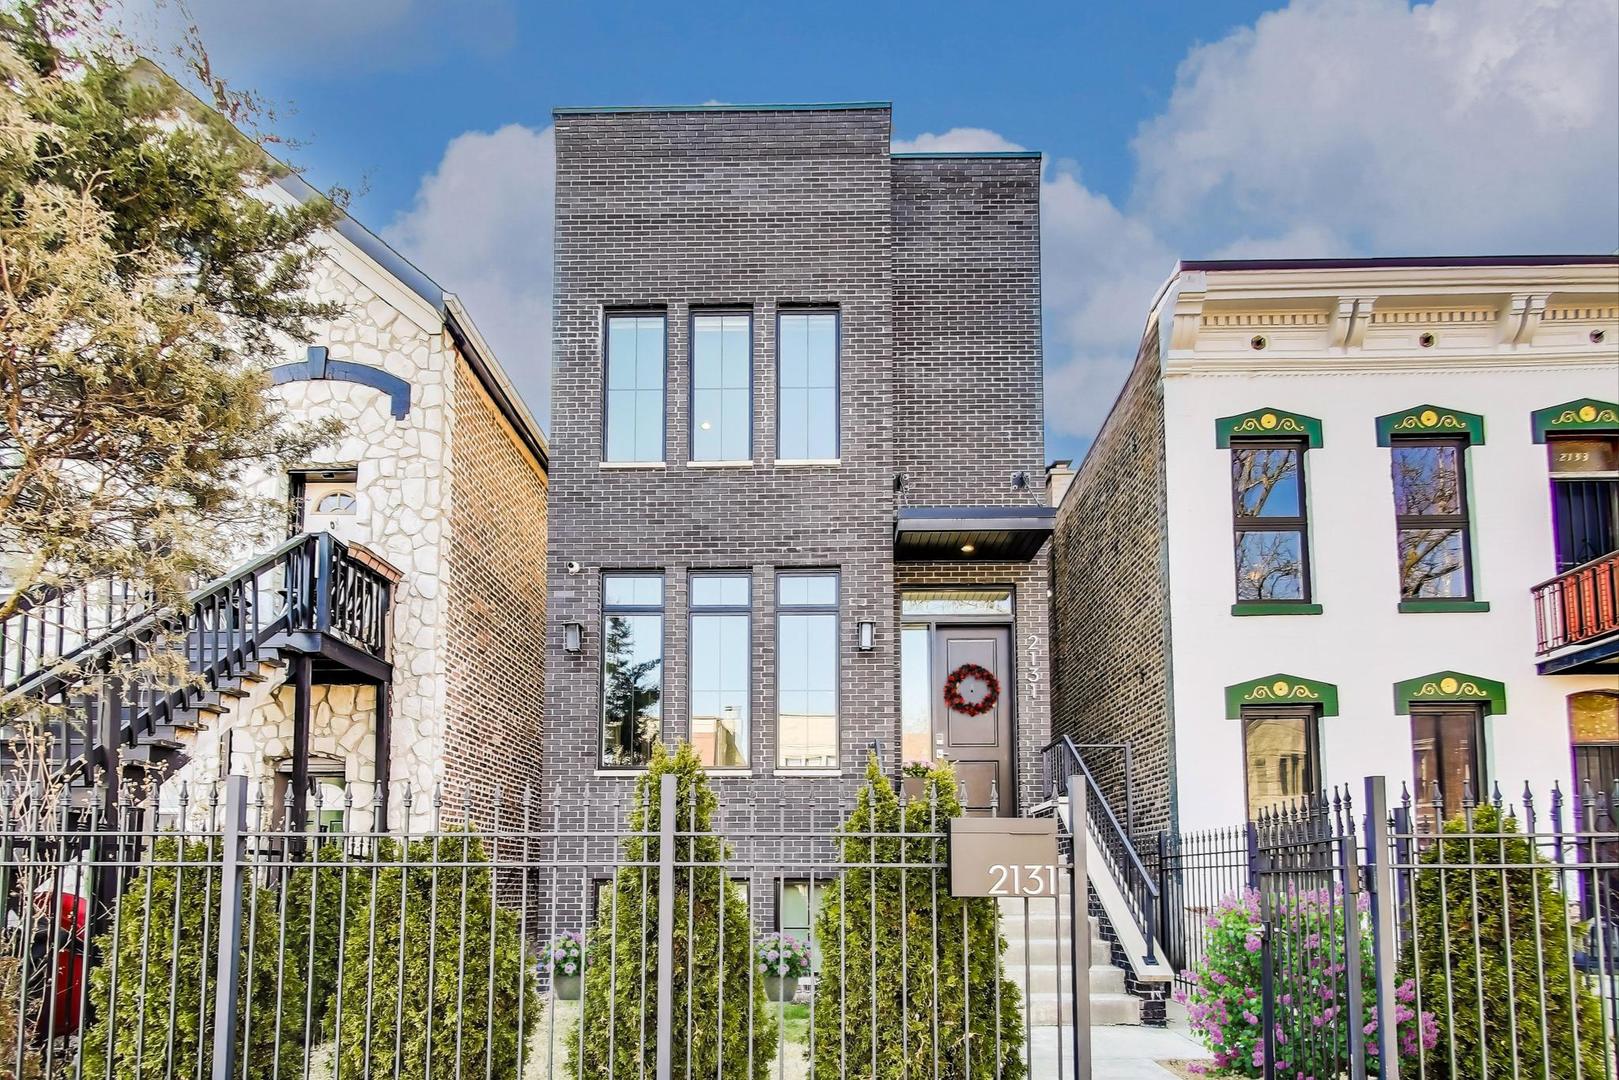
Active
$1,675,000
5
bds
|
4
ba
|
4,200
sqft
|
built
2019
2131 W Huron St, Chicago, IL 60612
$-4,035
Cash flow
-12.6%
Cash-on-Cash Return
3.4%
Cap rate
0.6%
Rent to Value Ratio
Active
$269,000
11
bds
|
5
ba
|
0
sqft
|
built
1884
8822 S Exchange Ave, Chicago, IL 60617
$-428
Cash flow
-8.3%
Cash-on-Cash Return
4.4%
Cap rate
0.6%
Rent to Value Ratio
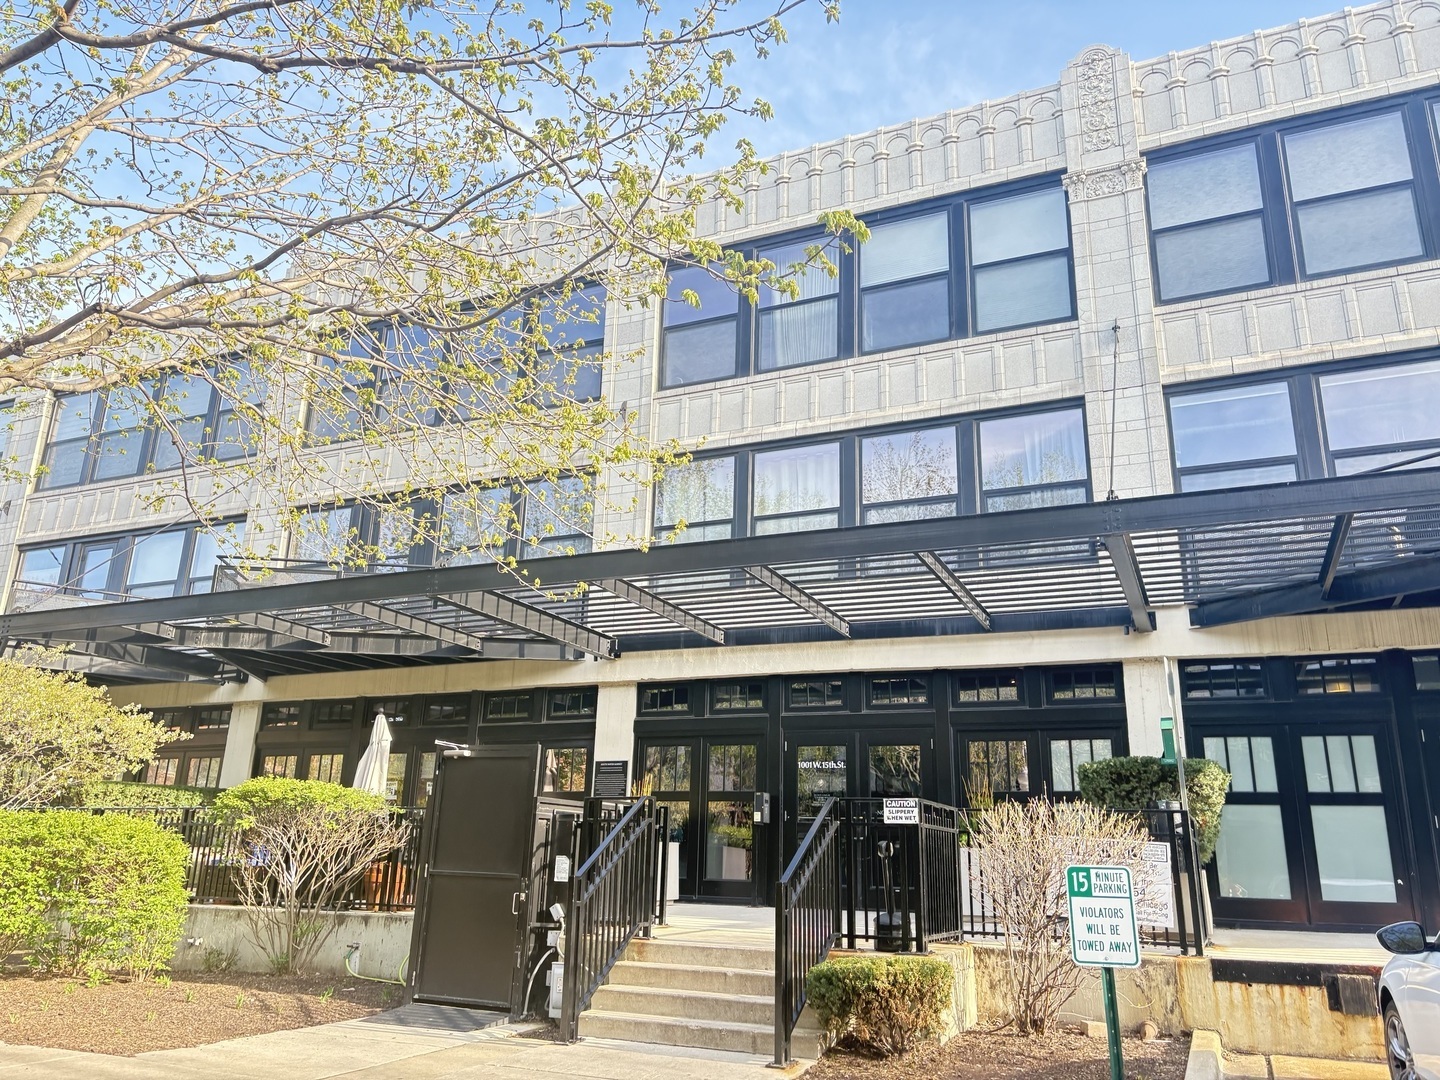
Active
$330,000
2
bds
|
2
ba
|
980
sqft
|
built
1920
1001 W 15th St, Chicago, IL 60608
$-956
Cash flow
-15.1%
Cash-on-Cash Return
2.8%
Cap rate
0.8%
Rent to Value Ratio