Chicago, IL Investment Properties for Sale
Browse homes for sale and investment properties in Chicago, IL. Refine your search by price, property type, or more.
Best cash flowing properties in Chicago, IL
Active
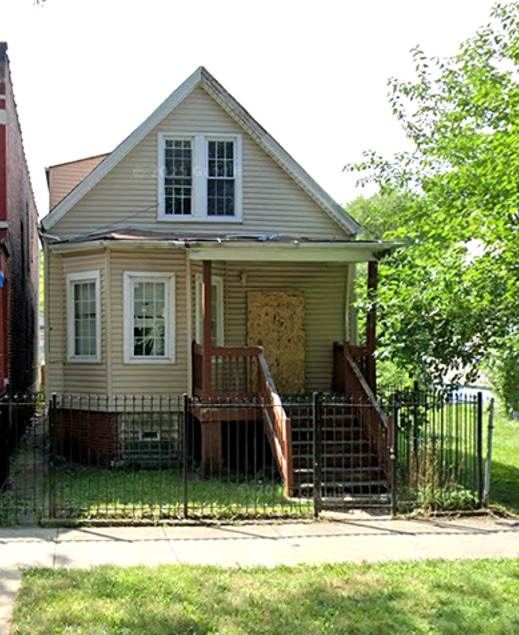
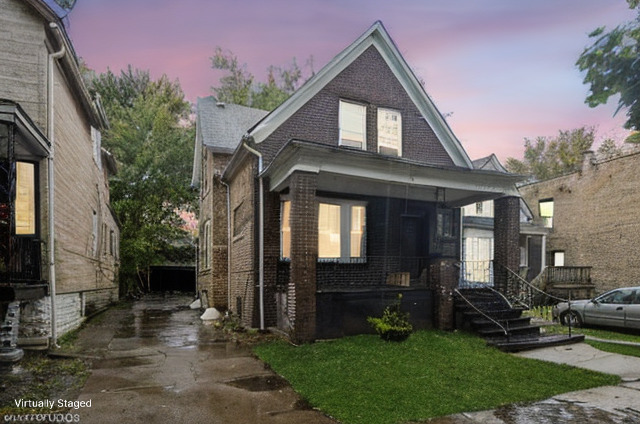
$65,000
4
bds
|
2
ba
|
1,700
sqft
|
built
1910
5922 S Paulina St, Chicago, IL 60636
$1,172
Cash flow
21.0%
Cash-on-Cash Return
21.6%
Cap rate
2.8%
Rent to Value Ratio
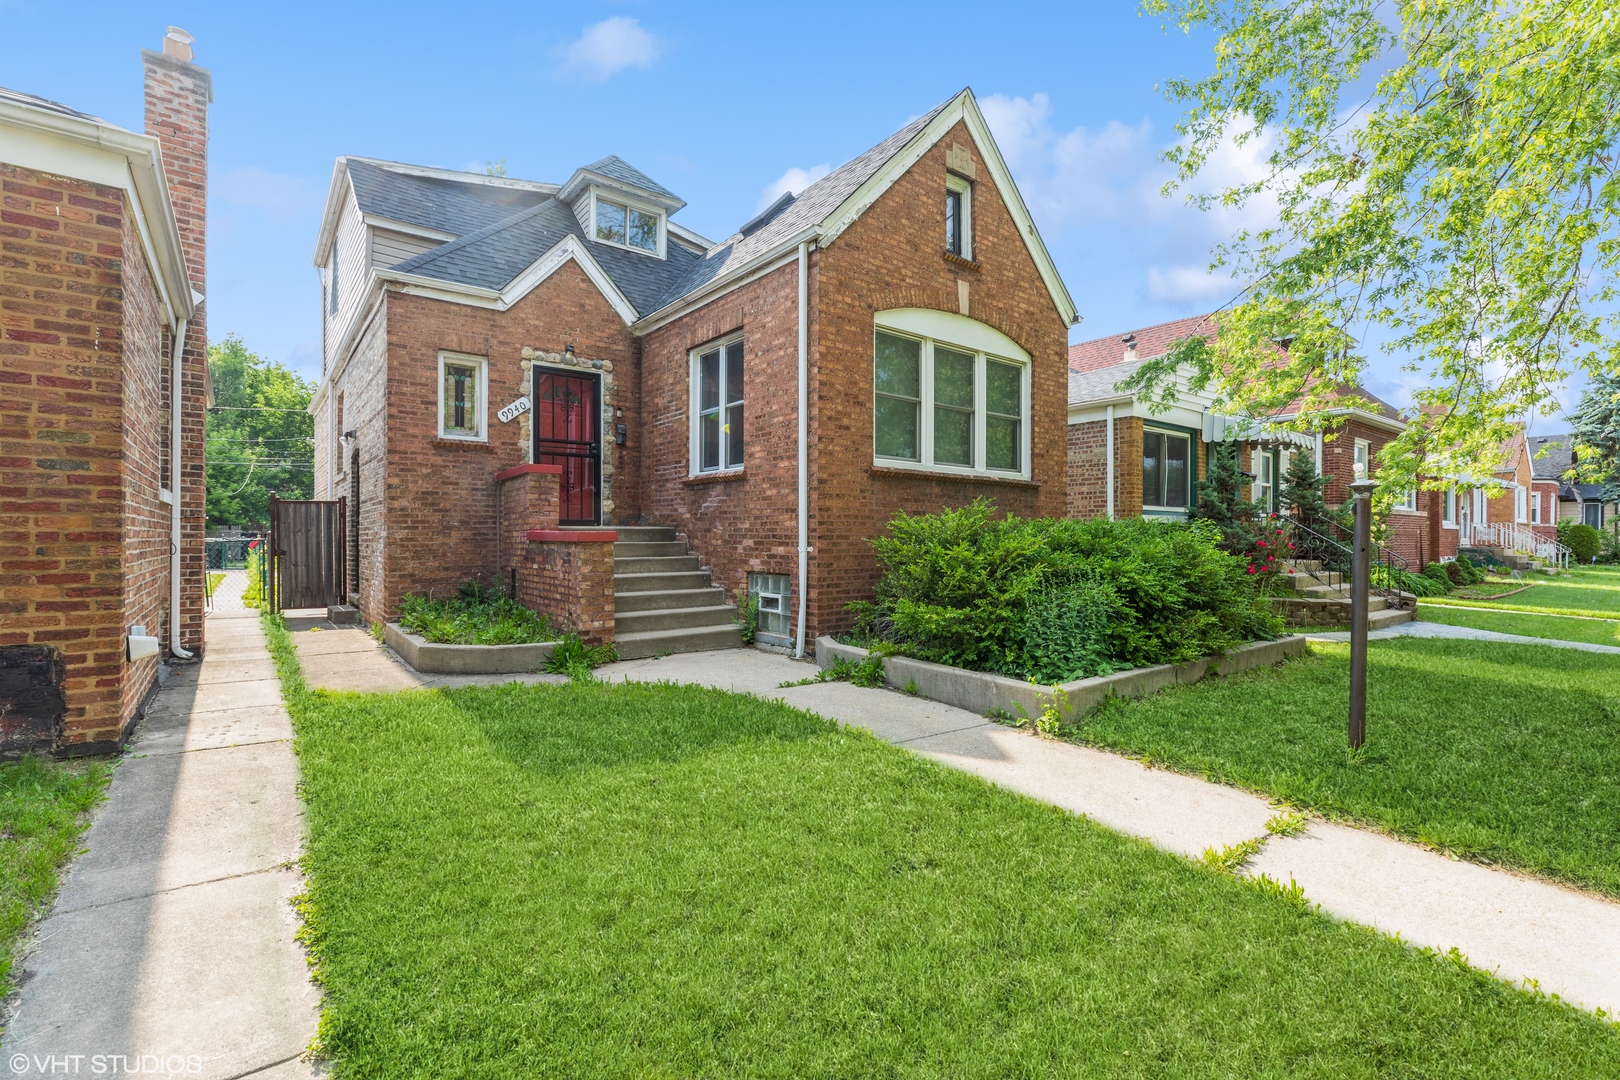
Active under contract
$190,000
3
bds
|
3
ba
|
1,635
sqft
|
built
1927
9940 S Normal Ave, Chicago, IL 60628
$691
Cash flow
19.0%
Cash-on-Cash Return
10.0%
Cap rate
1.3%
Rent to Value Ratio
3,734 out of 4,286 properties for sale in Chicago, IL
Limited Results Shown
Create a free account, or log in to reveal all property listings and enjoy the complete experience.
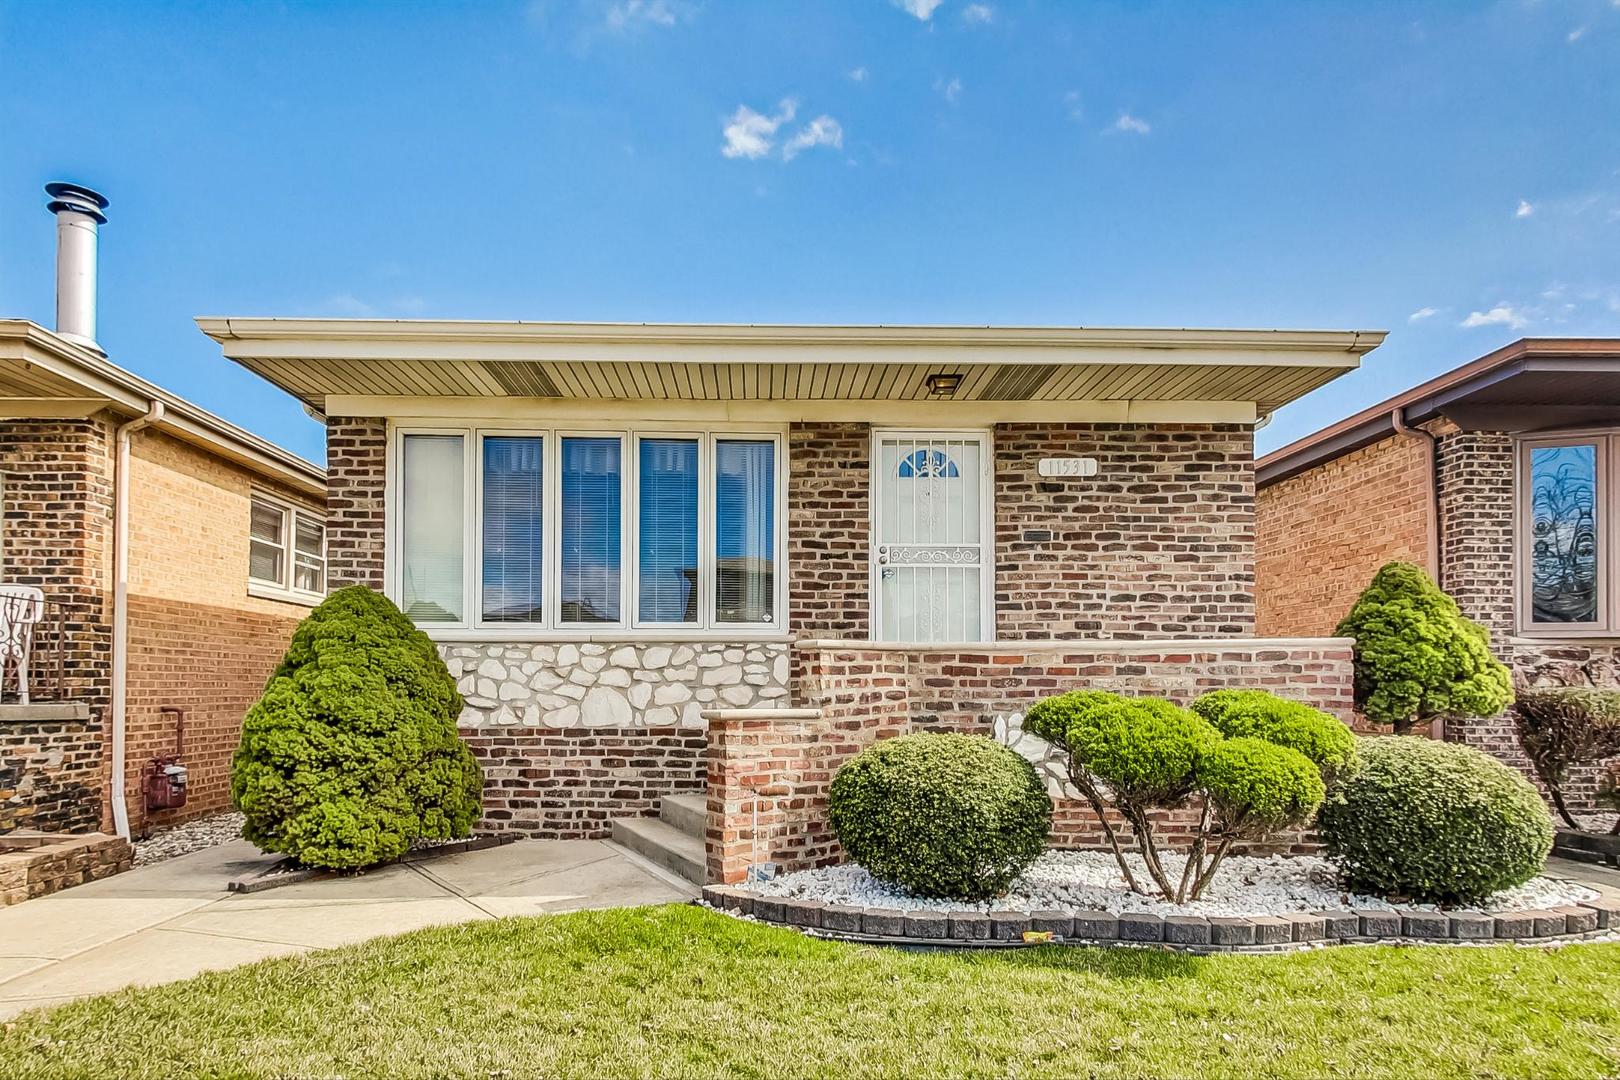
Active
$315,000
3
bds
|
2
ba
|
2,556
sqft
|
built
1976
11531 S Avenue J, Chicago, IL 60617
$-180
Cash flow
-3.0%
Cash-on-Cash Return
5.0%
Cap rate
0.7%
Rent to Value Ratio
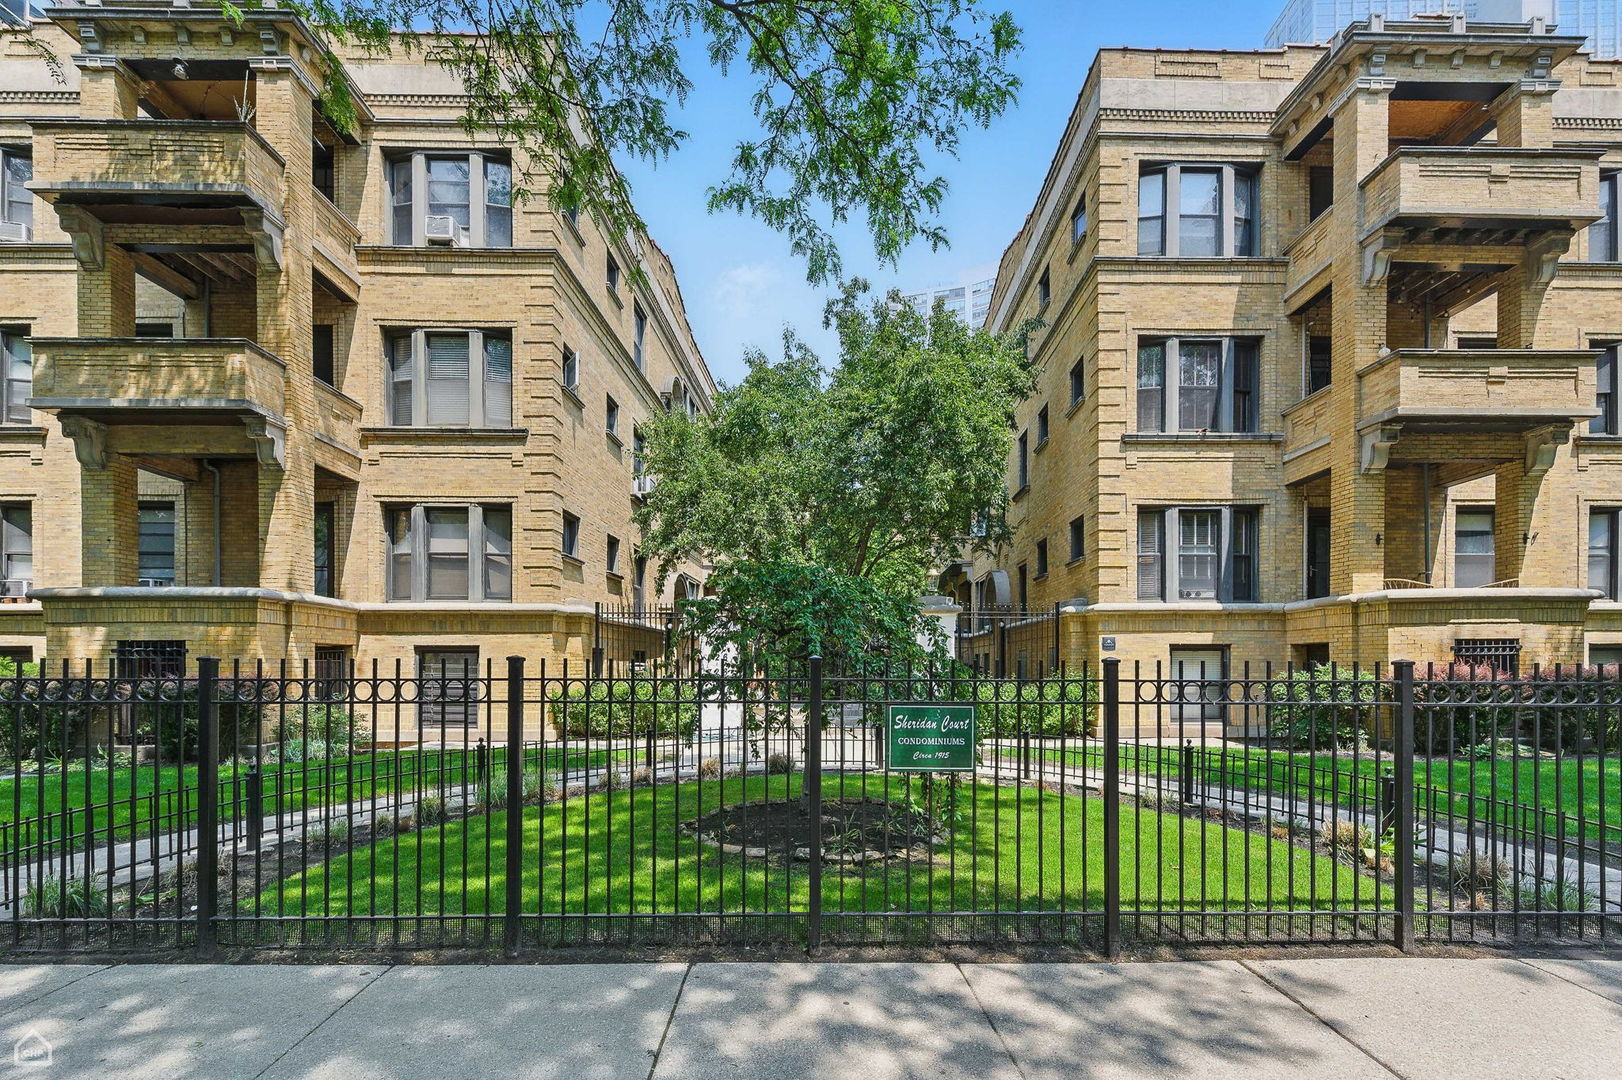
Active
$299,900
1
bds
|
1
ba
|
915
sqft
|
built
1920
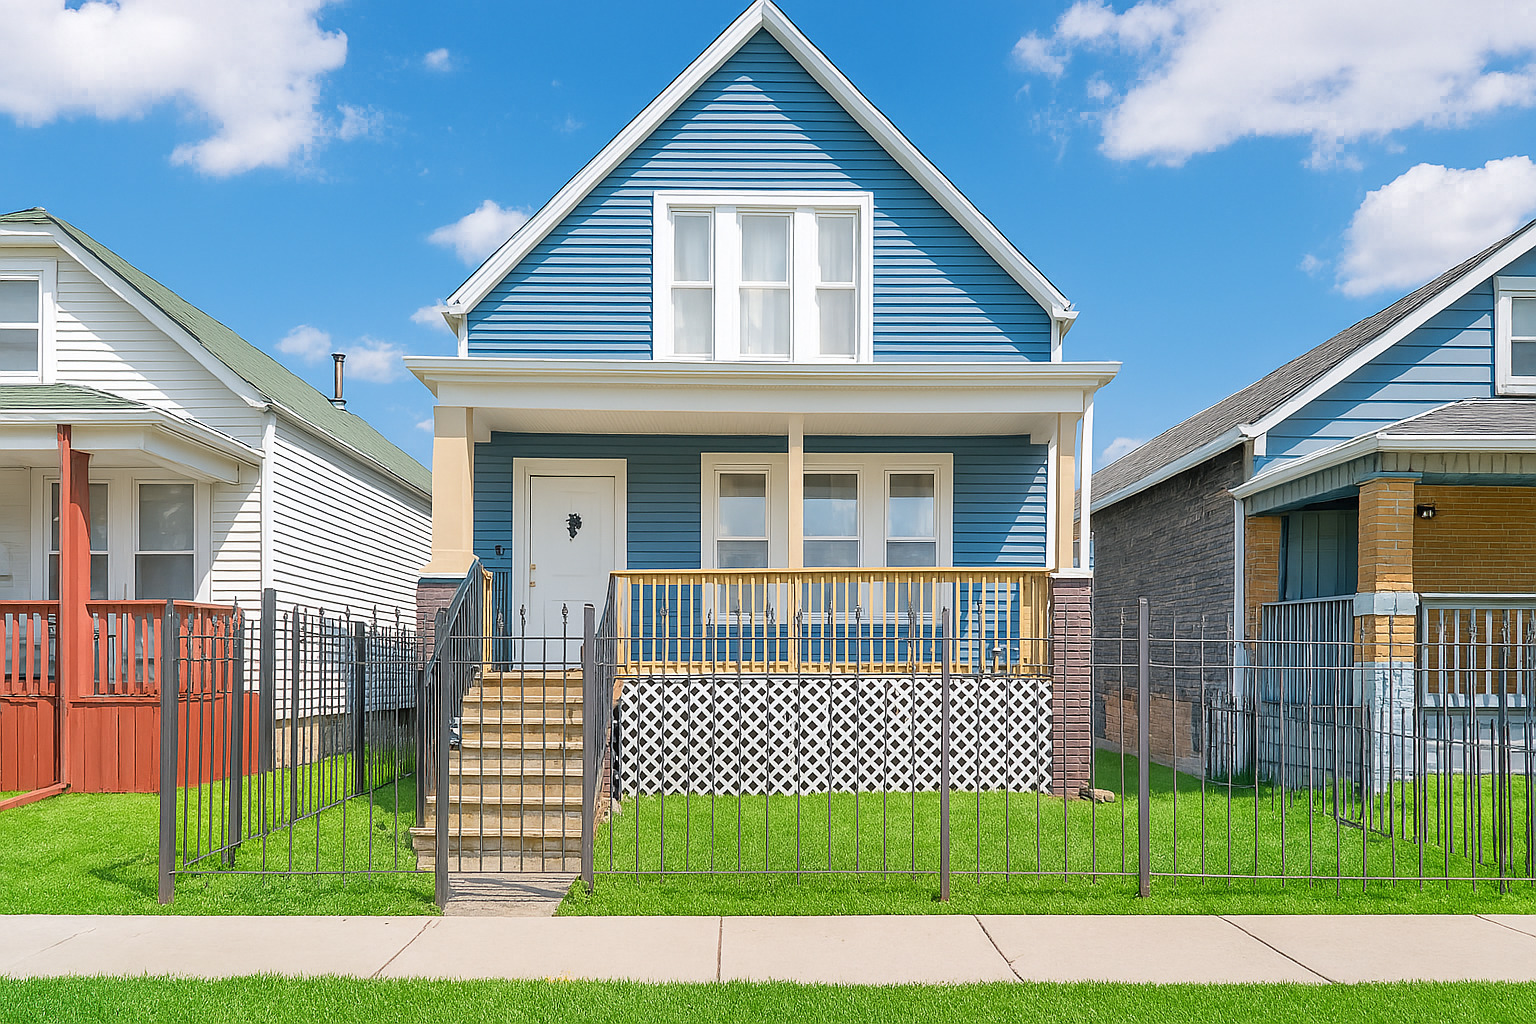
726 W Sheridan Rd, Chicago, IL 60613
$-701
Cash flow
-12.2%
Cash-on-Cash Return
2.9%
Cap rate
0.8%
Rent to Value Ratio
Active
$719,000
9
bds
|
6
ba
|
0
sqft
|
built
2008
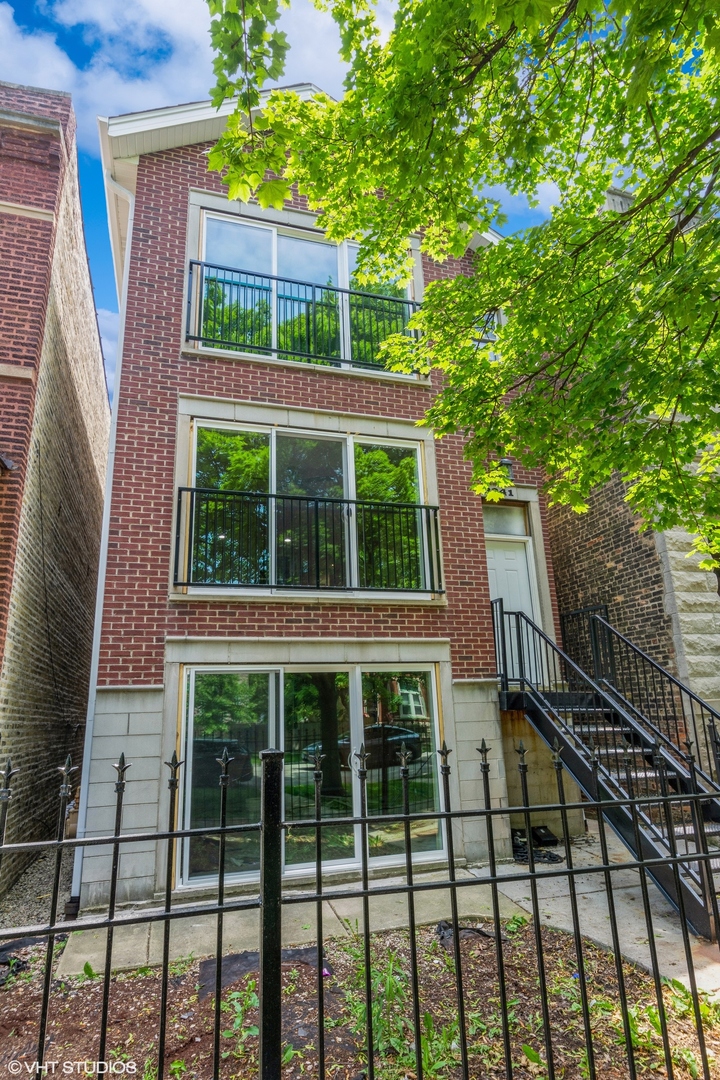
3341 W Fulton Blvd, Chicago, IL 60624
$-2,292
Cash flow
-16.6%
Cash-on-Cash Return
1.9%
Cap rate
0.3%
Rent to Value Ratio
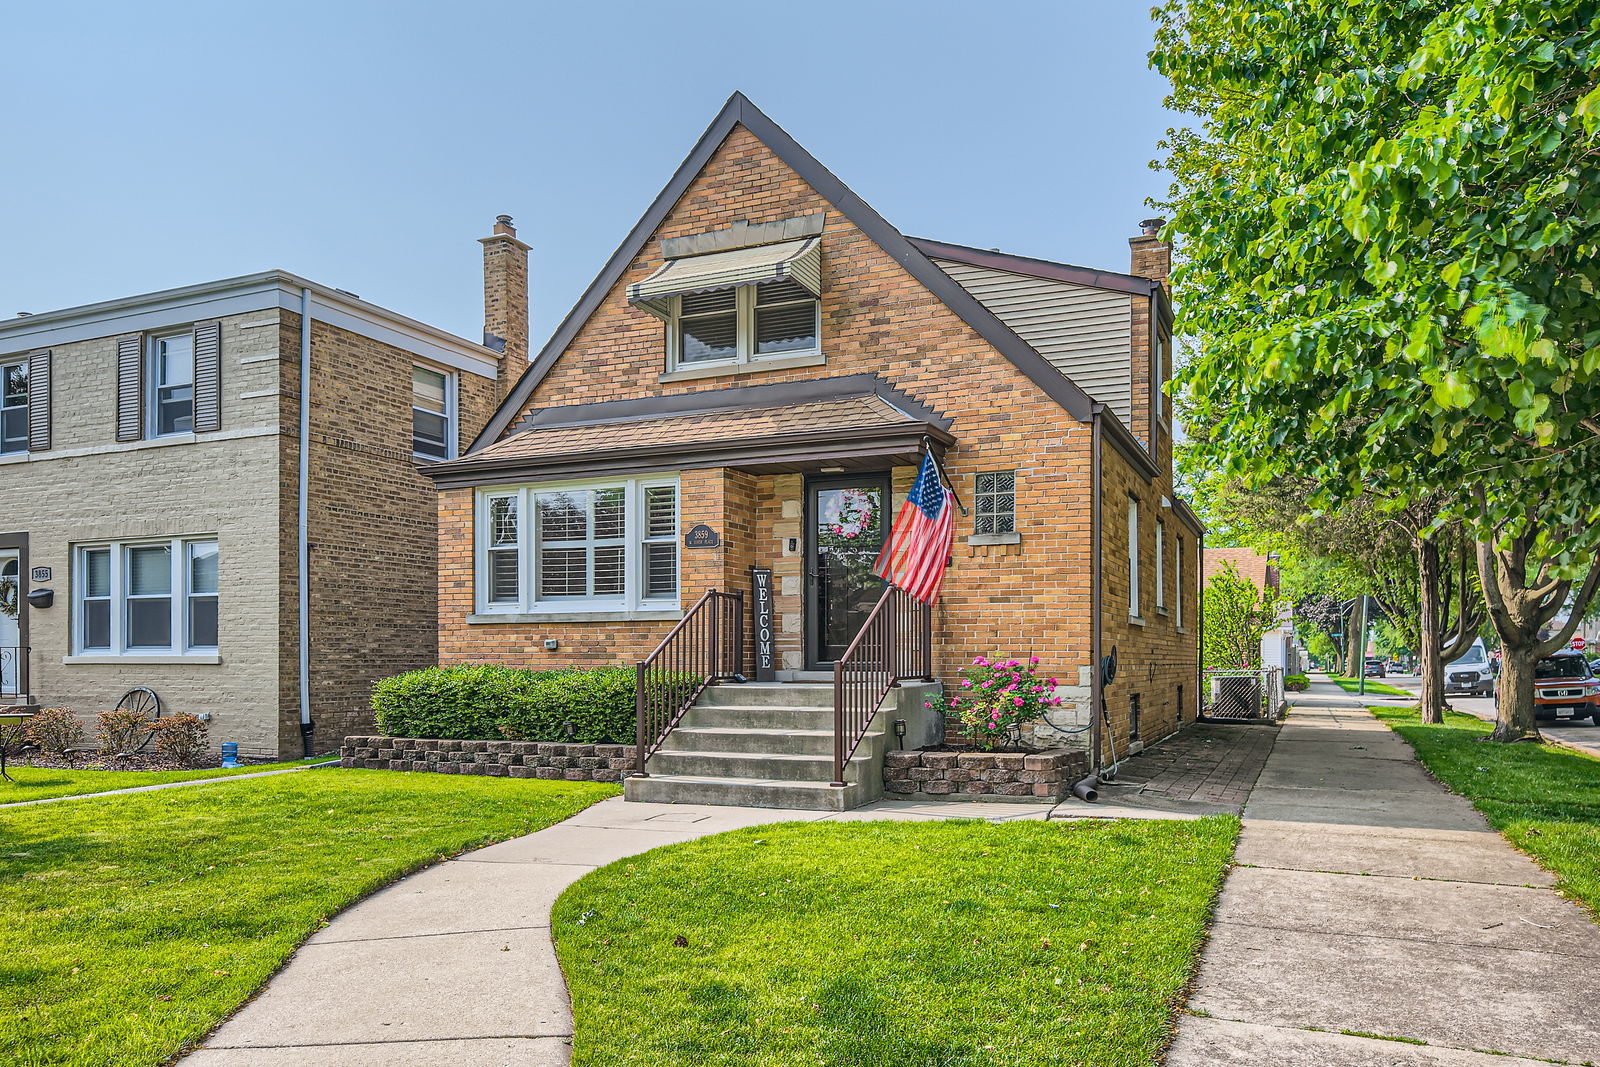
Active under contract
$389,900
4
bds
|
2
ba
|
1,411
sqft
|
built
1953
3859 W 109th Pl, Chicago, IL 60655
$-190
Cash flow
-2.5%
Cash-on-Cash Return
5.1%
Cap rate
0.7%
Rent to Value Ratio
Active under contract
$475,000
2
bds
|
2
ba
|
0
sqft
|
built
1902
120 E Cullerton St, Chicago, IL 60616
$-1,317
Cash flow
-14.5%
Cash-on-Cash Return
2.4%
Cap rate
0.7%
Rent to Value Ratio
Active
$65,000
4
bds
|
2
ba
|
1,700
sqft
|
built
1910
5922 S Paulina St, Chicago, IL 60636
$1,172
Cash flow
21.0%
Cash-on-Cash Return
21.6%
Cap rate
2.8%
Rent to Value Ratio
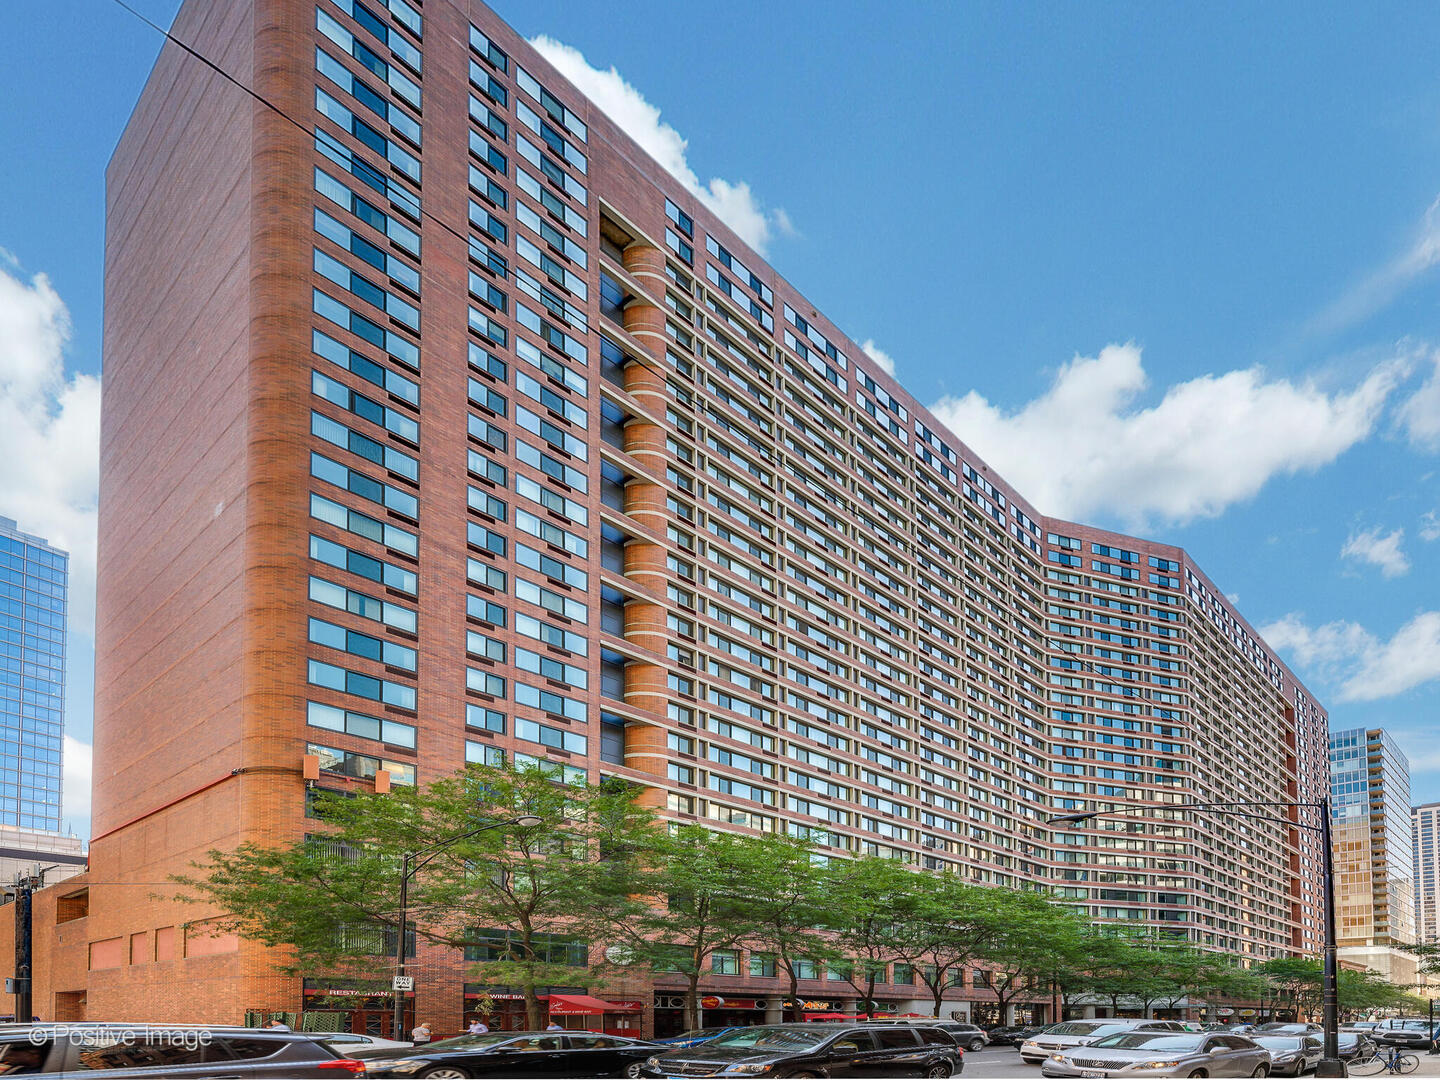
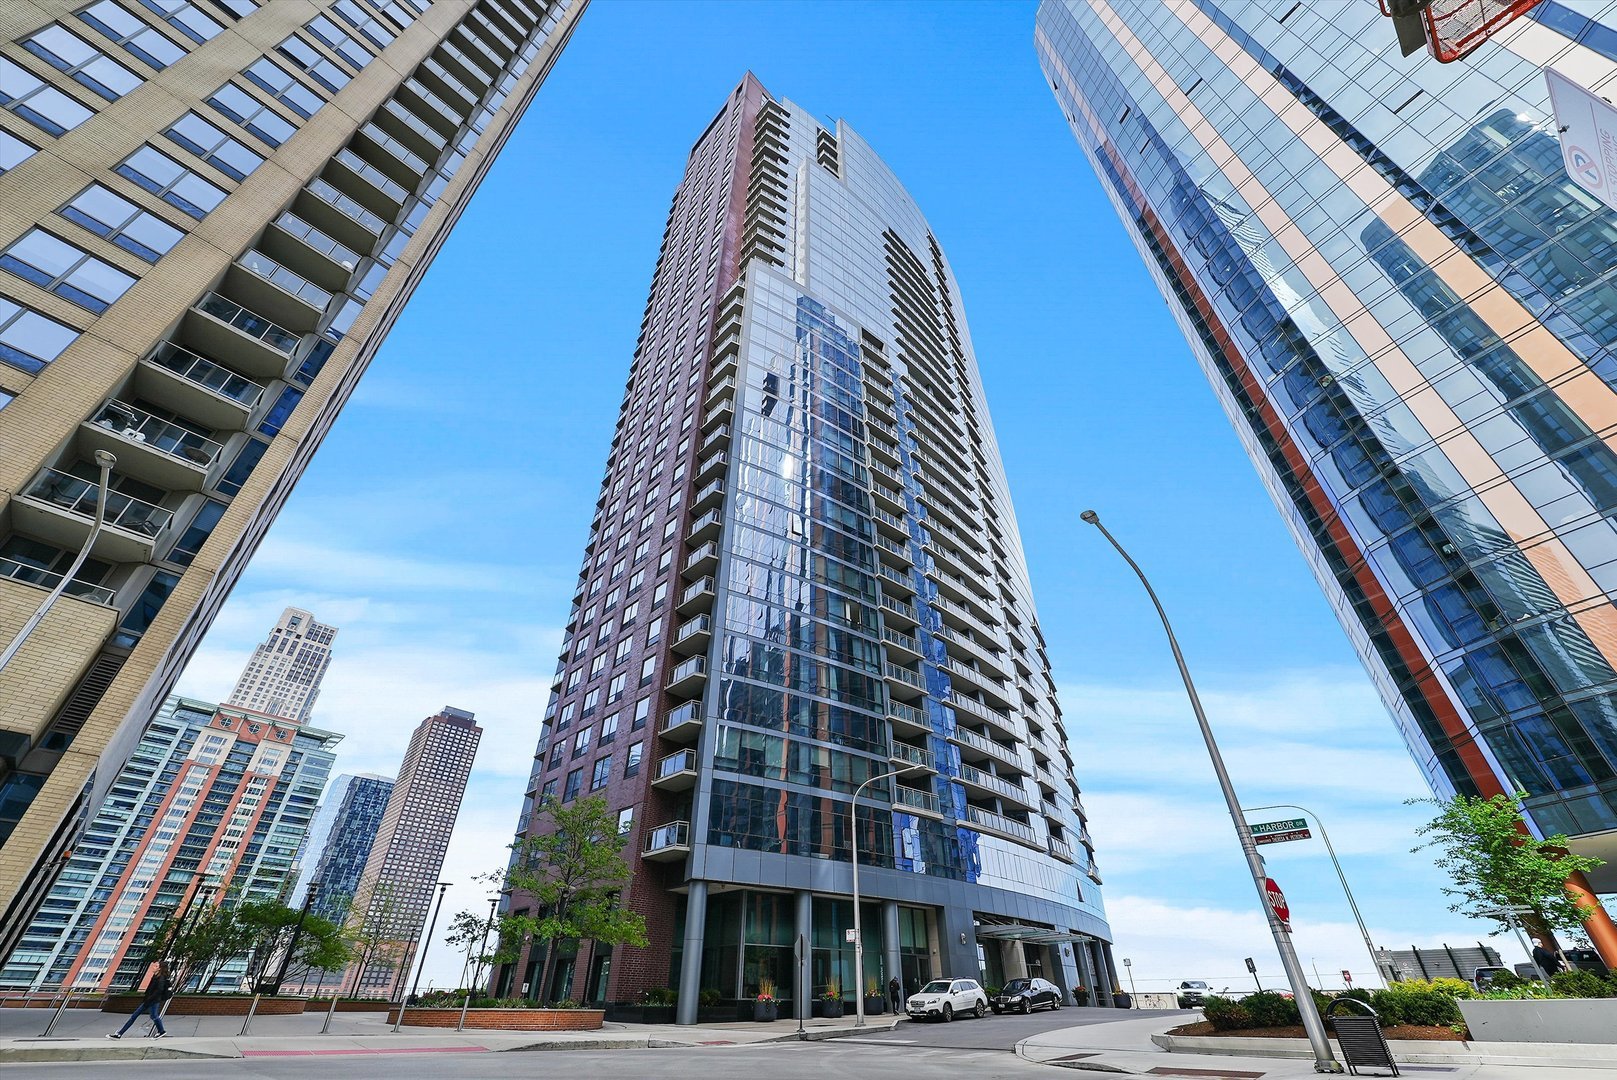
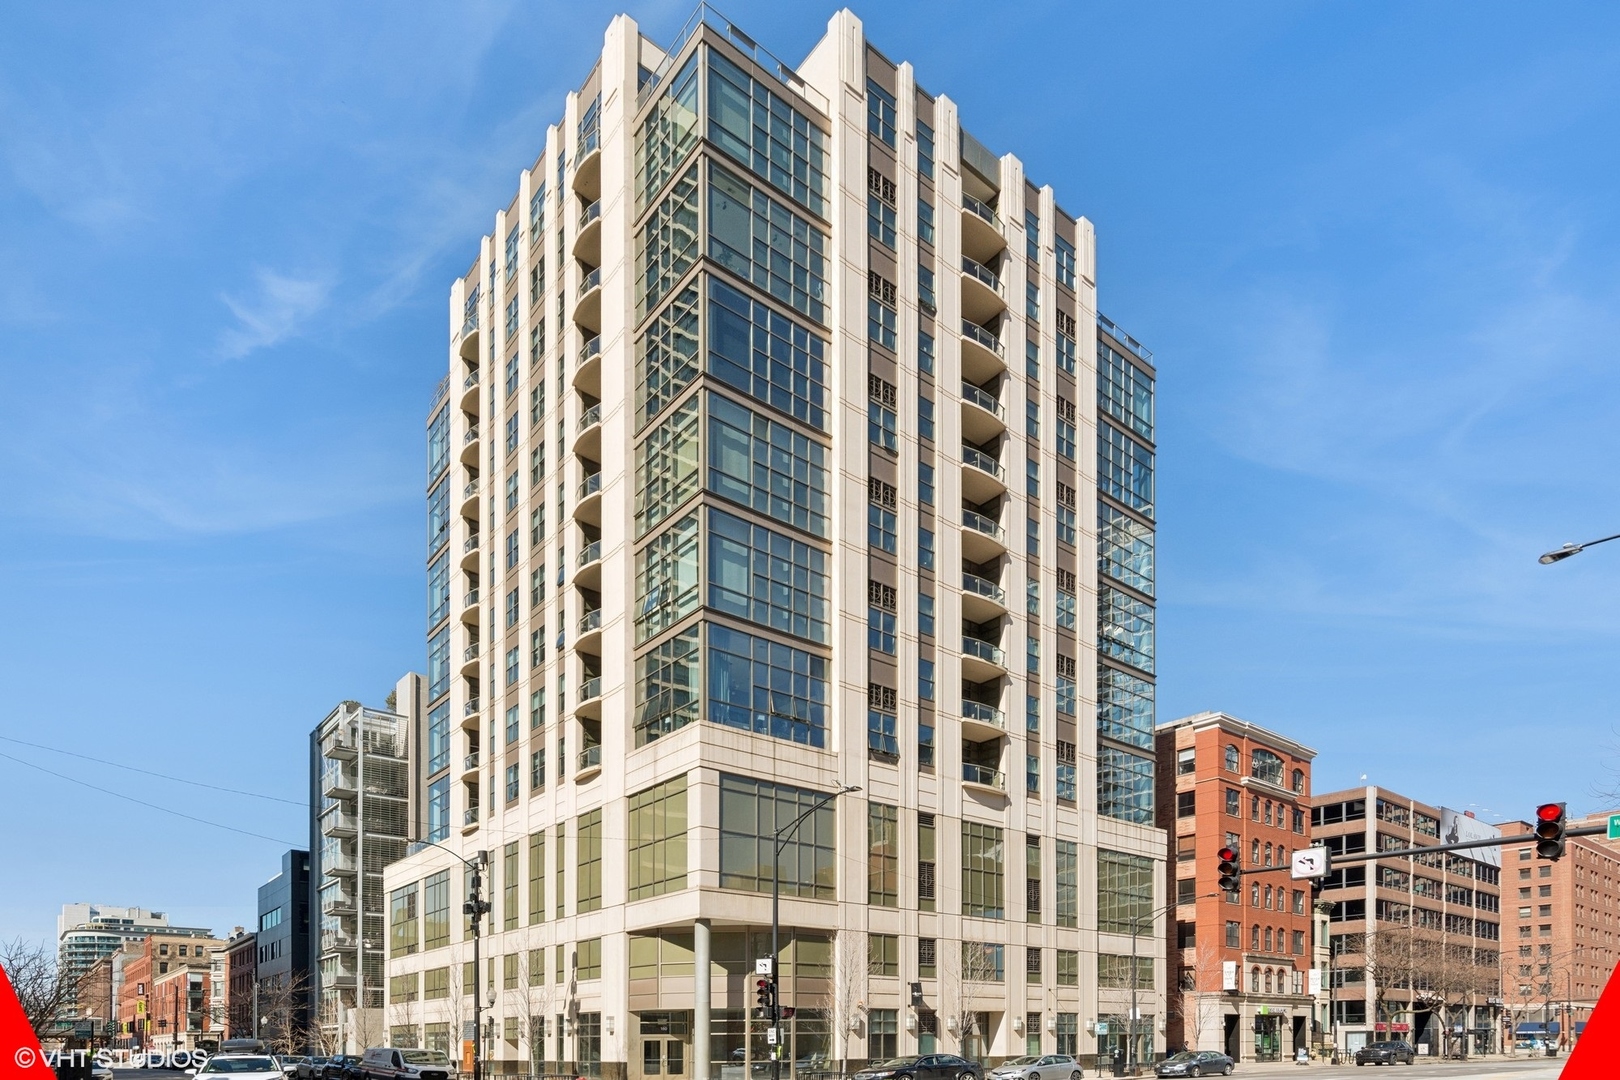
Active
$500,000
4
bds
|
2
ba
|
1,700
sqft
|
built
1984
211 E Ohio St, Chicago, IL 60611
$-2,368
Cash flow
-24.7%
Cash-on-Cash Return
0.0%
Cap rate
0.8%
Rent to Value Ratio
Active
$399,900
5
bds
|
3
ba
|
3,078
sqft
|
built
1920
6421 S Mozart St, Chicago, IL 60629
$-967
Cash flow
-12.6%
Cash-on-Cash Return
2.8%
Cap rate
0.4%
Rent to Value Ratio
Active under contract
$190,000
3
bds
|
3
ba
|
1,635
sqft
|
built
1927
9940 S Normal Ave, Chicago, IL 60628
$691
Cash flow
19.0%
Cash-on-Cash Return
10.0%
Cap rate
1.3%
Rent to Value Ratio
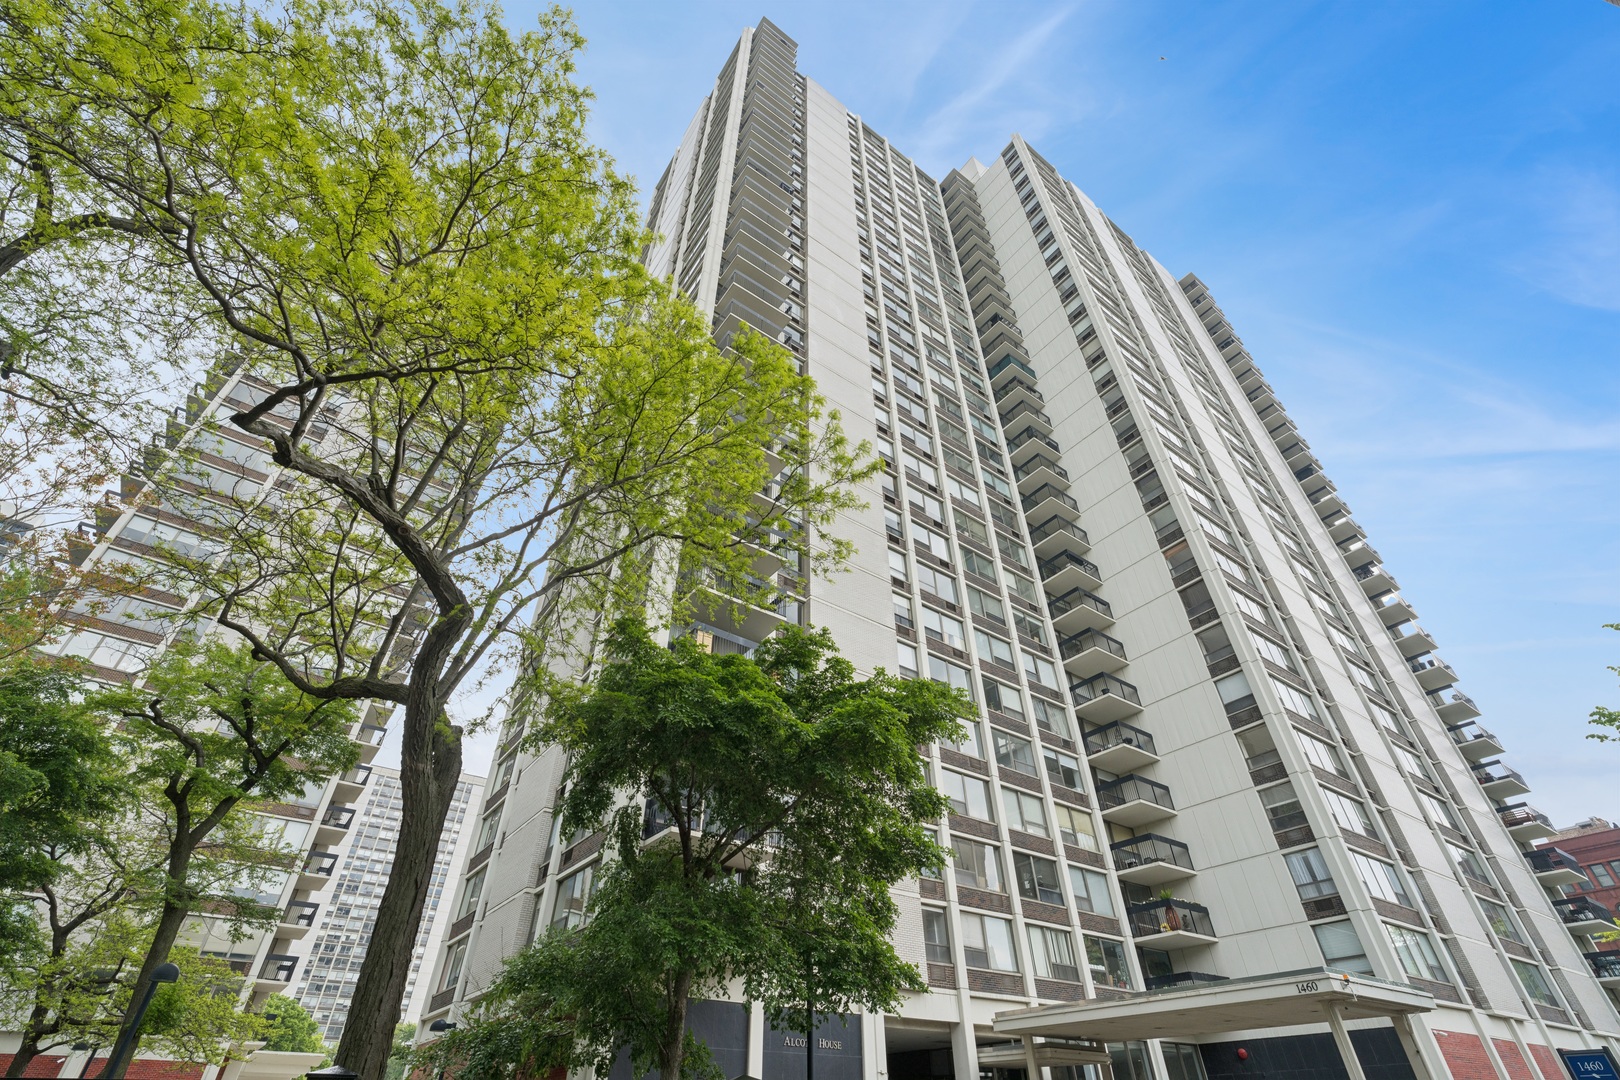
Active
$239,000
1
bds
|
1
ba
|
783
sqft
|
built
1964
1460 N Clark St, Chicago, IL 60610
$-511
Cash flow
-11.2%
Cash-on-Cash Return
3.1%
Cap rate
1.0%
Rent to Value Ratio
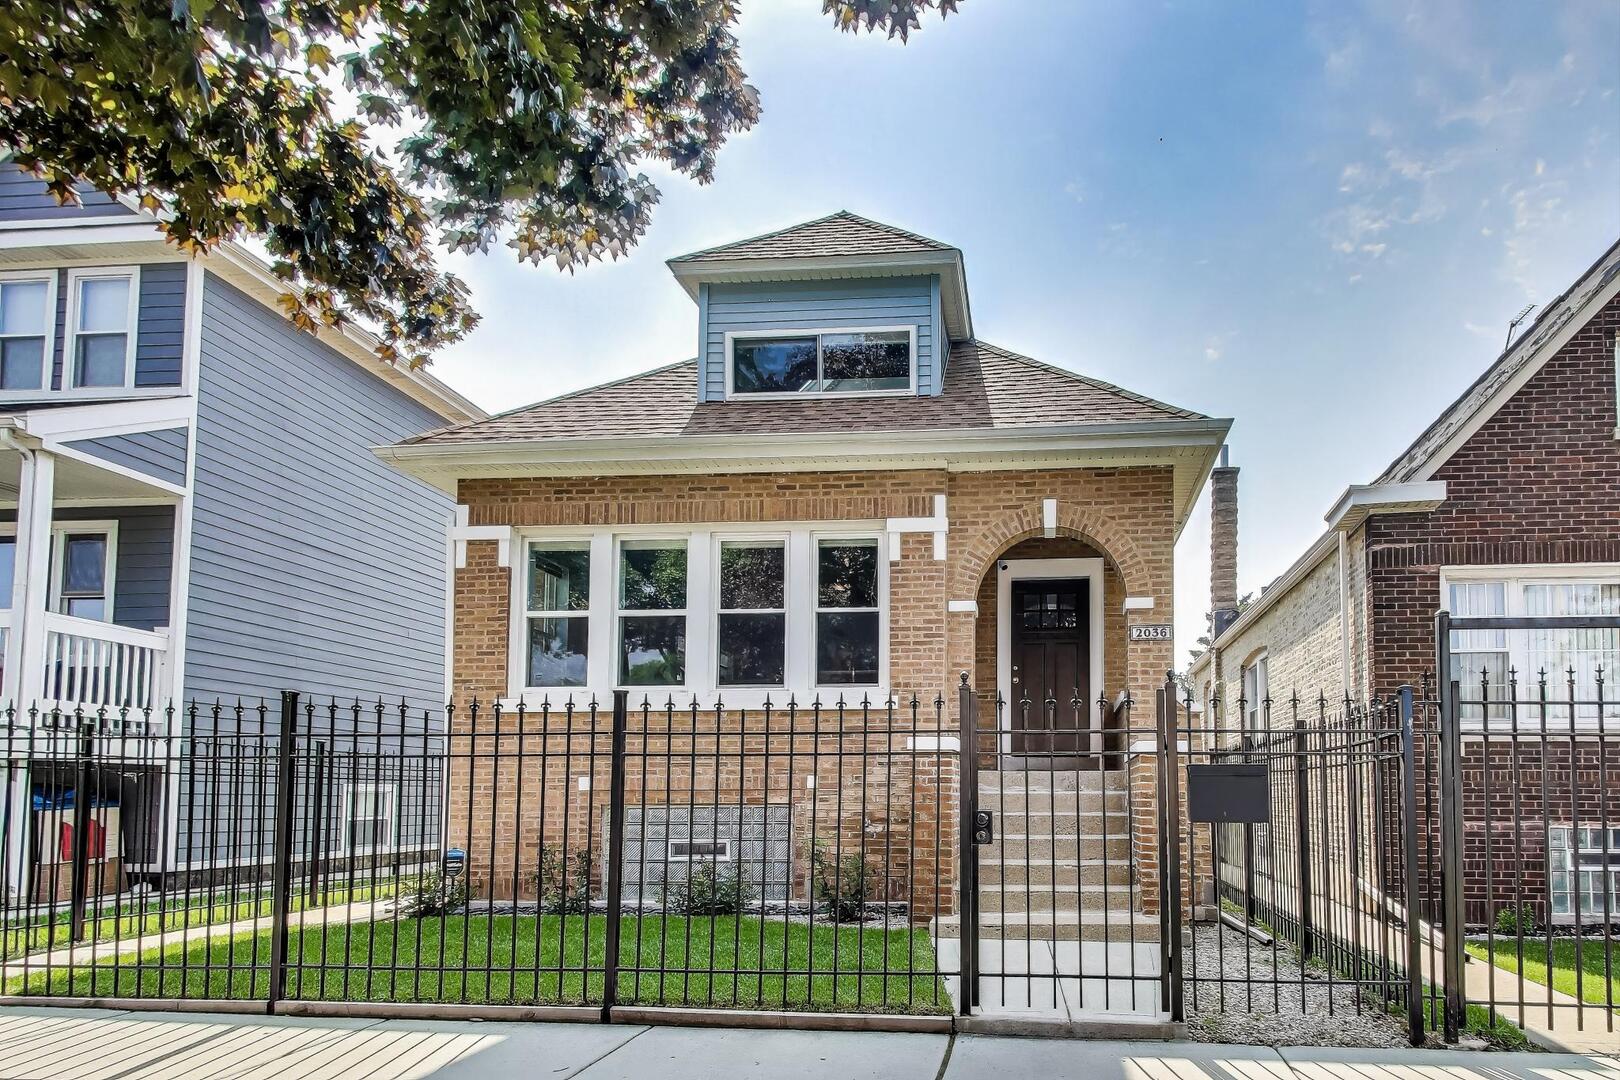
Active
$535,000
3
bds
|
3
ba
|
3,358
sqft
|
built
1922
2036 N Kilpatrick Ave, Chicago, IL 60639
$-694
Cash flow
-6.8%
Cash-on-Cash Return
4.1%
Cap rate
0.6%
Rent to Value Ratio
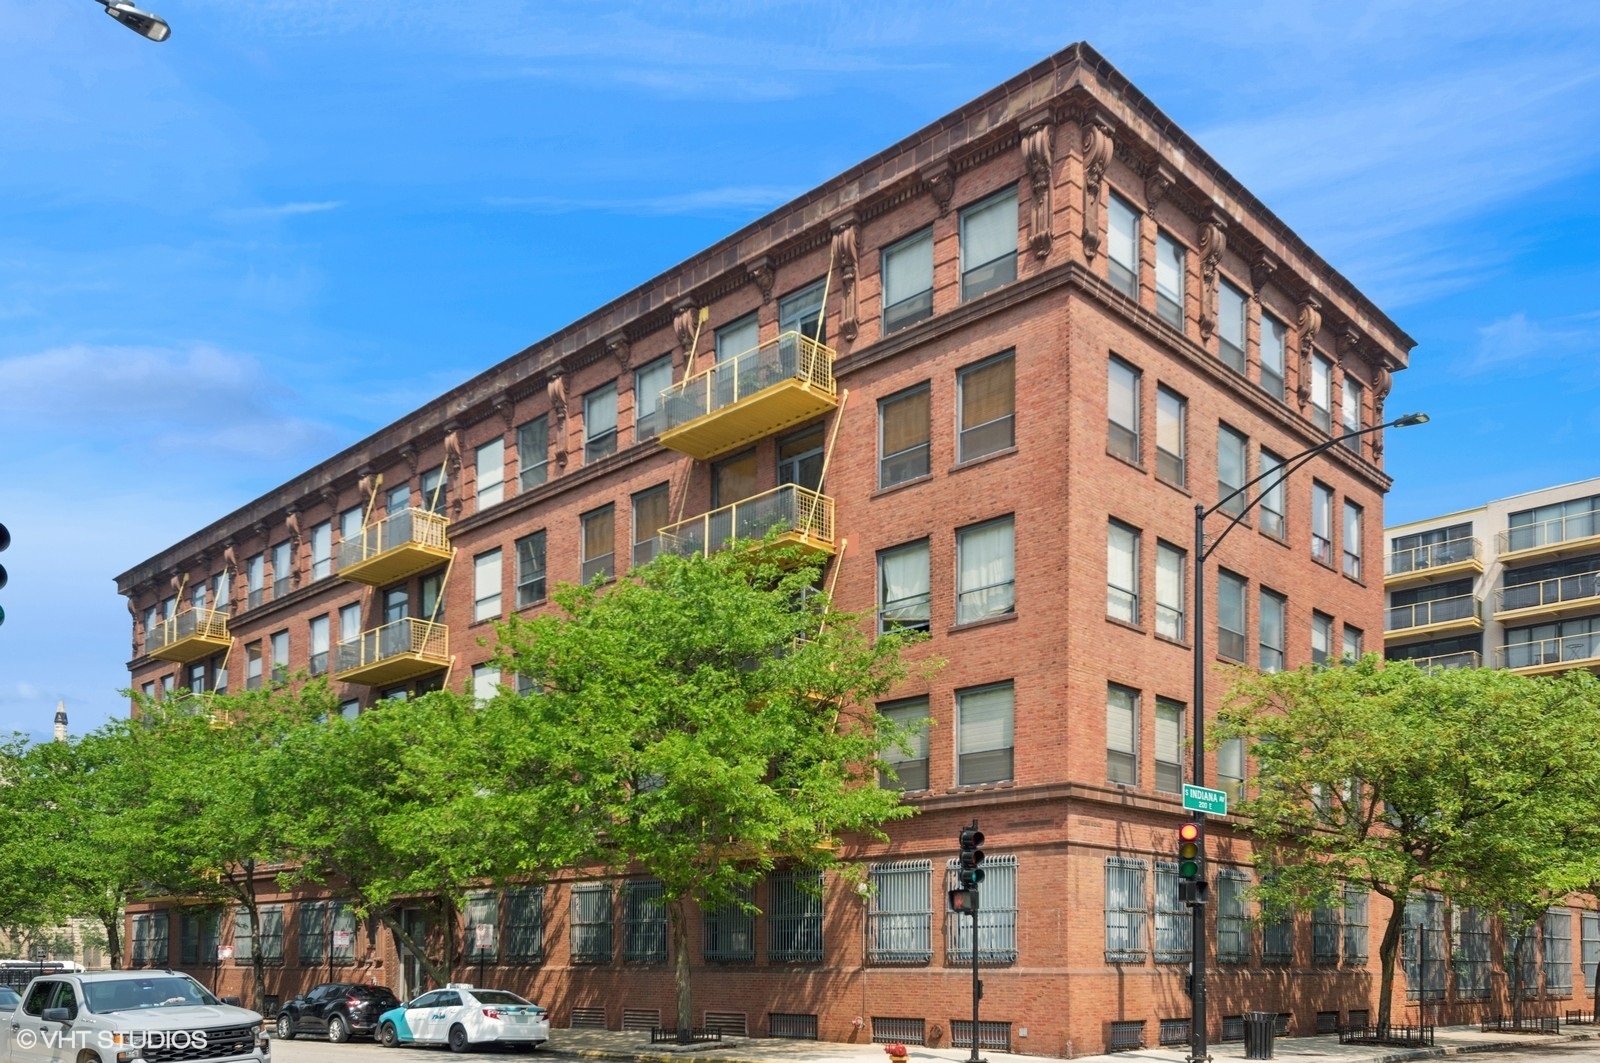
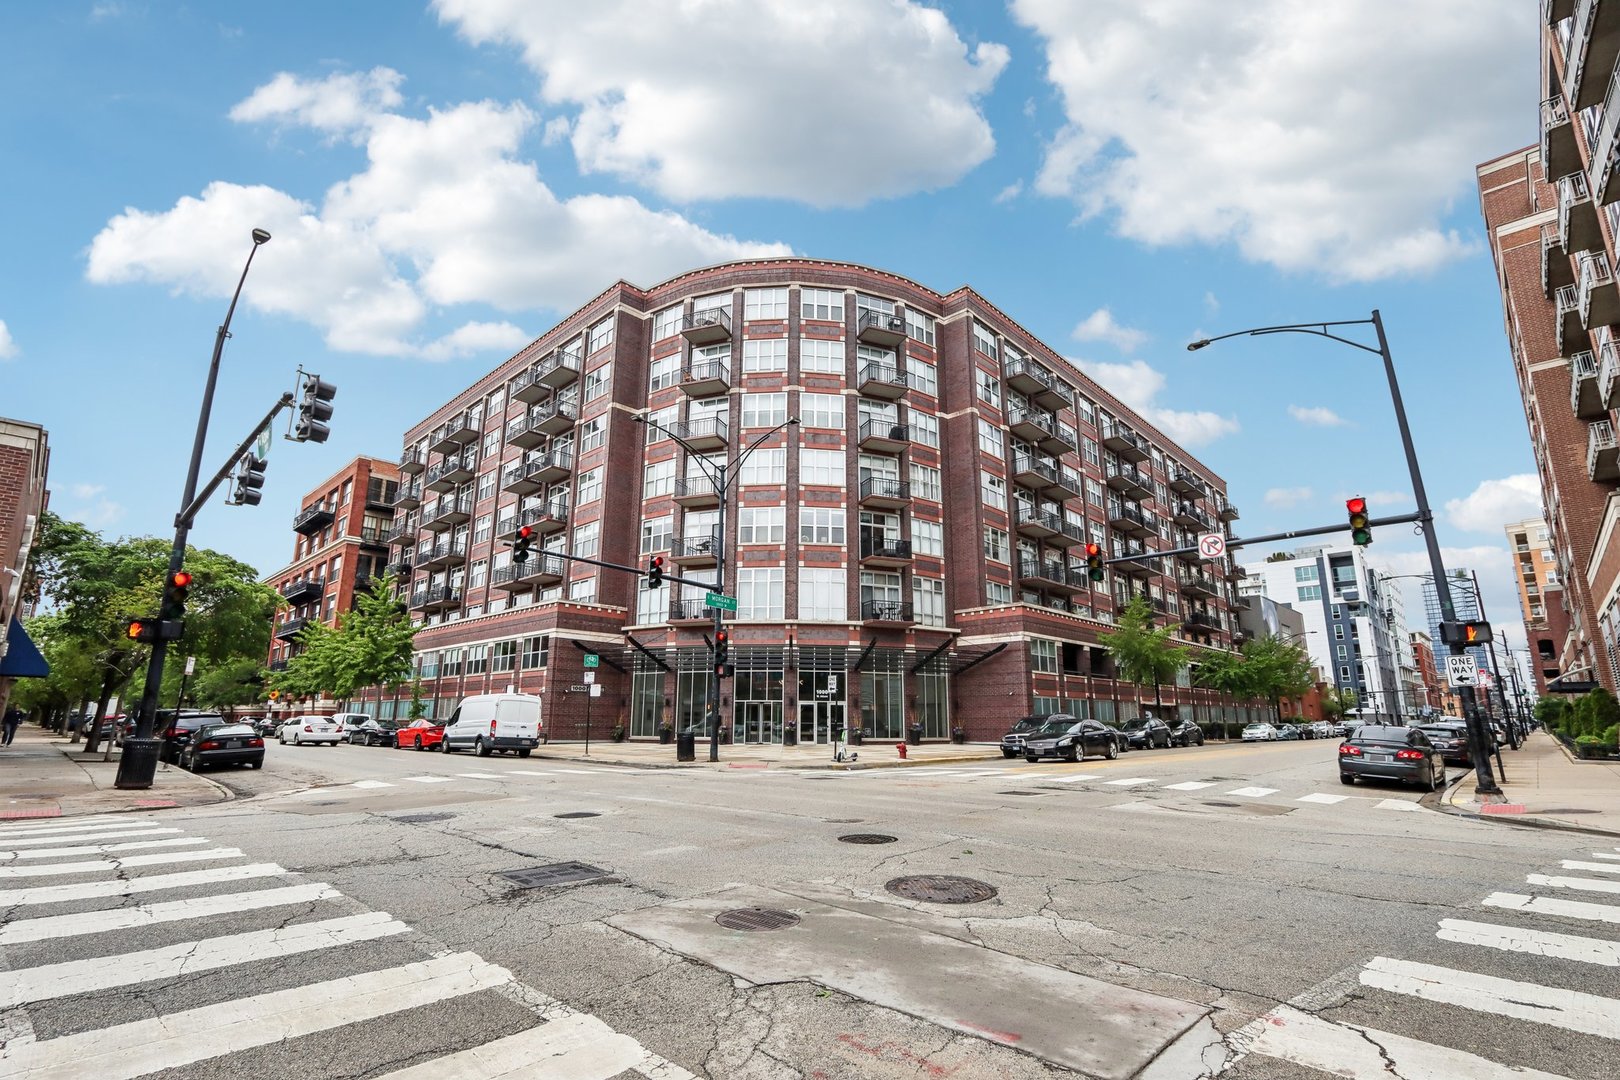
Active
$399,000
2
bds
|
2
ba
|
1,183
sqft
|
built
2006
1600 S Indiana Ave, Chicago, IL 60616
$-1,244
Cash flow
-16.3%
Cash-on-Cash Return
1.9%
Cap rate
0.7%
Rent to Value Ratio
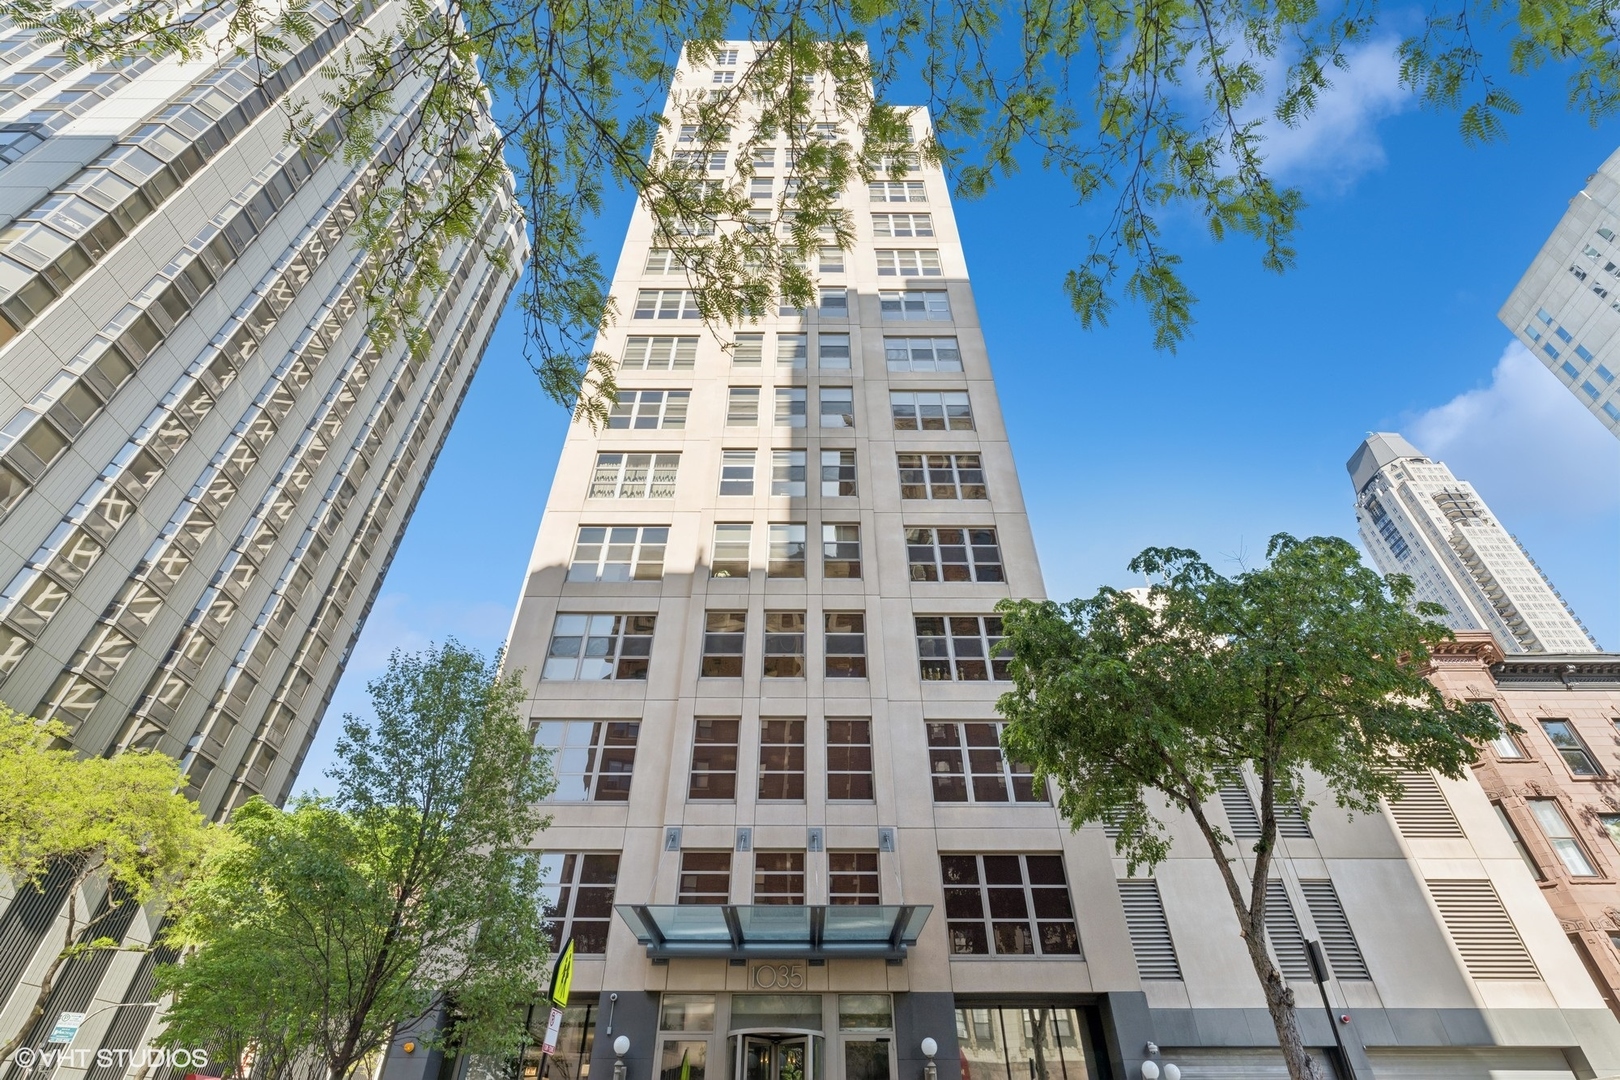
Active
$1,349,000
3
bds
|
3
ba
|
2,500
sqft
|
built
2005
1035 N Dearborn St, Chicago, IL 60610
$-8,720
Cash flow
-33.7%
Cash-on-Cash Return
-2.1%
Cap rate
0.2%
Rent to Value Ratio
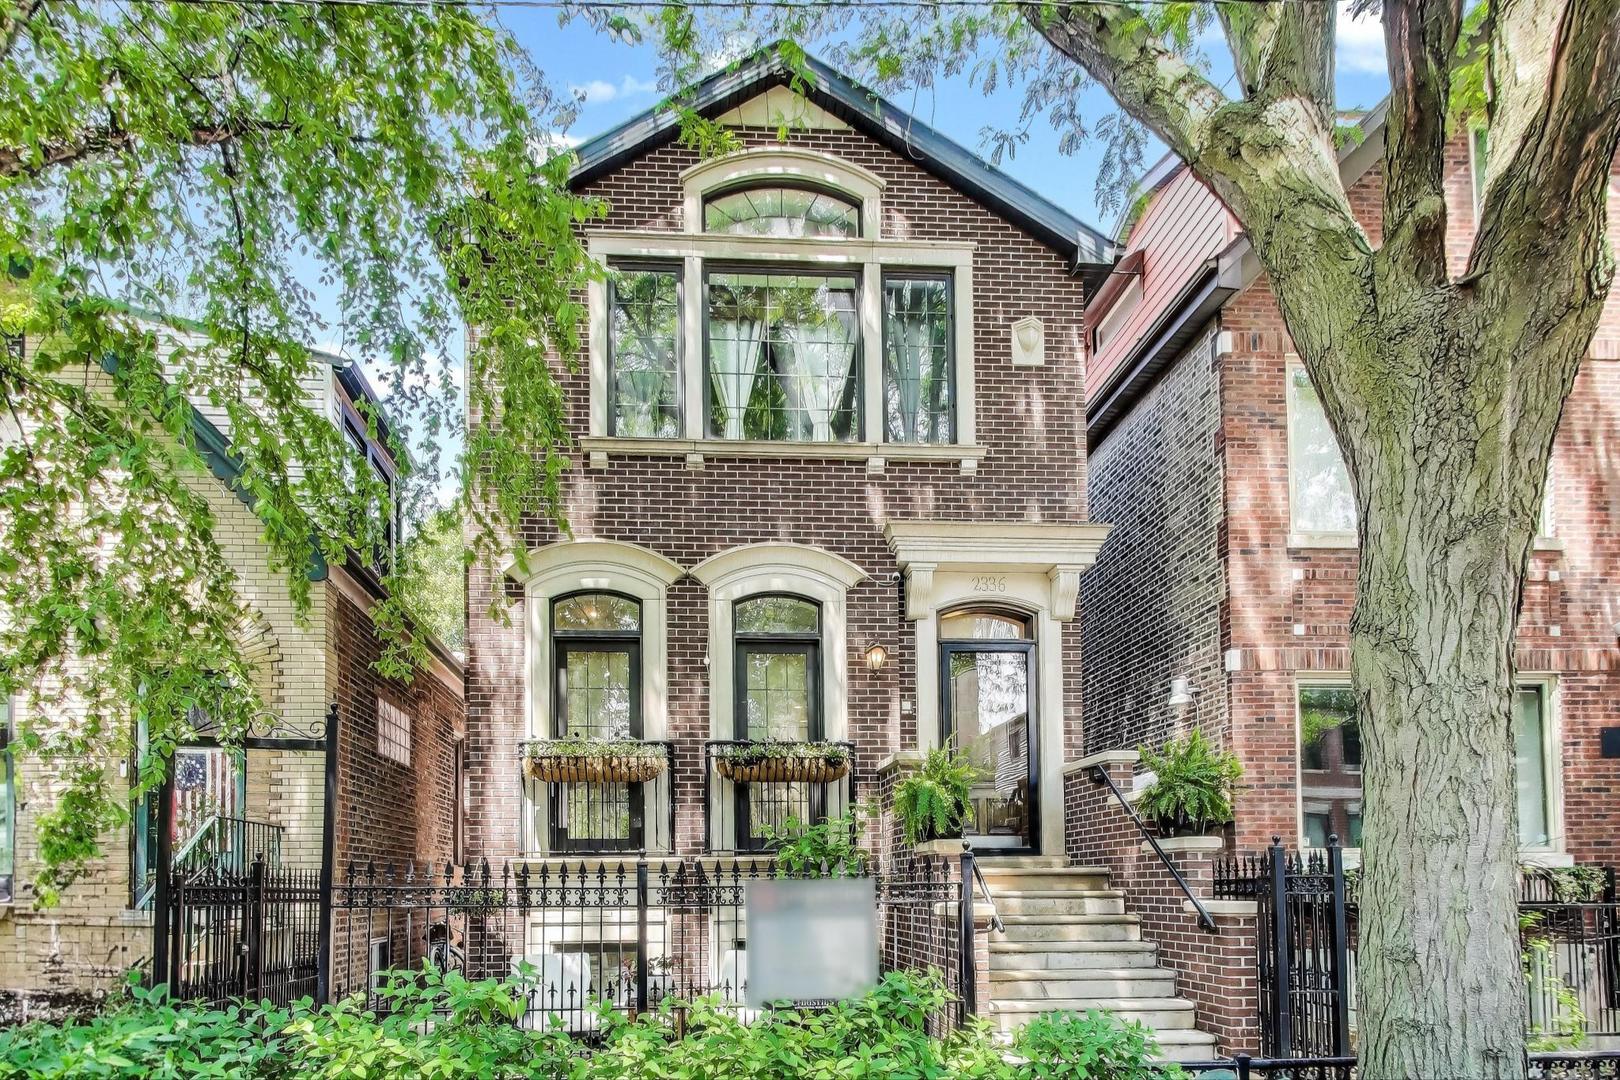
Active under contract
$1,450,000
3
bds
|
4
ba
|
3,900
sqft
|
built
2007
2336 W Medill Ave, Chicago, IL 60647
$-4,003
Cash flow
-14.4%
Cash-on-Cash Return
2.4%
Cap rate
0.4%
Rent to Value Ratio
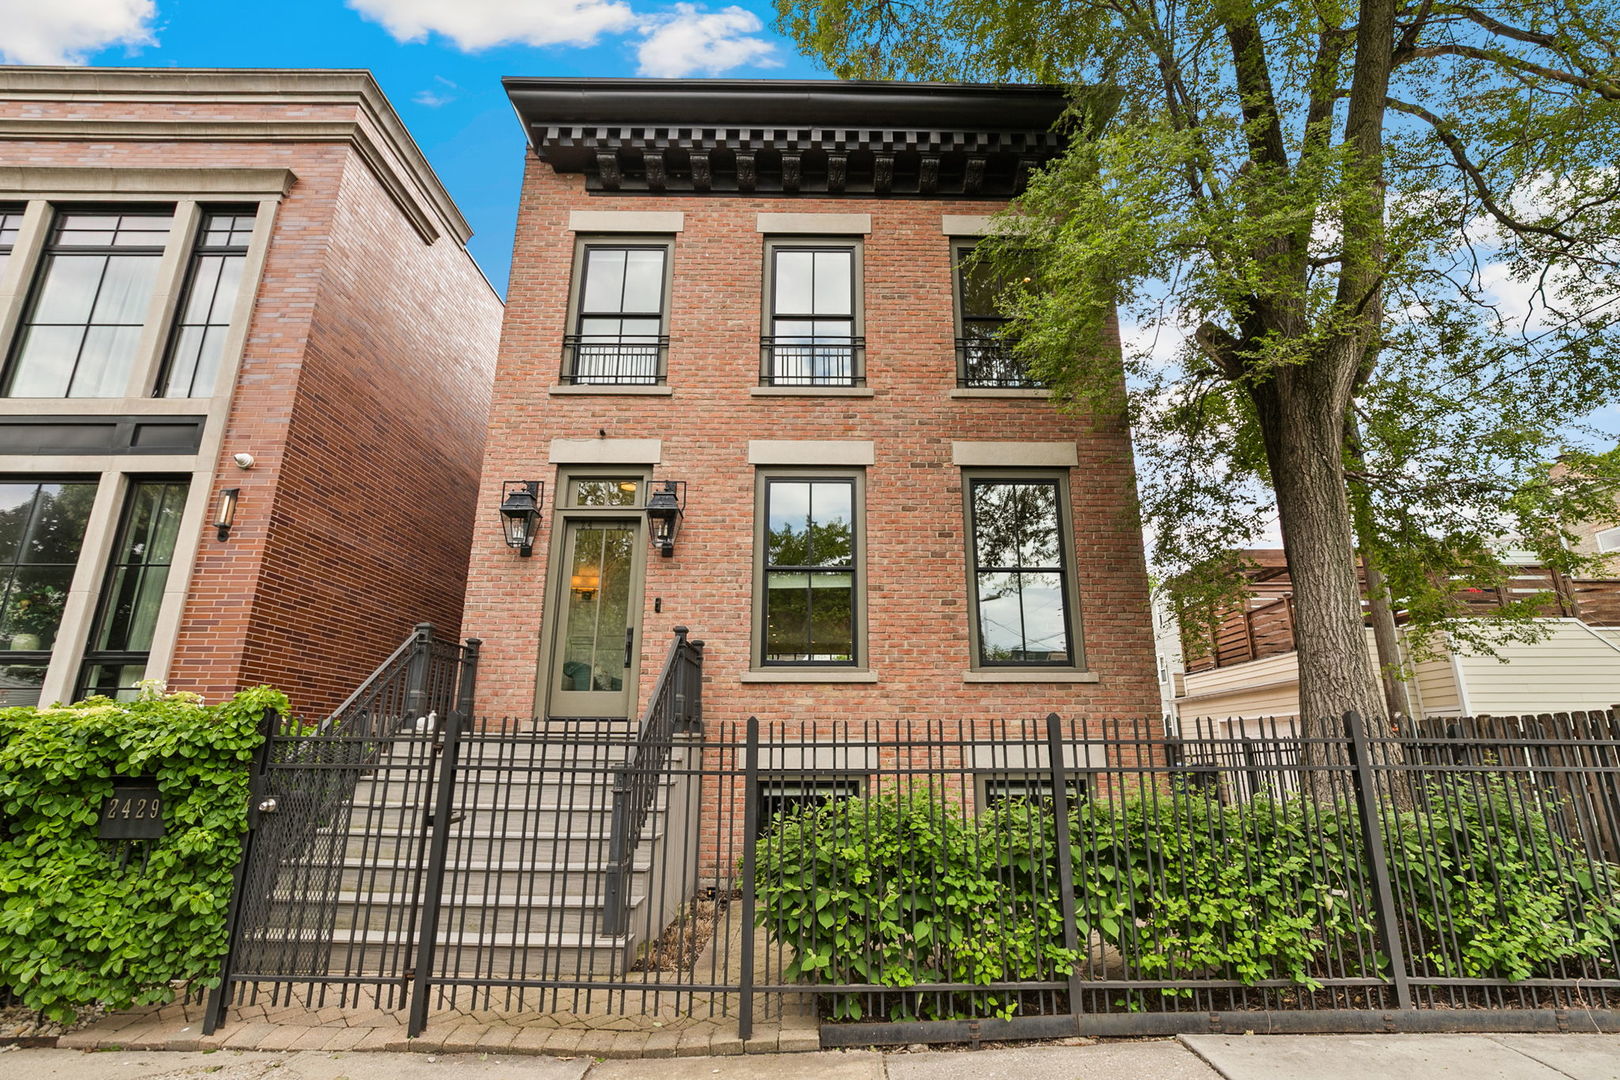
Active
$1,600,000
4
bds
|
4
ba
|
4,538
sqft
|
built
2012
2429 W Belden Ave, Chicago, IL 60647
$-4,203
Cash flow
-13.7%
Cash-on-Cash Return
2.5%
Cap rate
0.4%
Rent to Value Ratio
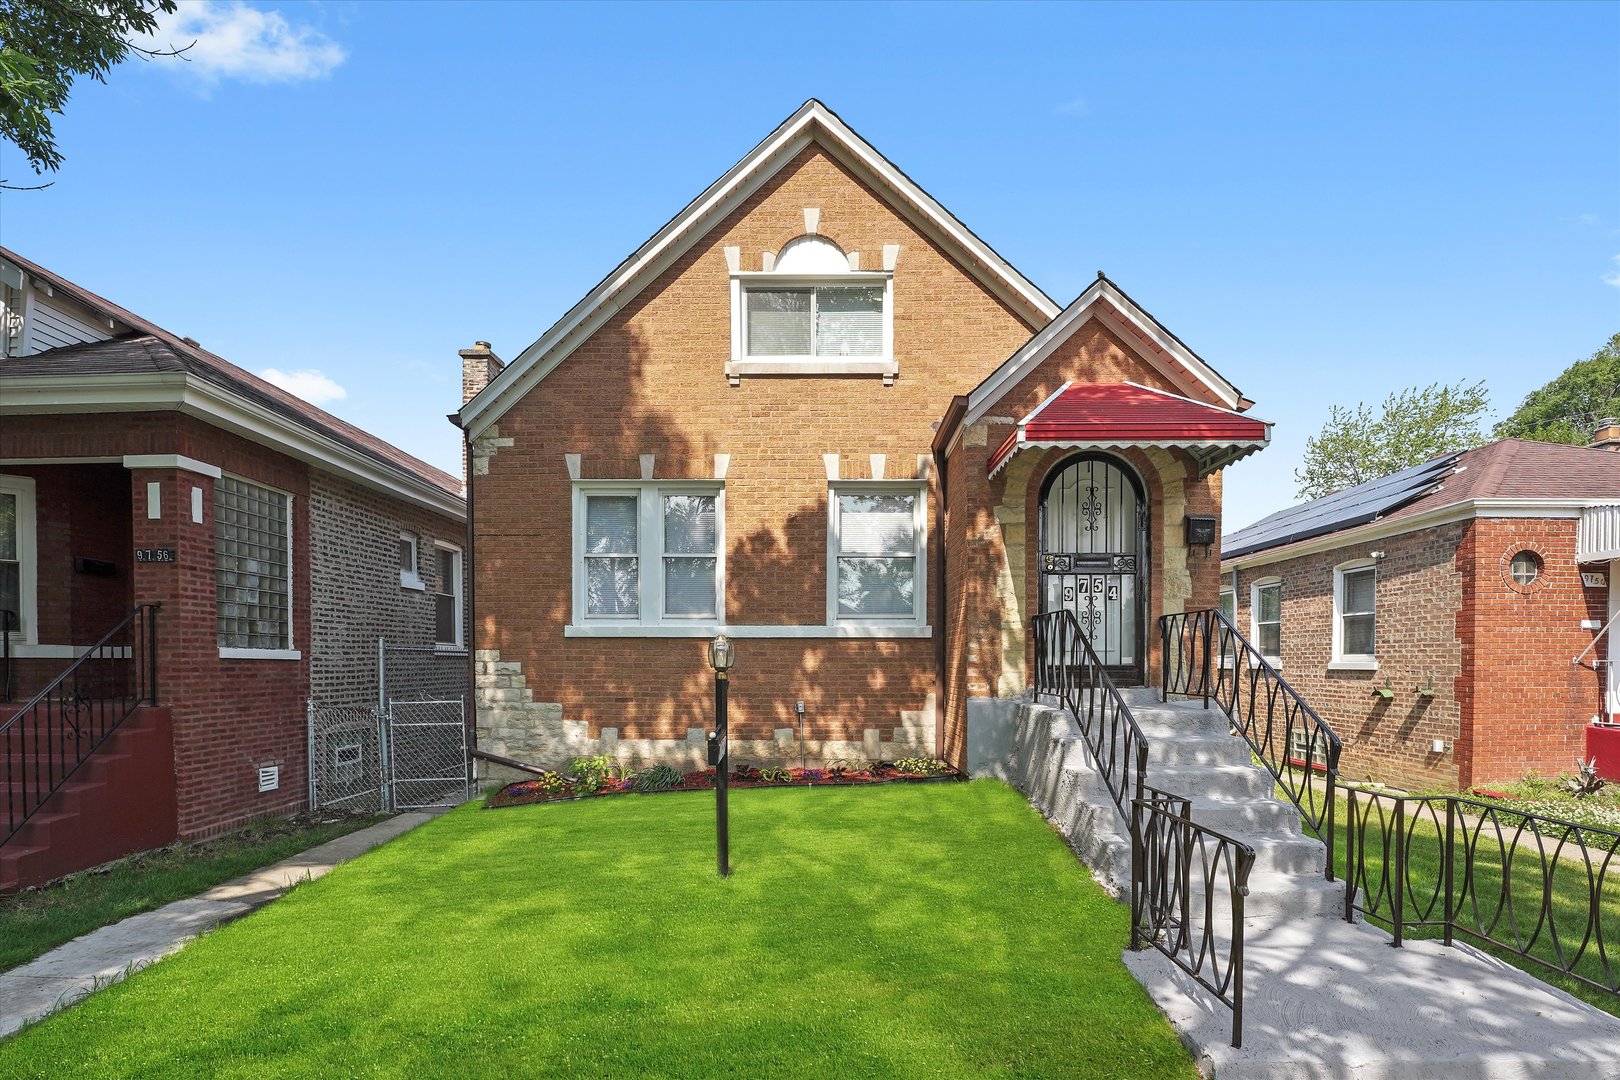
Active
$279,900
3
bds
|
3
ba
|
1,584
sqft
|
built
1938
9754 S Ingleside Ave, Chicago, IL 60628
$-116
Cash flow
-2.2%
Cash-on-Cash Return
5.2%
Cap rate
0.7%
Rent to Value Ratio
Pending
$390,000
1
bds
|
1
ba
|
906
sqft
|
built
2007
450 E Waterside Dr, Chicago, IL 60601
$-766
Cash flow
-10.2%
Cash-on-Cash Return
3.3%
Cap rate
0.8%
Rent to Value Ratio
Active
$345,000
1
bds
|
1
ba
|
883
sqft
|
built
2001
1000 W Adams St, Chicago, IL 60607
$-1,011
Cash flow
-15.3%
Cash-on-Cash Return
2.2%
Cap rate
0.7%
Rent to Value Ratio
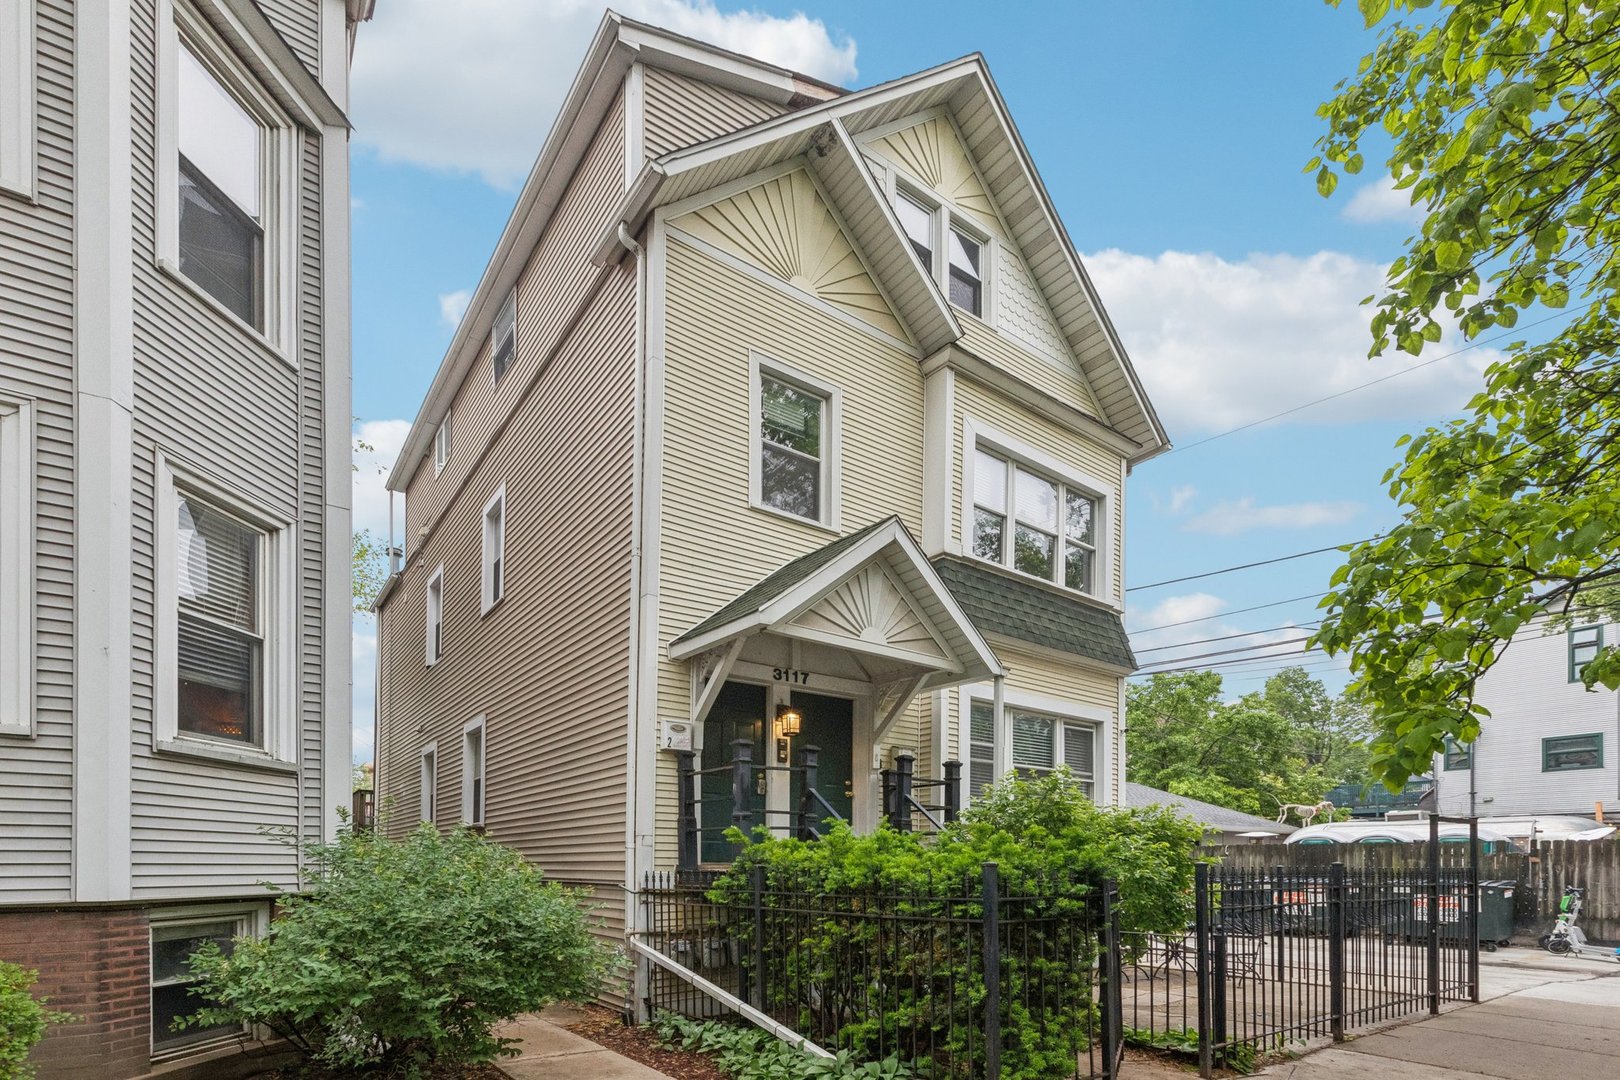
Active
$299,000
2
bds
|
1
ba
|
0
sqft
|
built
1891
3117 N Paulina St, Chicago, IL 60657
$-423
Cash flow
-7.4%
Cash-on-Cash Return
4.0%
Cap rate
0.7%
Rent to Value Ratio
Active
$114,000
5
bds
|
3
ba
|
1,044
sqft
|
built
1918
11732 S Yale Ave, Chicago, IL 60628
$505
Cash flow
23.1%
Cash-on-Cash Return
11.0%
Cap rate
1.4%
Rent to Value Ratio
Active
$195,000
3
bds
|
2
ba
|
1,019
sqft
|
built
1943
2129 E 97th St, Chicago, IL 60617
$154
Cash flow
4.1%
Cash-on-Cash Return
6.6%
Cap rate
0.8%
Rent to Value Ratio
Active
$539,000
2
bds
|
2
ba
|
1,260
sqft
|
built
1879
1400 N La Salle Dr, Chicago, IL 60610
$-1,619
Cash flow
-15.7%
Cash-on-Cash Return
2.1%
Cap rate
0.6%
Rent to Value Ratio
Active
$765,000
2
bds
|
2
ba
|
1,624
sqft
|
built
1972
200 E Delaware Pl, Chicago, IL 60611
$-2,393
Cash flow
-16.3%
Cash-on-Cash Return
1.9%
Cap rate
0.7%
Rent to Value Ratio
Active
$2,495,000
3
bds
|
4
ba
|
3,800
sqft
|
built
2004
840 N Lake Shore Dr, Chicago, IL 60611
$-15,180
Cash flow
-31.7%
Cash-on-Cash Return
-1.6%
Cap rate
0.4%
Rent to Value Ratio
Active
$399,000
2
bds
|
2
ba
|
0
sqft
|
built
2006
150 W Superior St, Chicago, IL 60654
$-952
Cash flow
-12.4%
Cash-on-Cash Return
2.8%
Cap rate
0.9%
Rent to Value Ratio
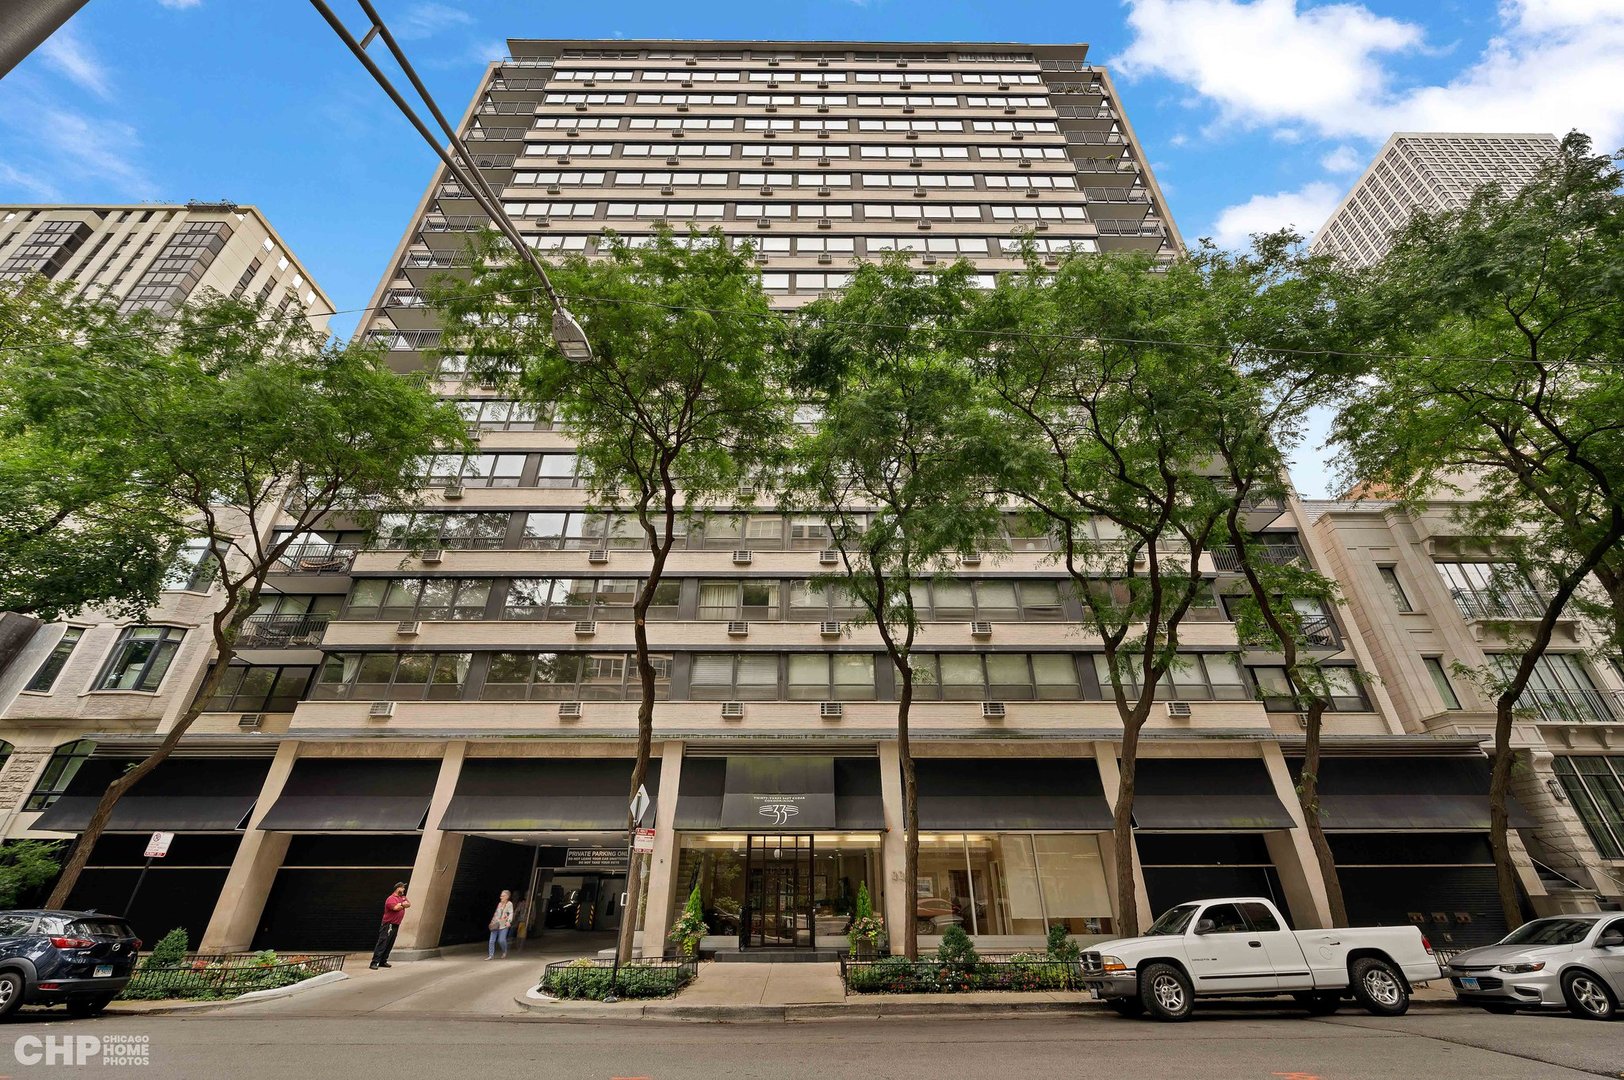
Active
$175,000
1
bds
|
1
ba
|
0
sqft
|
built
1958
33 E Cedar St, Chicago, IL 60611
$-864
Cash flow
-25.8%
Cash-on-Cash Return
-0.2%
Cap rate
1.3%
Rent to Value Ratio
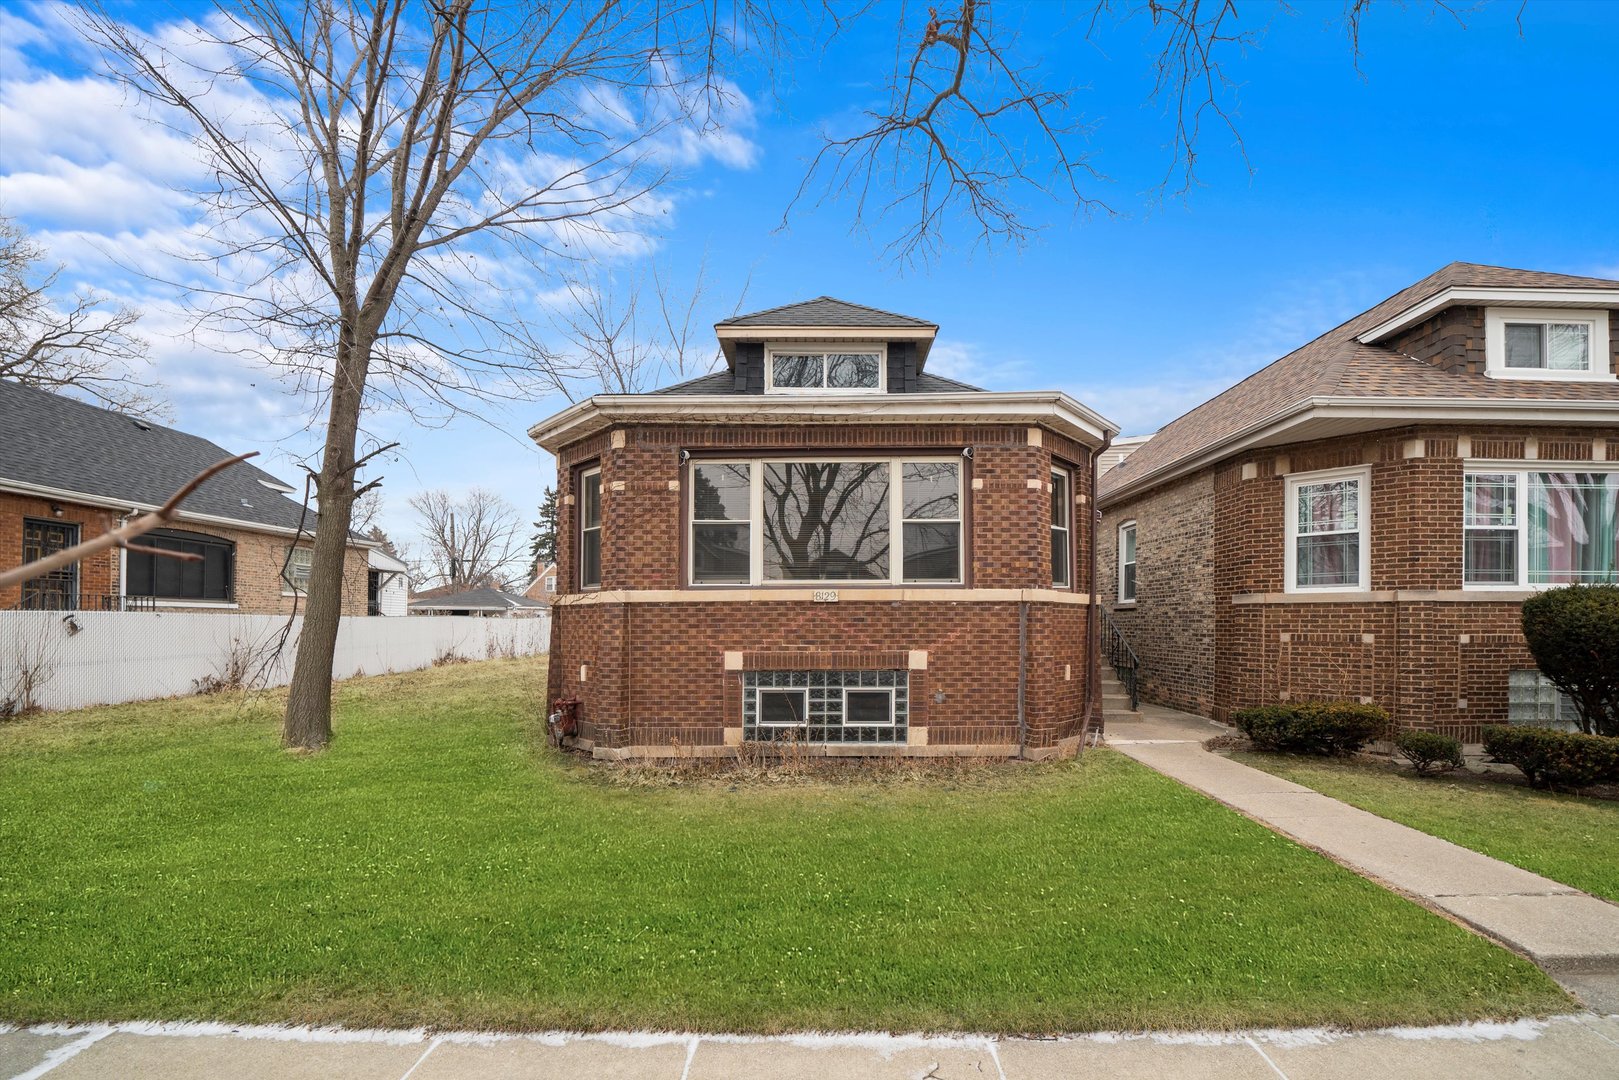
Active
$198,500
4
bds
|
1
ba
|
1,300
sqft
|
built
1925
8129 S Princeton Ave, Chicago, IL 60620
$182
Cash flow
4.8%
Cash-on-Cash Return
6.8%
Cap rate
0.9%
Rent to Value Ratio
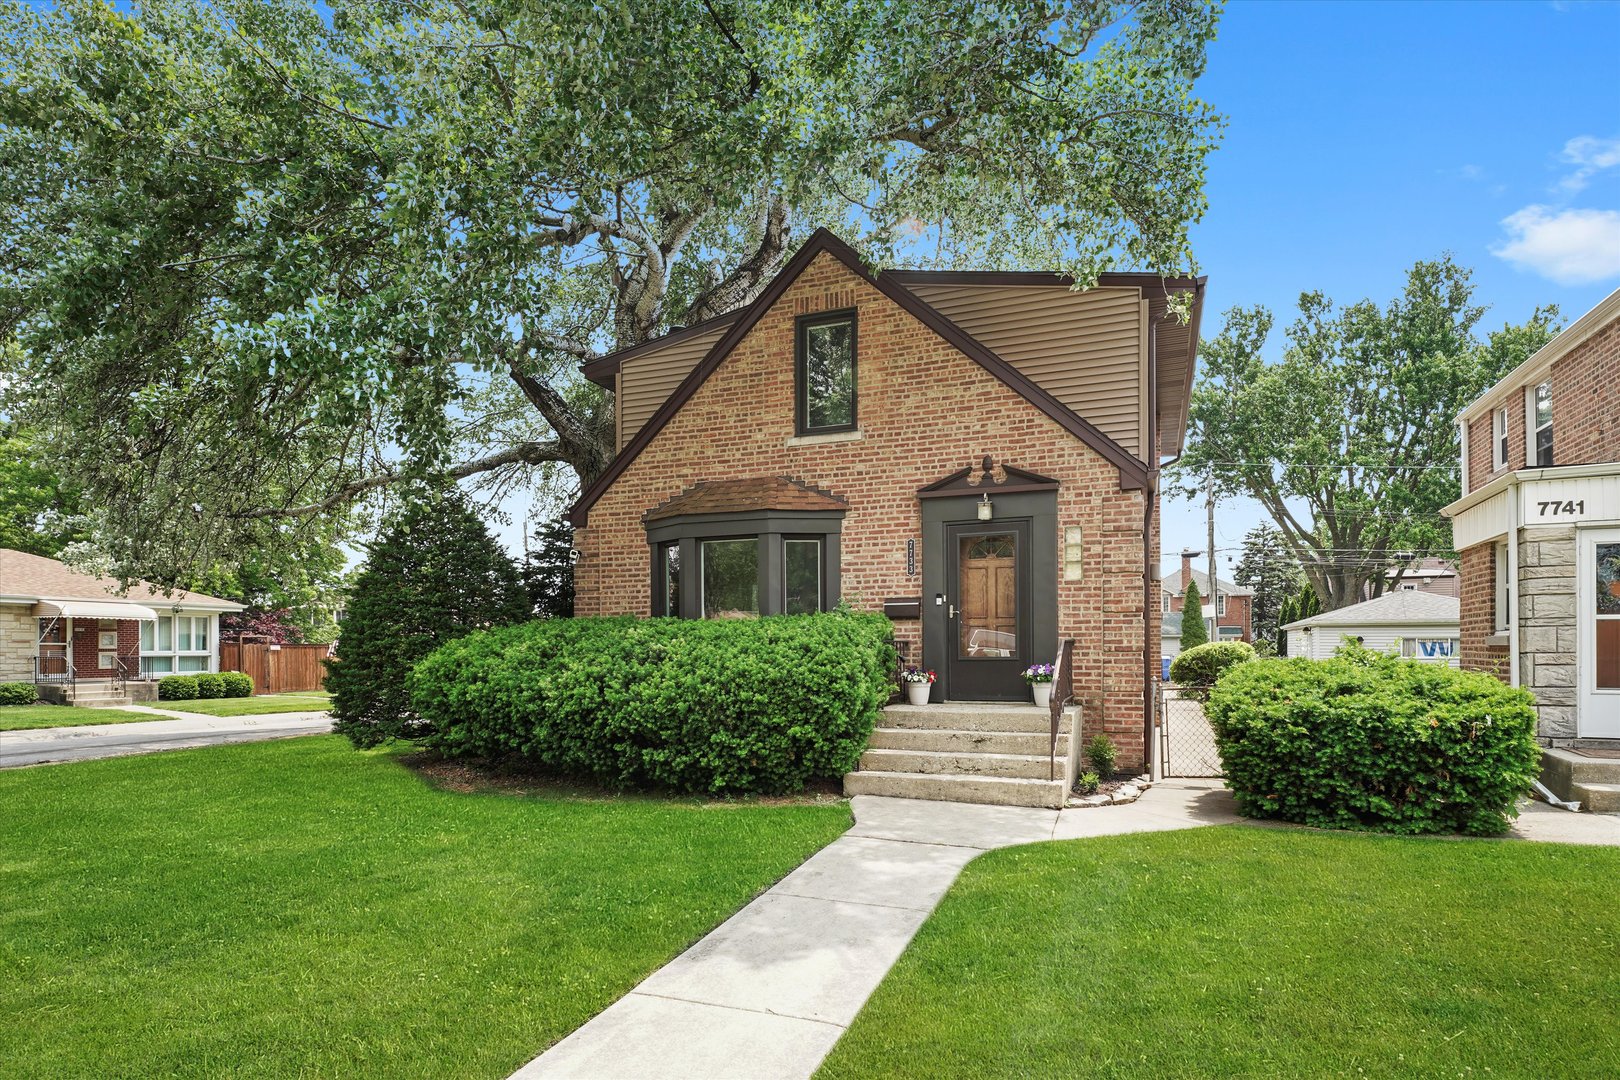
Active under contract
$575,000
4
bds
|
3
ba
|
3,037
sqft
|
built
1943
7733 W Rosedale Ave, Chicago, IL 60631
$-383
Cash flow
-3.5%
Cash-on-Cash Return
4.9%
Cap rate
0.8%
Rent to Value Ratio
Active under contract
$275,000
2
bds
|
2
ba
|
0
sqft
|
built
1920
1515 W Pratt Blvd, Chicago, IL 60626
$-520
Cash flow
-9.9%
Cash-on-Cash Return
3.4%
Cap rate
0.7%
Rent to Value Ratio
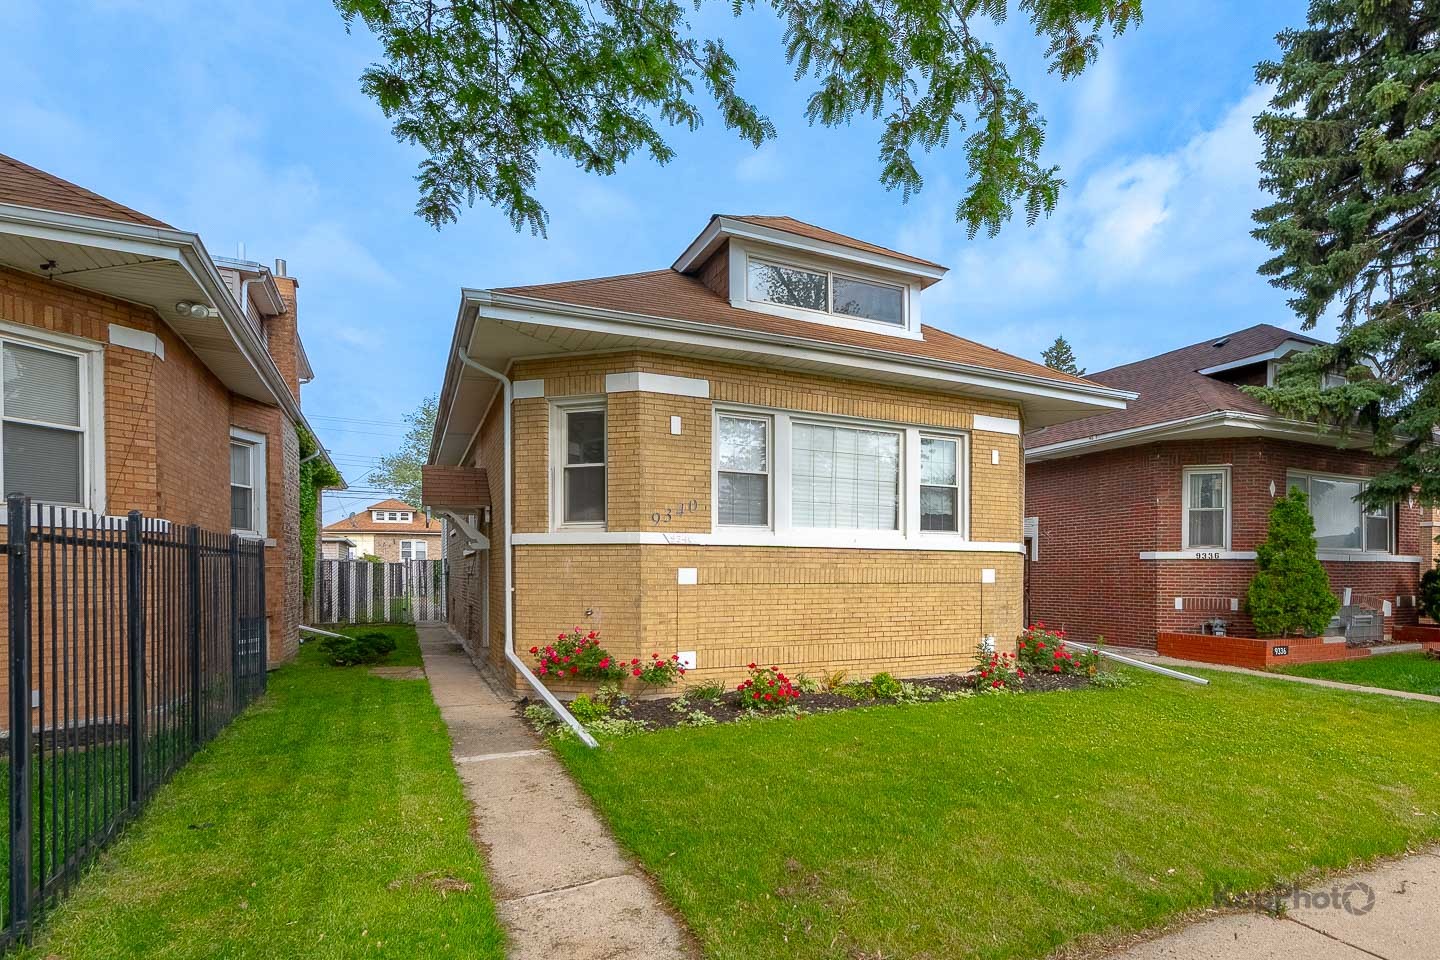
Active
$399,900
4
bds
|
2
ba
|
0
sqft
|
built
1926
9340 S Elizabeth St, Chicago, IL 60620
$-674
Cash flow
-8.8%
Cash-on-Cash Return
3.7%
Cap rate
0.6%
Rent to Value Ratio
Active under contract
$350,000
2
bds
|
2
ba
|
0
sqft
|
built
2005
2656 N Hamlin Ave, Chicago, IL 60647
$-922
Cash flow
-13.7%
Cash-on-Cash Return
2.5%
Cap rate
0.6%
Rent to Value Ratio
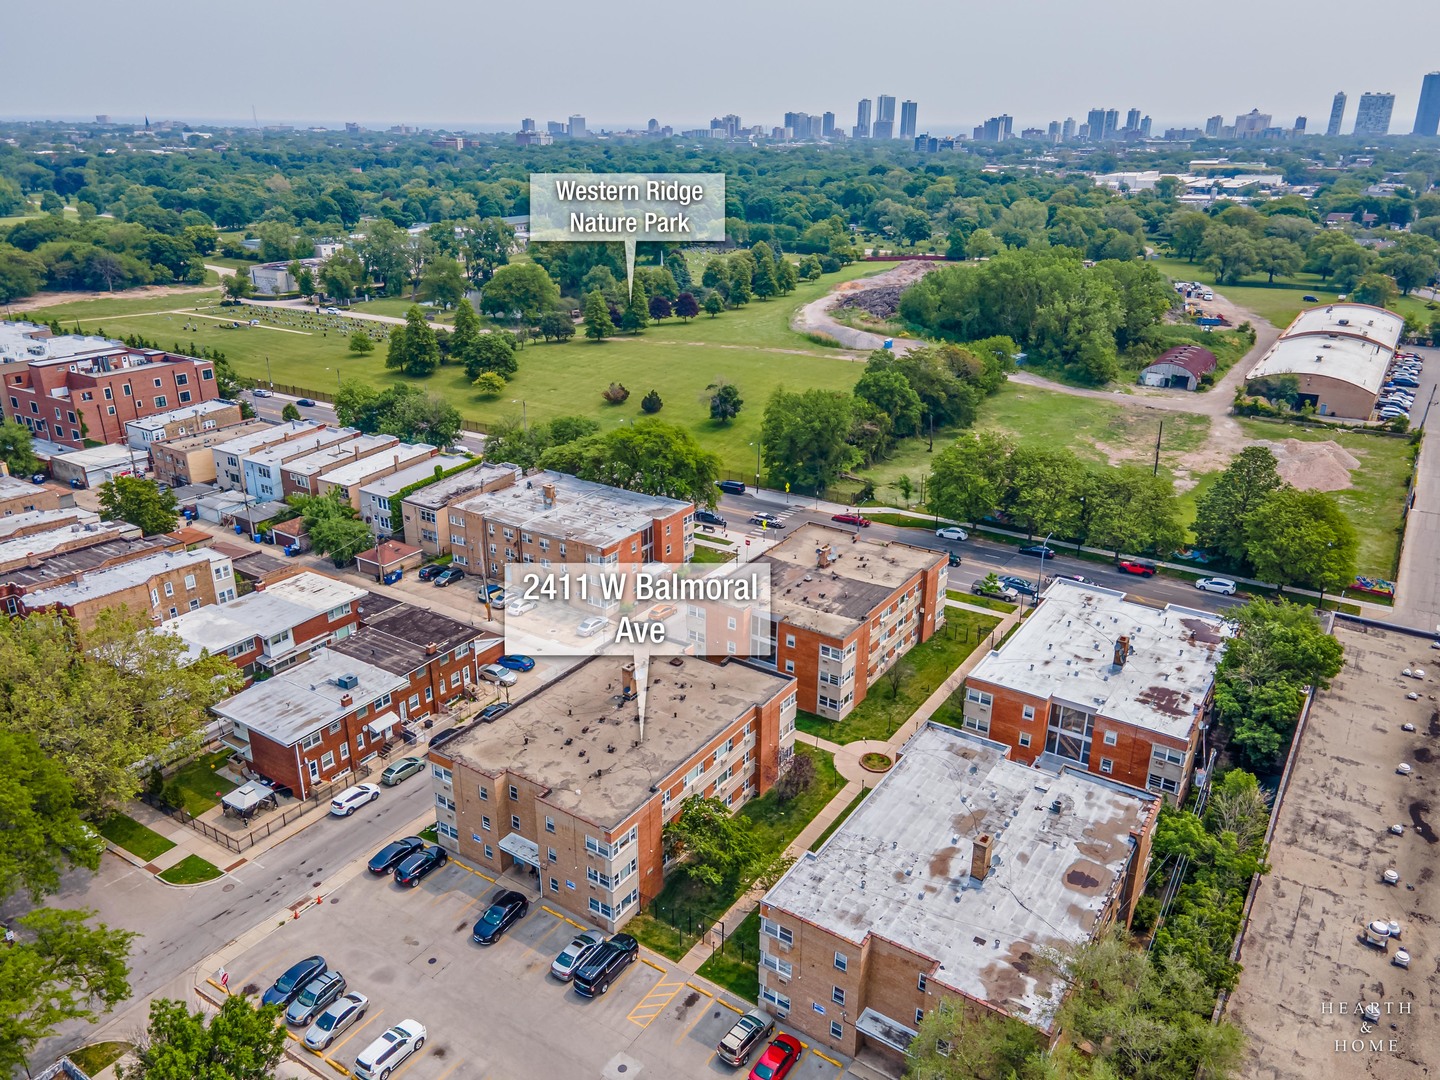
Active
$155,000
1
bds
|
1
ba
|
750
sqft
|
built
1961
2411 W Balmoral Ave, Chicago, IL 60625
$-79
Cash flow
-2.7%
Cash-on-Cash Return
5.1%
Cap rate
1.0%
Rent to Value Ratio
Active
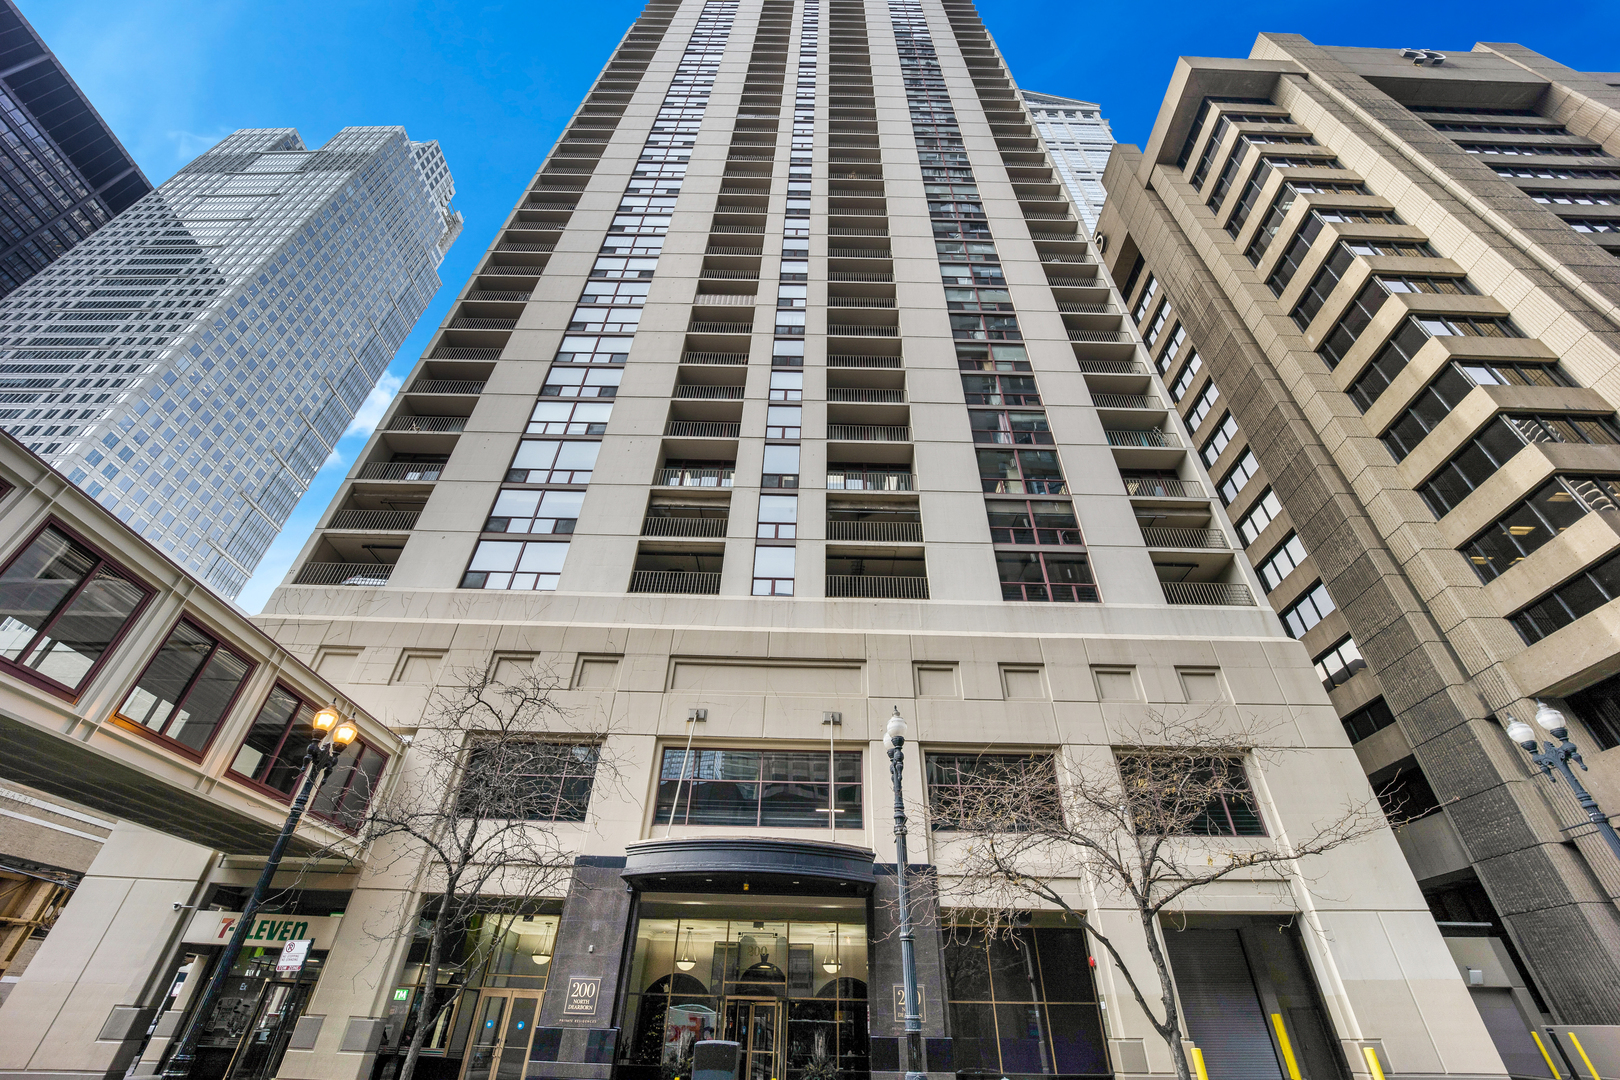
$400,000
2
bds
|
2
ba
|
1,180
sqft
|
built
1989
200 N Dearborn St, Chicago, IL 60601
$-1,160
Cash flow
-15.1%
Cash-on-Cash Return
2.2%
Cap rate
0.8%
Rent to Value Ratio
Active under contract
$649,000
4
bds
|
2
ba
|
0
sqft
|
built
1888
1631 N Drake Ave, Chicago, IL 60647
$-853
Cash flow
-6.9%
Cash-on-Cash Return
4.1%
Cap rate
0.6%
Rent to Value Ratio
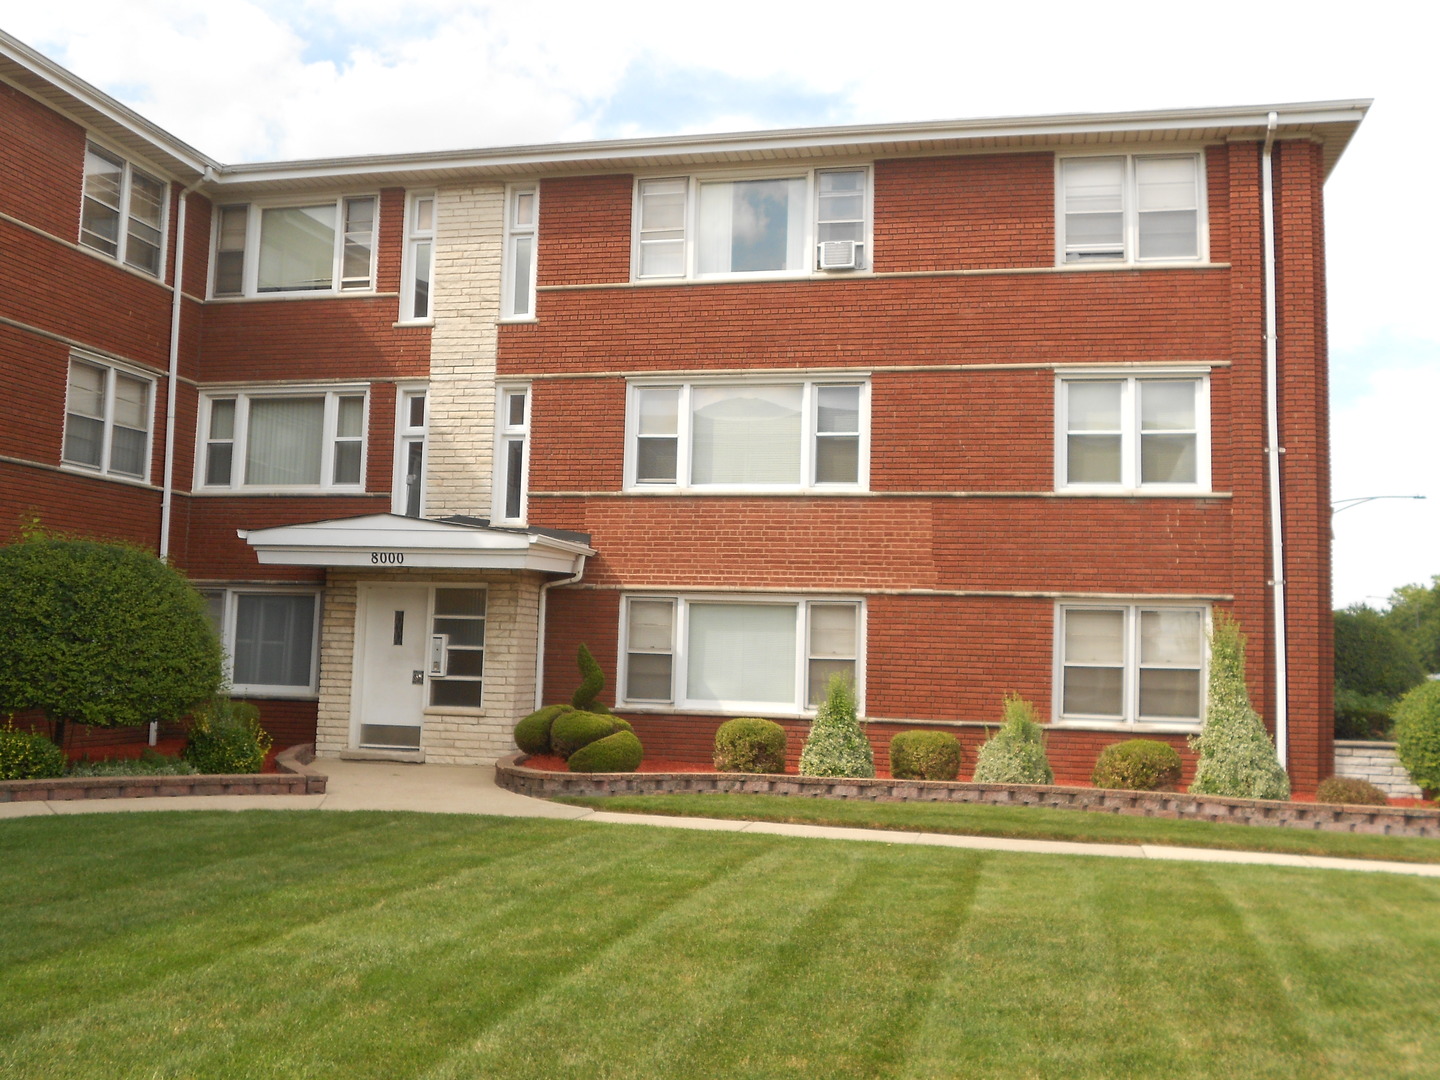
Active
$129,000
2
bds
|
1
ba
|
756
sqft
|
built
1967
8000 S Pulaski Rd, Chicago, IL 60652
$-23
Cash flow
-0.9%
Cash-on-Cash Return
5.5%
Cap rate
1.0%
Rent to Value Ratio
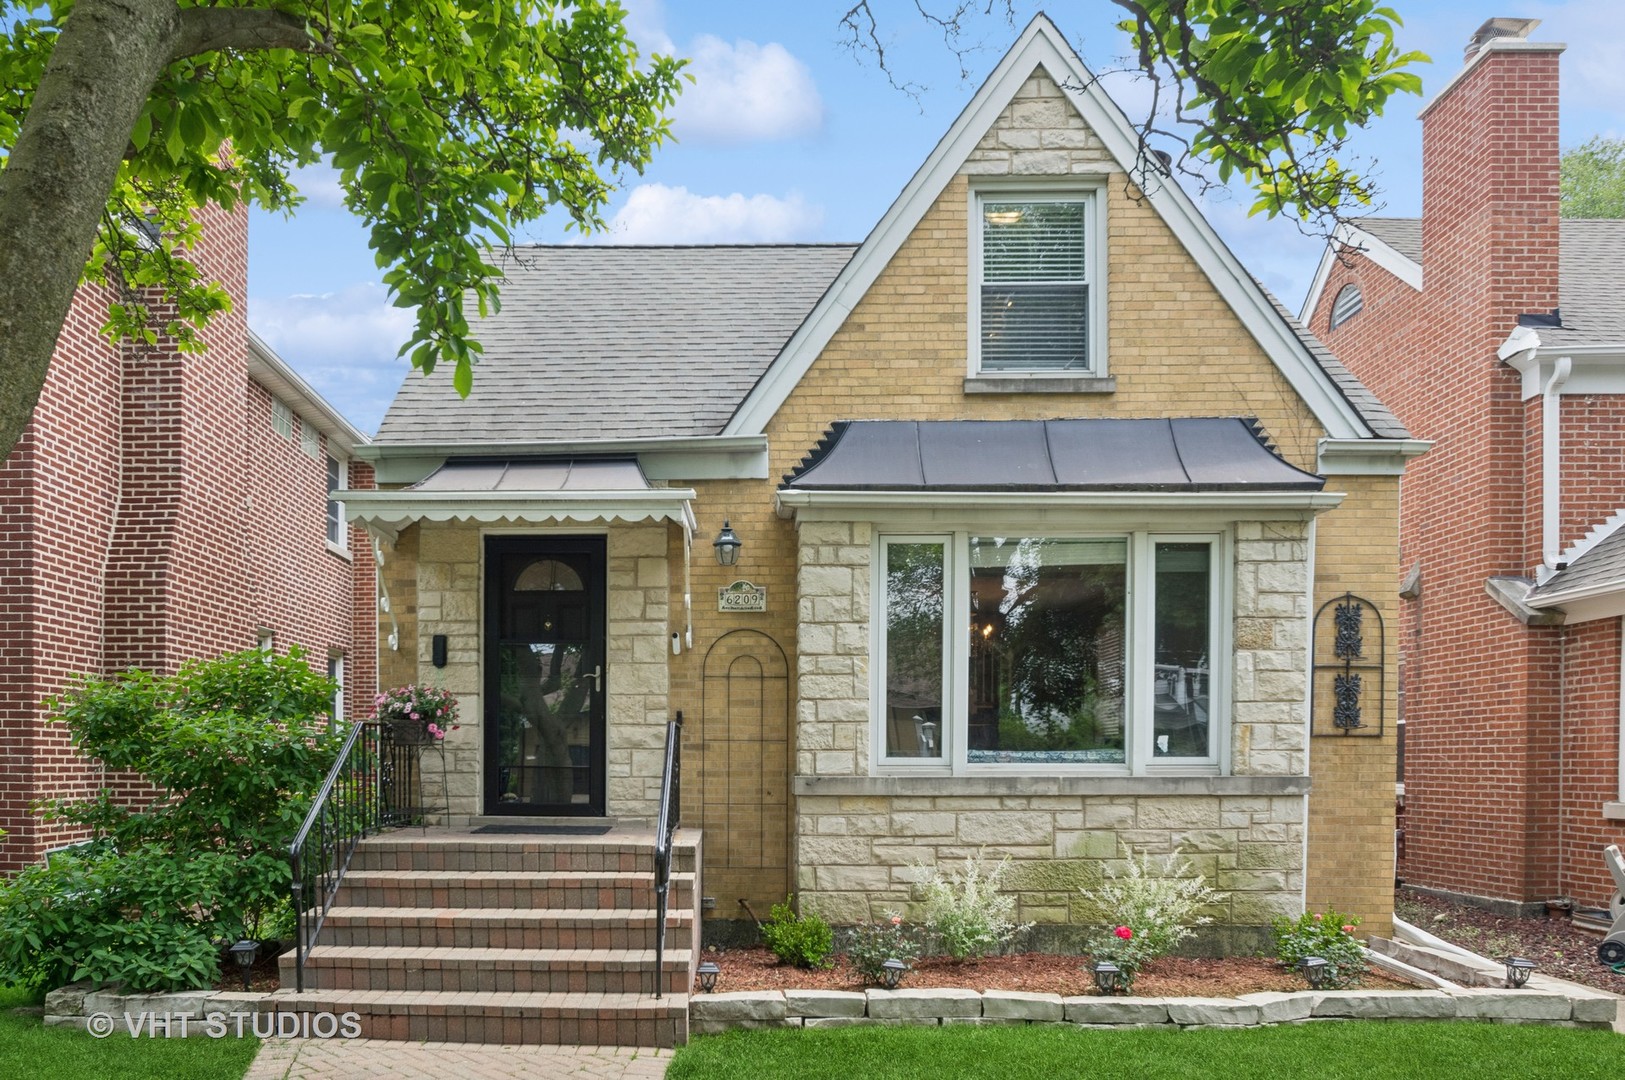
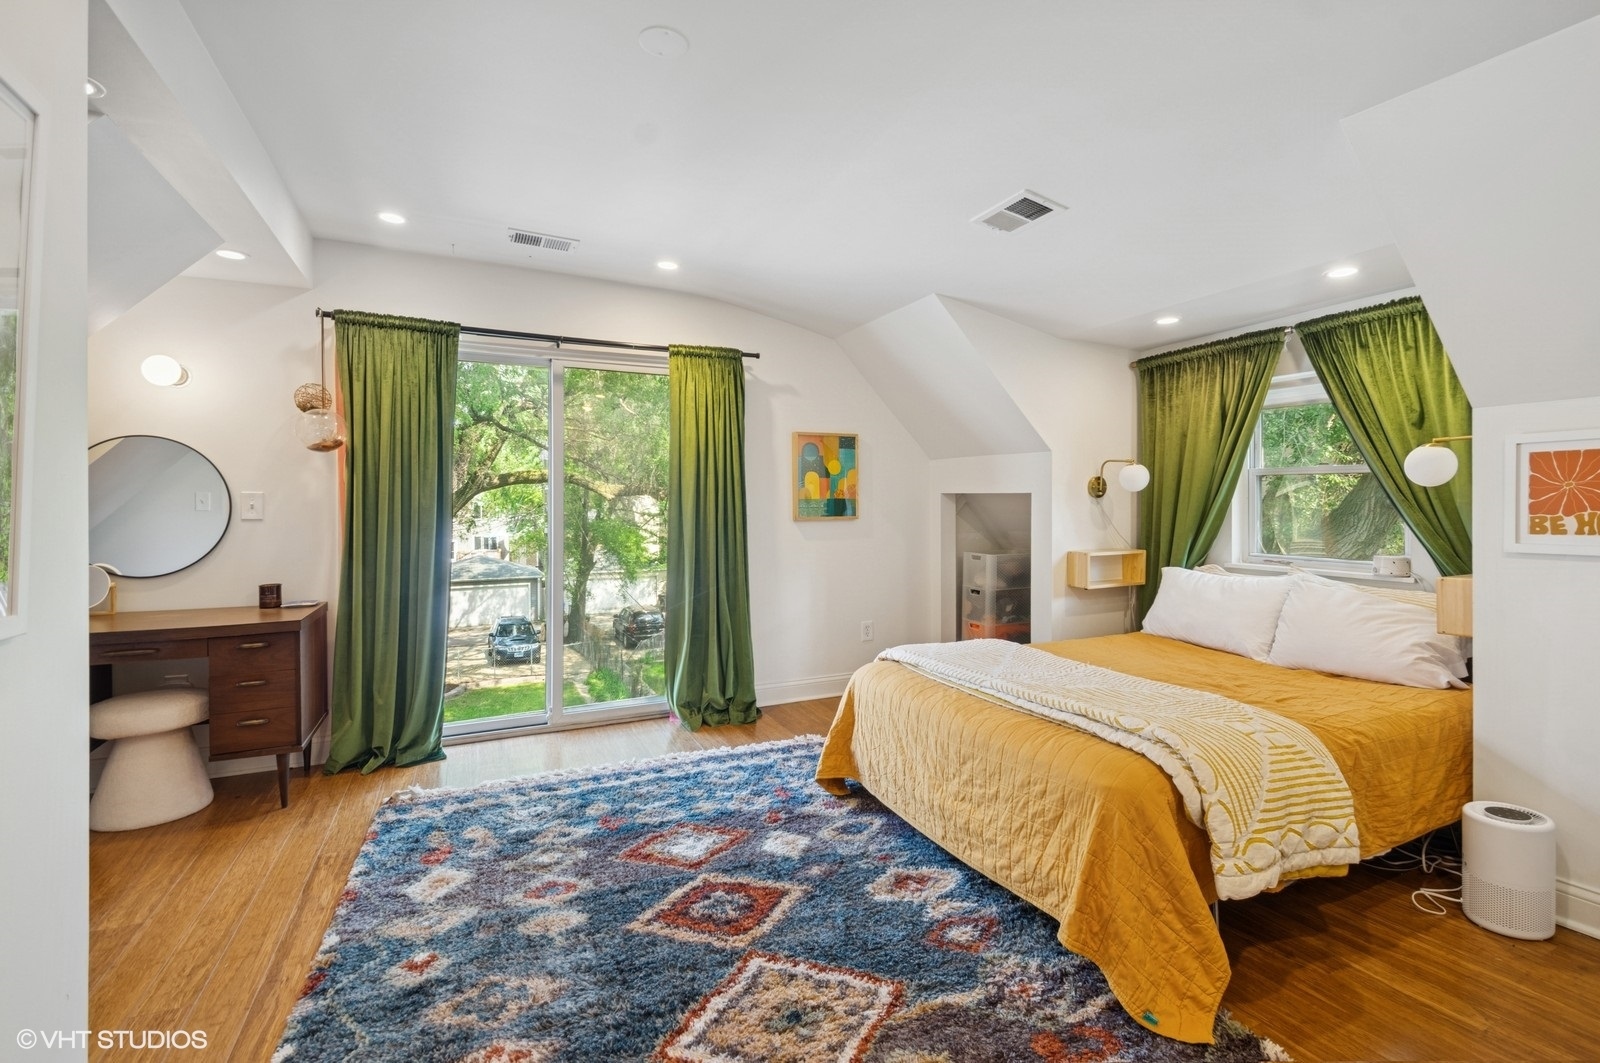
Active
$615,000
4
bds
|
2
ba
|
2,227
sqft
|
built
1947
6209 N Legett Ave, Chicago, IL 60646
$-615
Cash flow
-5.2%
Cash-on-Cash Return
4.5%
Cap rate
0.7%
Rent to Value Ratio
Active
$140,000
2
bds
|
1
ba
|
1,200
sqft
|
built
1888
5247 S May St, Chicago, IL 60609
$438
Cash flow
16.3%
Cash-on-Cash Return
9.4%
Cap rate
1.1%
Rent to Value Ratio
Active
$865,000
3
bds
|
3
ba
|
1,677
sqft
|
built
1998
2855 N Wolcott Ave, Chicago, IL 60657
$-2,016
Cash flow
-12.2%
Cash-on-Cash Return
2.9%
Cap rate
0.6%
Rent to Value Ratio
Active under contract
$245,000
2
bds
|
1
ba
|
892
sqft
|
built
1949
6119 S Melvina Ave, Chicago, IL 60638
$212
Cash flow
4.5%
Cash-on-Cash Return
6.7%
Cap rate
1.0%
Rent to Value Ratio
Active under contract
$525,000
3
bds
|
3
ba
|
1,900
sqft
|
built
1915
1849 W Newport Ave, Chicago, IL 60657
$-727
Cash flow
-7.2%
Cash-on-Cash Return
4.0%
Cap rate
0.8%
Rent to Value Ratio