Chicago, IL Investment Properties for Sale
Browse homes for sale and investment properties in Chicago, IL. Refine your search by price, property type, or more.
Best cash flowing properties in Chicago, IL
Pending
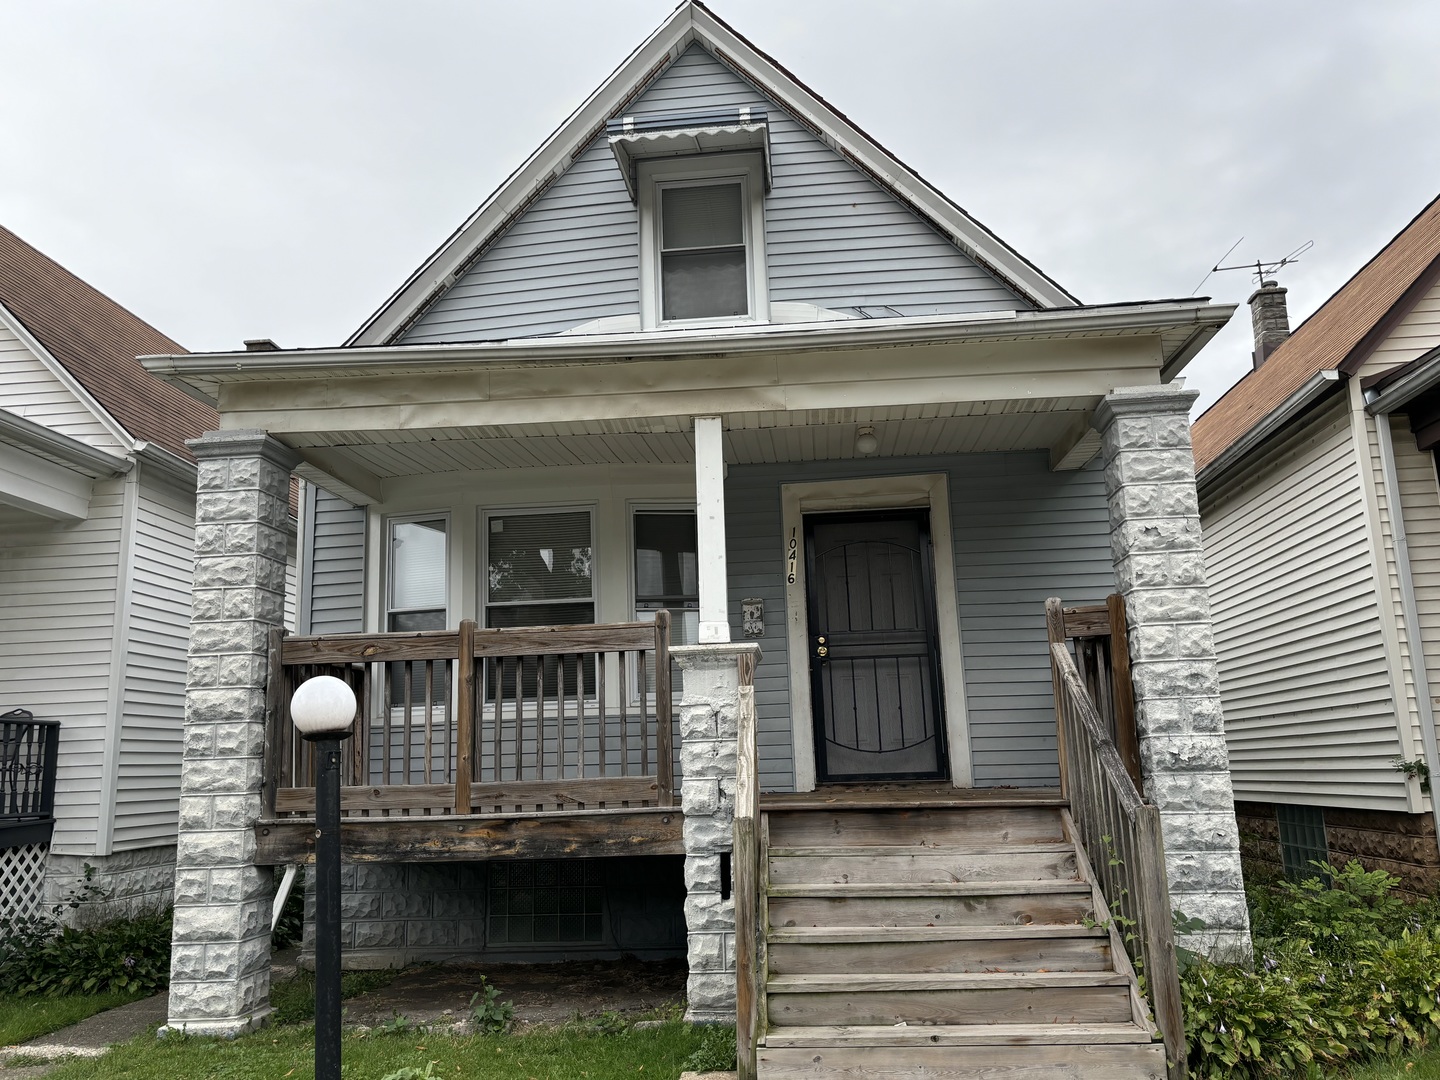
$70,000
3
bds
|
1
ba
|
902
sqft
|
built
1913
10416 S Wabash Ave, Chicago, IL 60628
$1,230
Cash flow
20.5%
Cash-on-Cash Return
21.1%
Cap rate
2.7%
Rent to Value Ratio
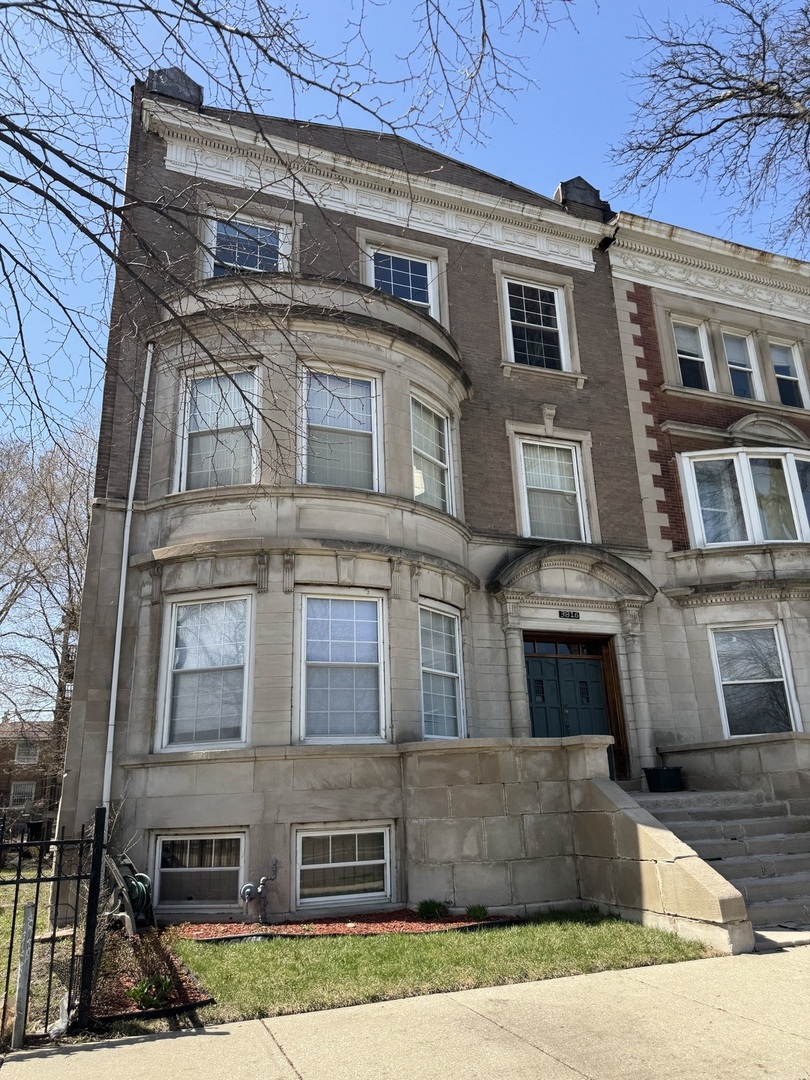
Active
$115,000
3
bds
|
2
ba
|
1,200
sqft
|
built
1920
3816 S King Dr, Chicago, IL 60653
$832
Cash flow
37.7%
Cash-on-Cash Return
15.0%
Cap rate
2.3%
Rent to Value Ratio
3,734 out of 4,286 properties for sale in Chicago, IL
Limited Results Shown
Create a free account, or log in to reveal all property listings and enjoy the complete experience.
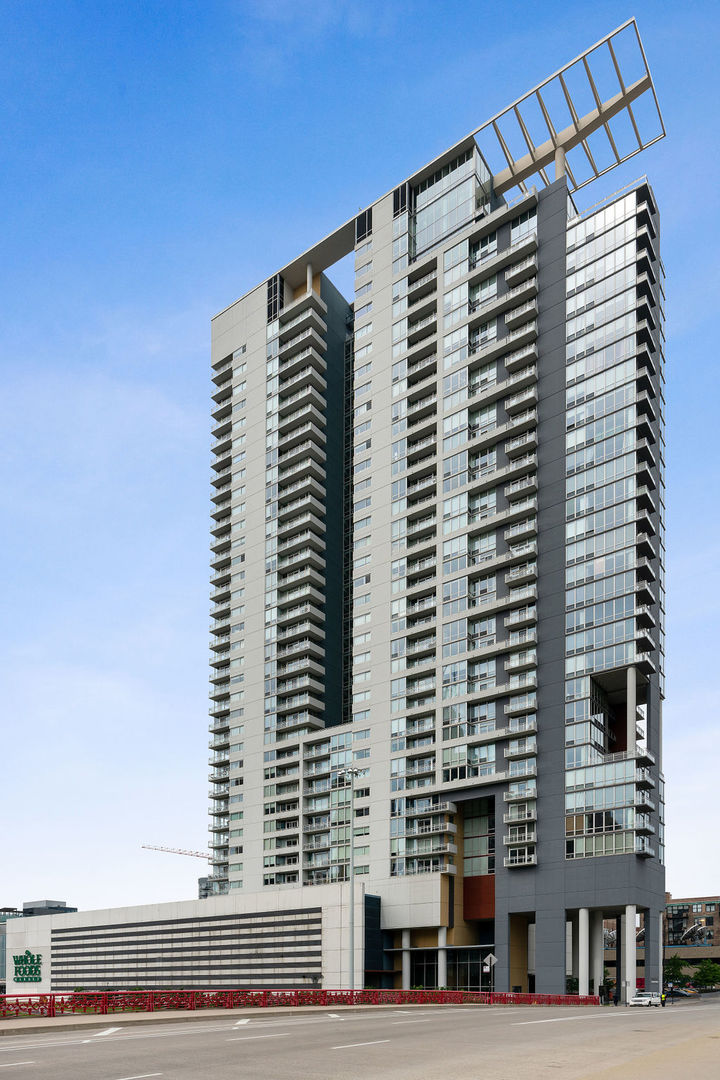
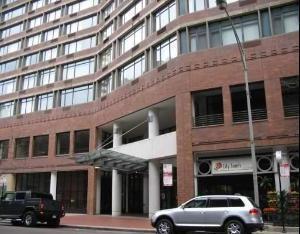
Active
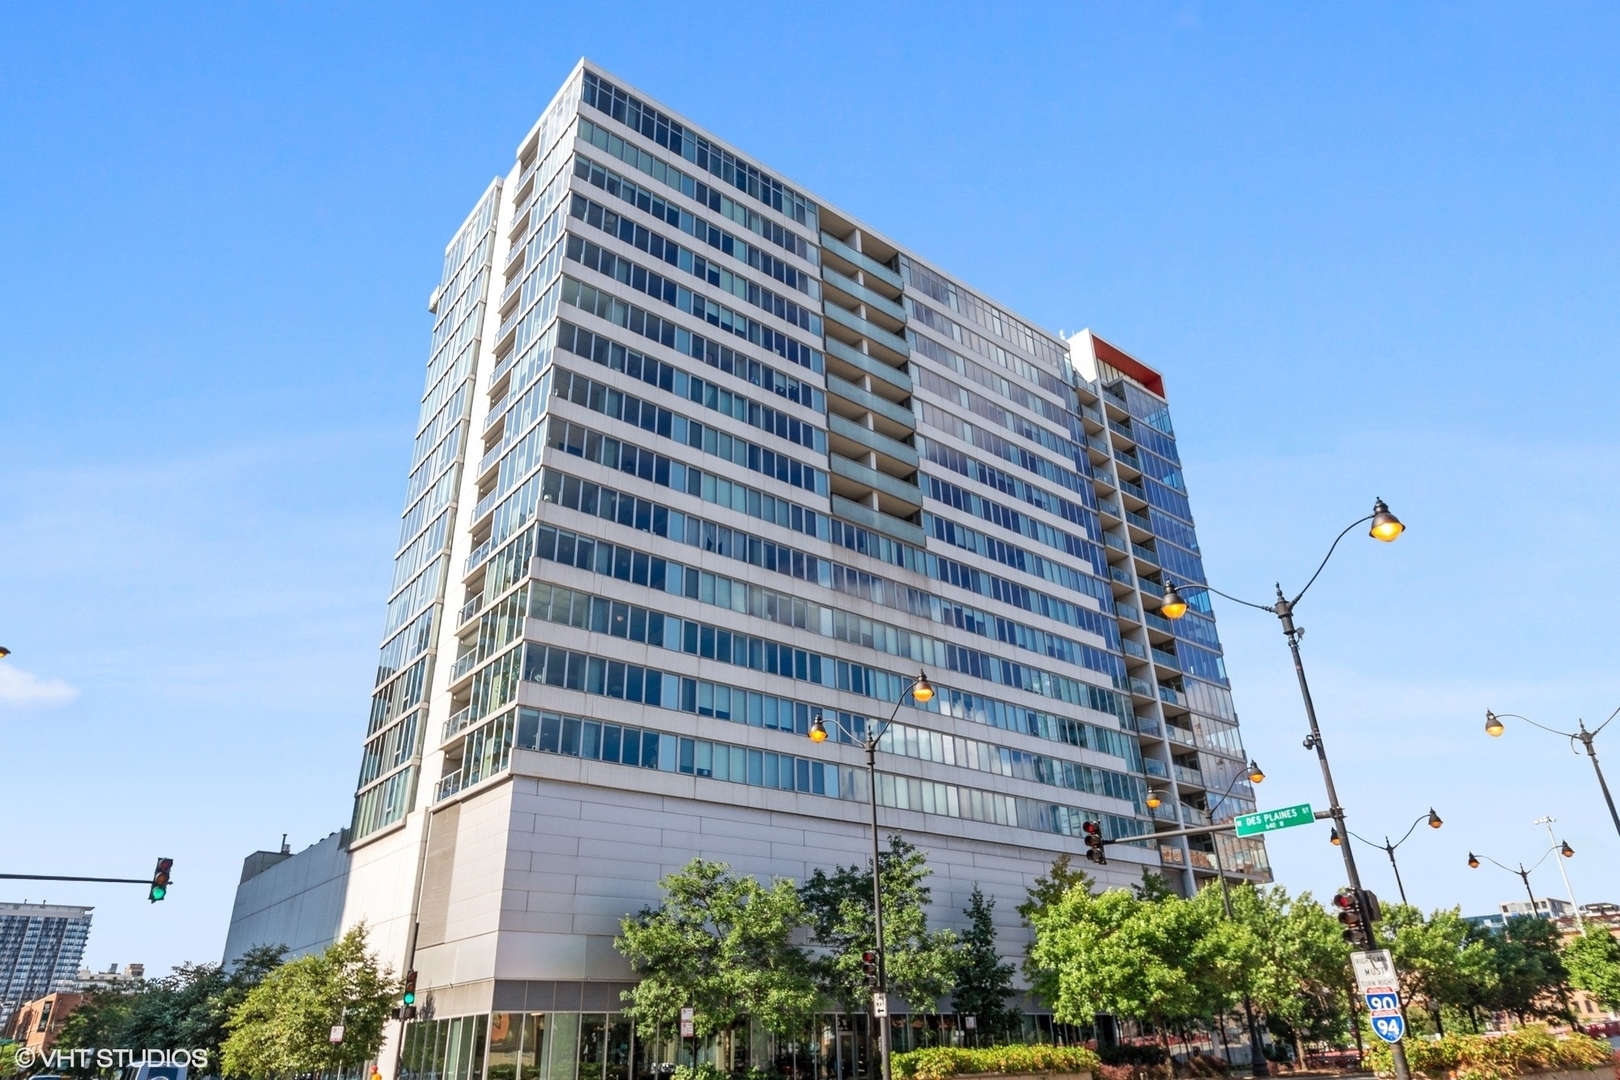
$650,000
2
bds
|
2
ba
|
1,739
sqft
|
built
2003
737 W Washington Blvd, Chicago, IL 60661
$-3,307
Cash flow
-26.5%
Cash-on-Cash Return
0.2%
Cap rate
0.8%
Rent to Value Ratio
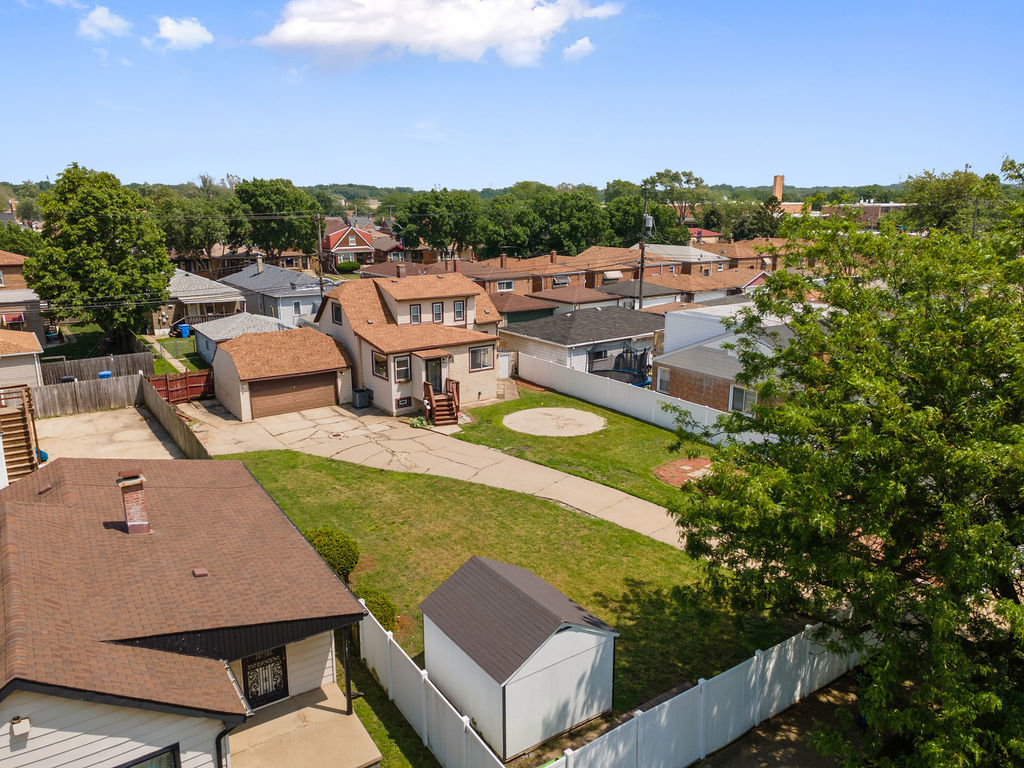
Active
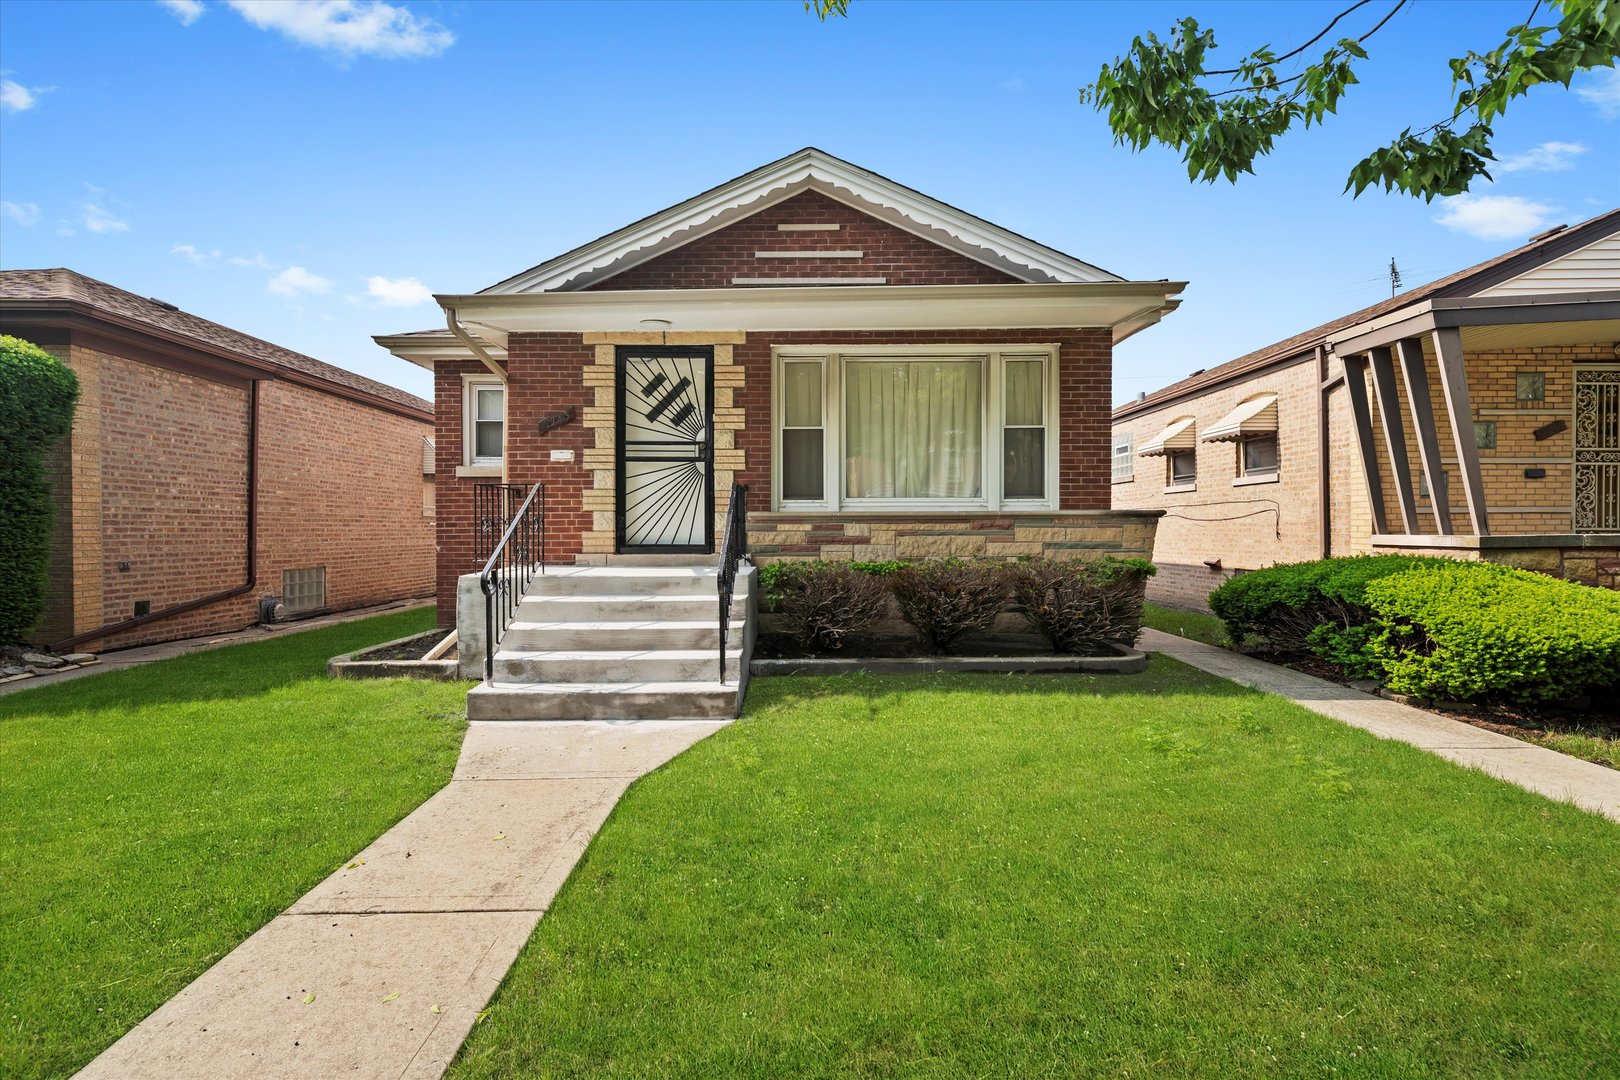
$275,000
3
bds
|
2
ba
|
2,000
sqft
|
built
1927
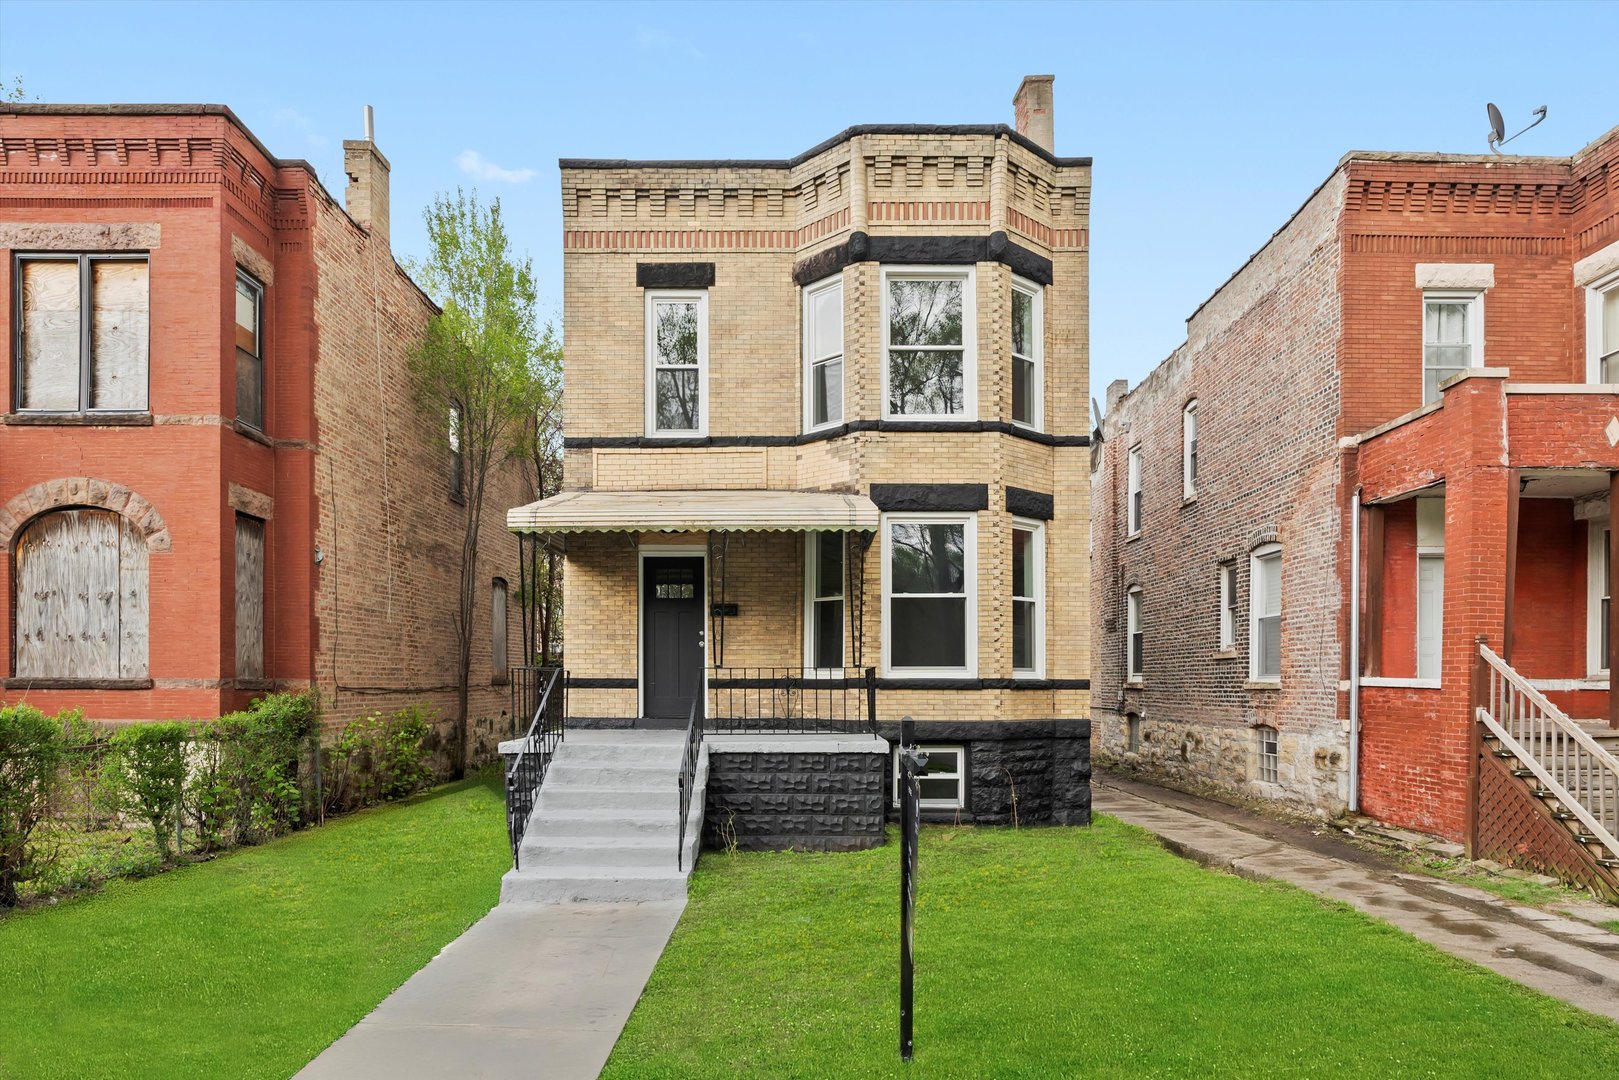
11319 S Green Bay Ave, Chicago, IL 60617
$321
Cash flow
6.1%
Cash-on-Cash Return
7.7%
Cap rate
1.0%
Rent to Value Ratio
Pending
$70,000
3
bds
|
1
ba
|
902
sqft
|
built
1913
10416 S Wabash Ave, Chicago, IL 60628
$1,230
Cash flow
20.5%
Cash-on-Cash Return
21.1%
Cap rate
2.7%
Rent to Value Ratio
Active
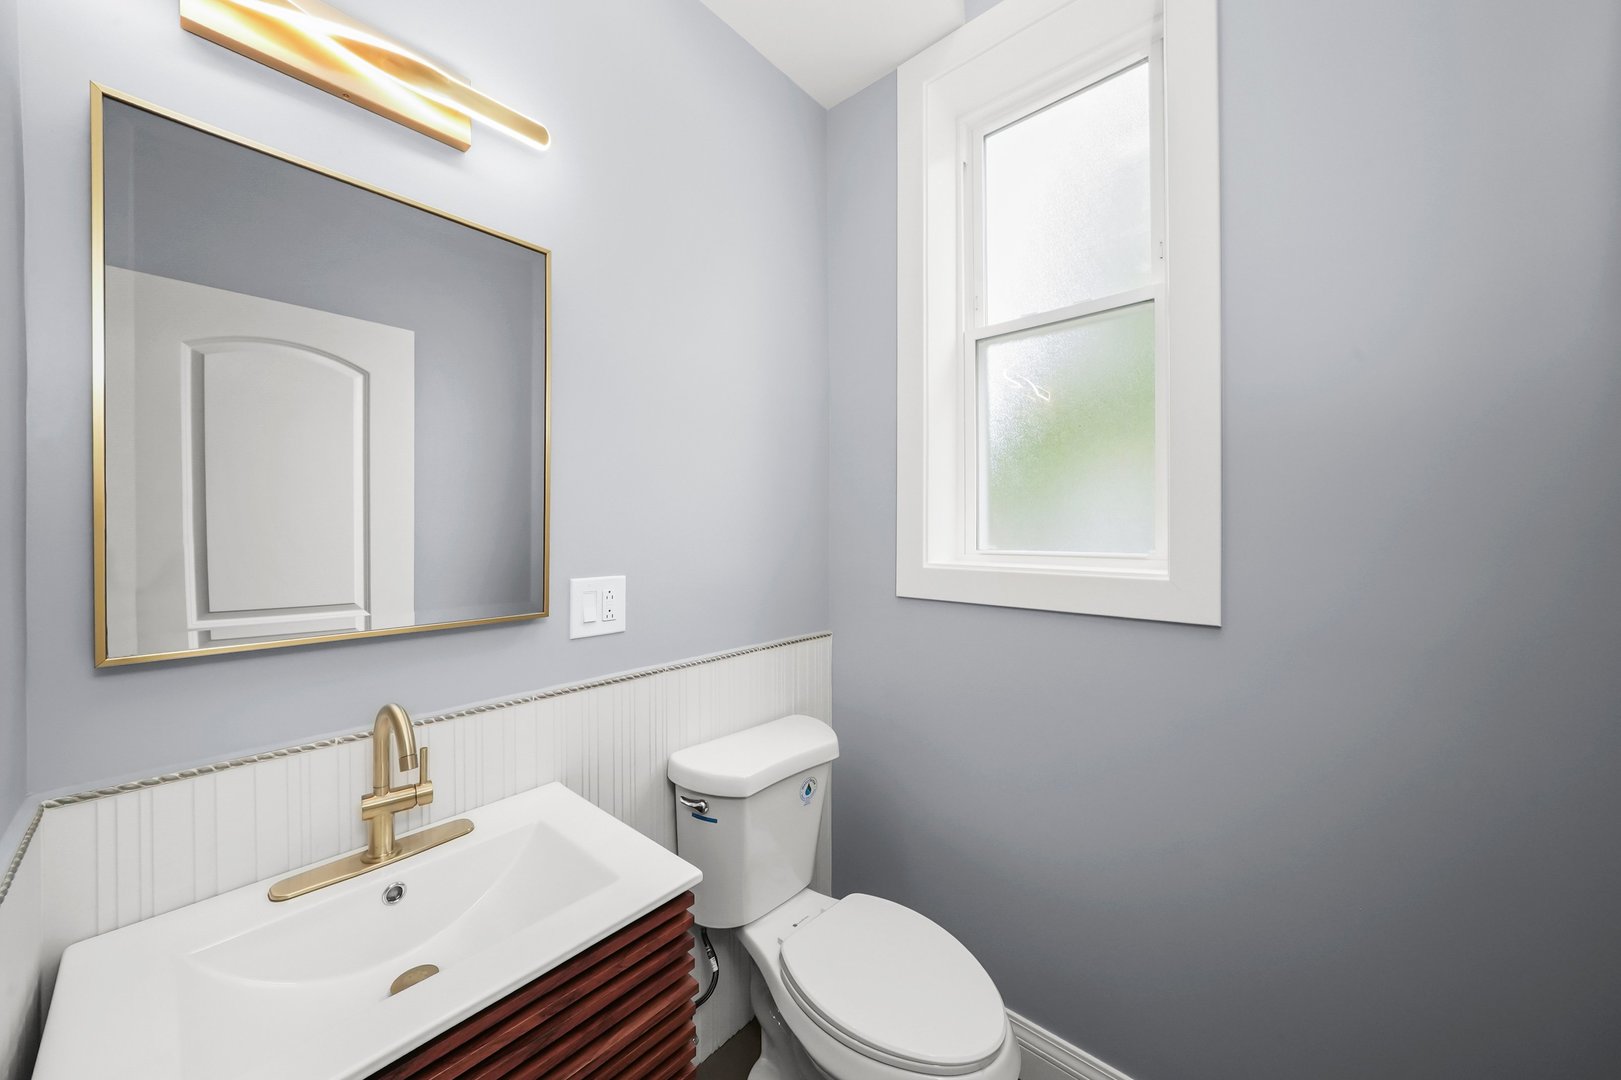
$375,000
2
bds
|
1
ba
|
0
sqft
|
built
1929
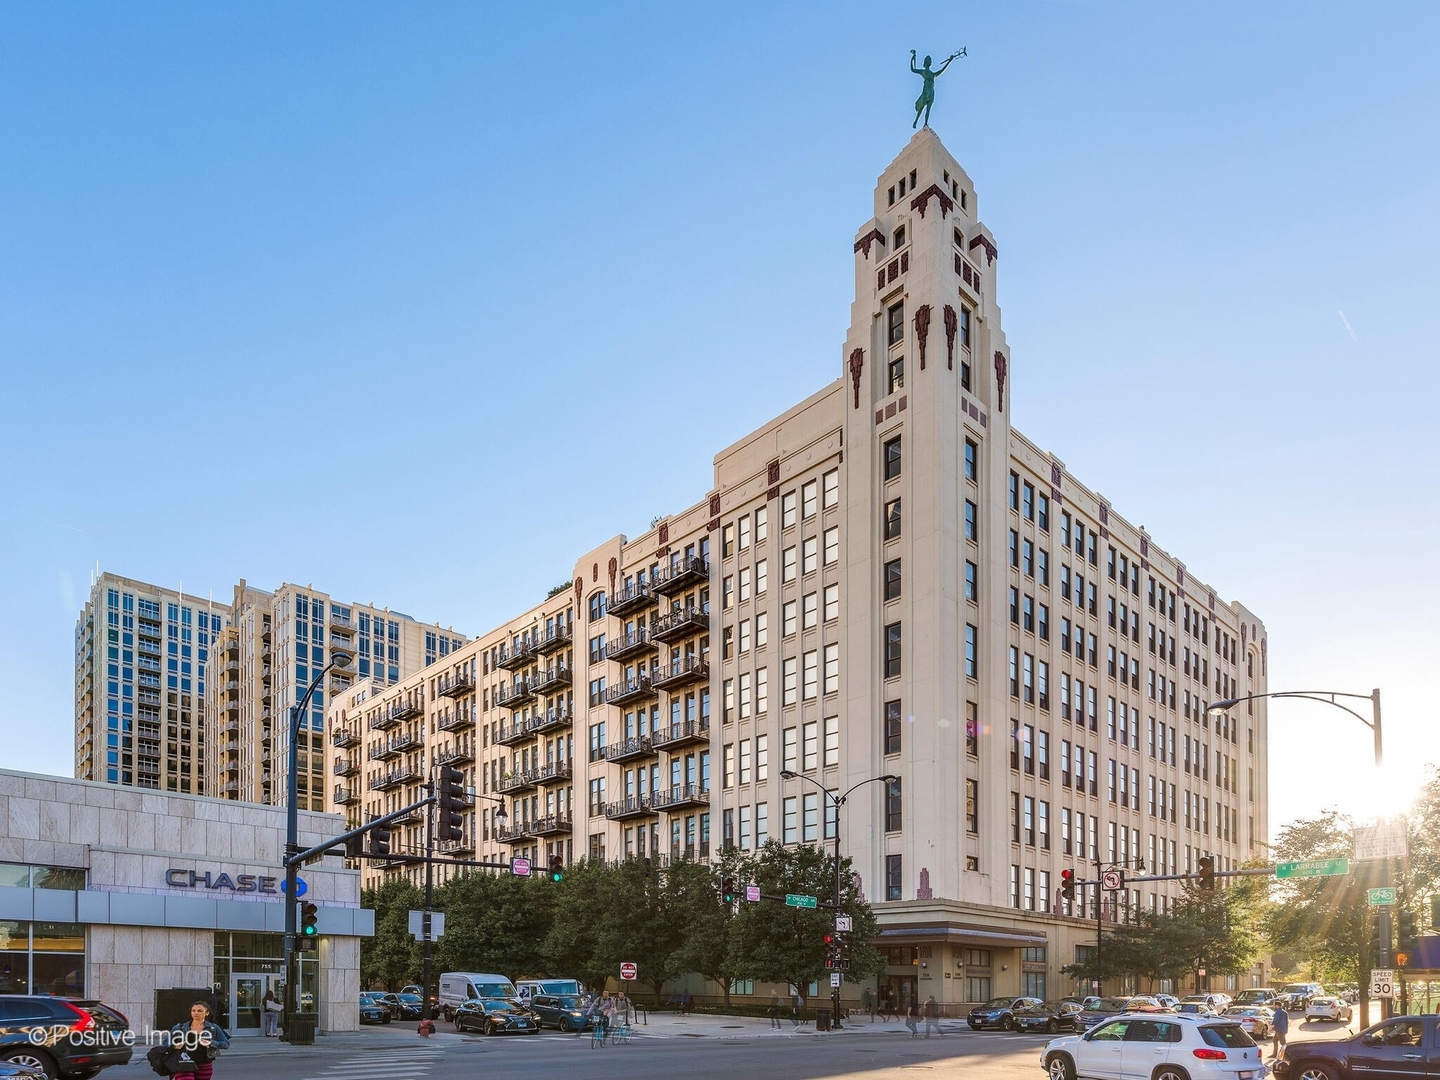
758 N Larrabee St, Chicago, IL 60654
$-1,077
Cash flow
-15.0%
Cash-on-Cash Return
2.8%
Cap rate
0.8%
Rent to Value Ratio
Active
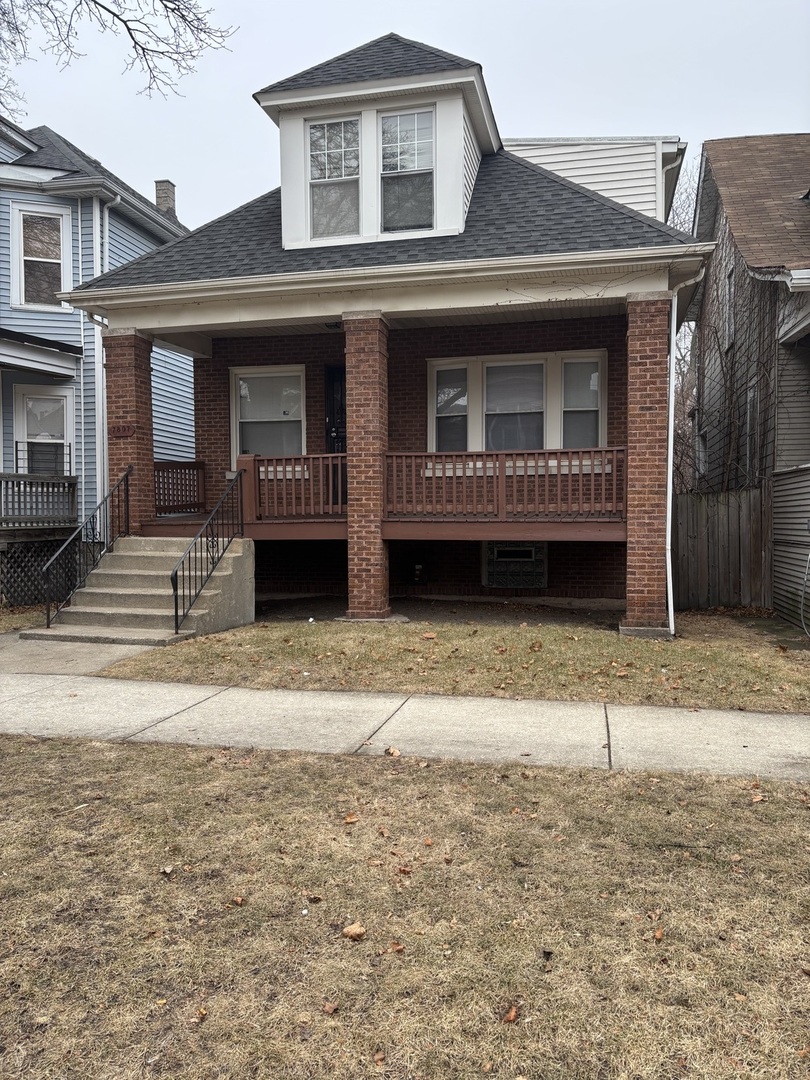
$475,000
2
bds
|
1
ba
|
1,200
sqft
|
built
1928
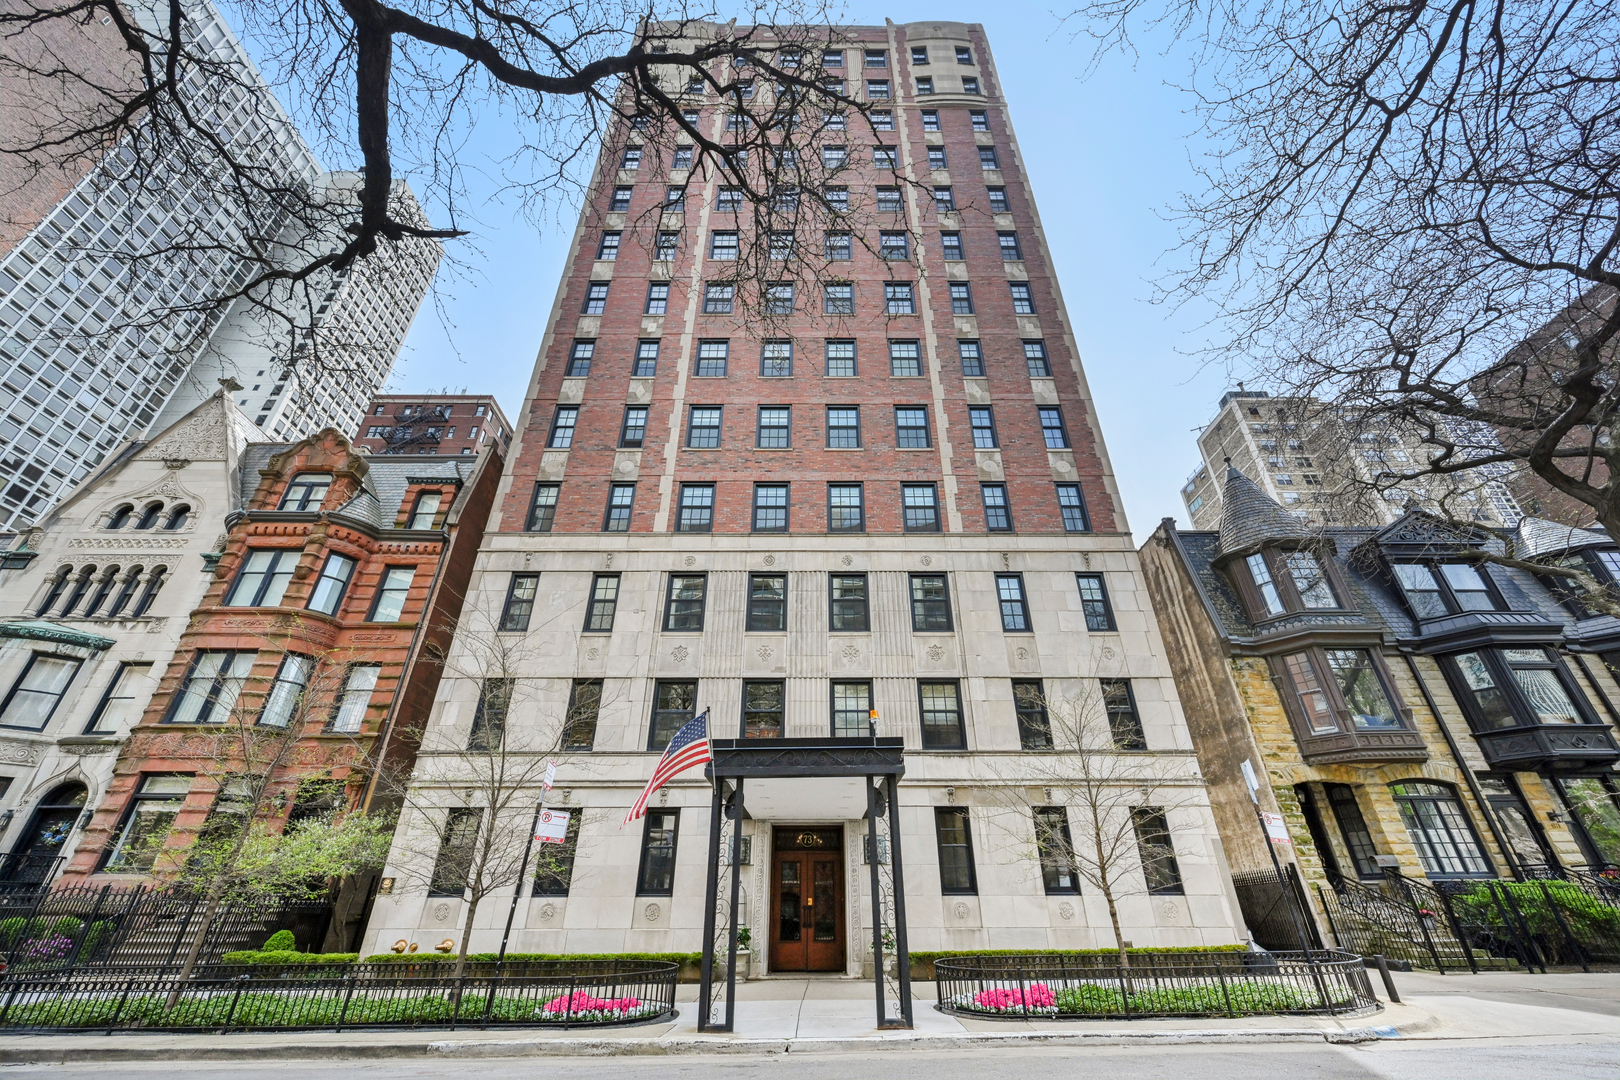
73 E Elm St, Chicago, IL 60611
$-2,578
Cash flow
-28.3%
Cash-on-Cash Return
-0.2%
Cap rate
0.7%
Rent to Value Ratio
Active
$449,000
4
bds
|
3
ba
|
1,916
sqft
|
built
1999
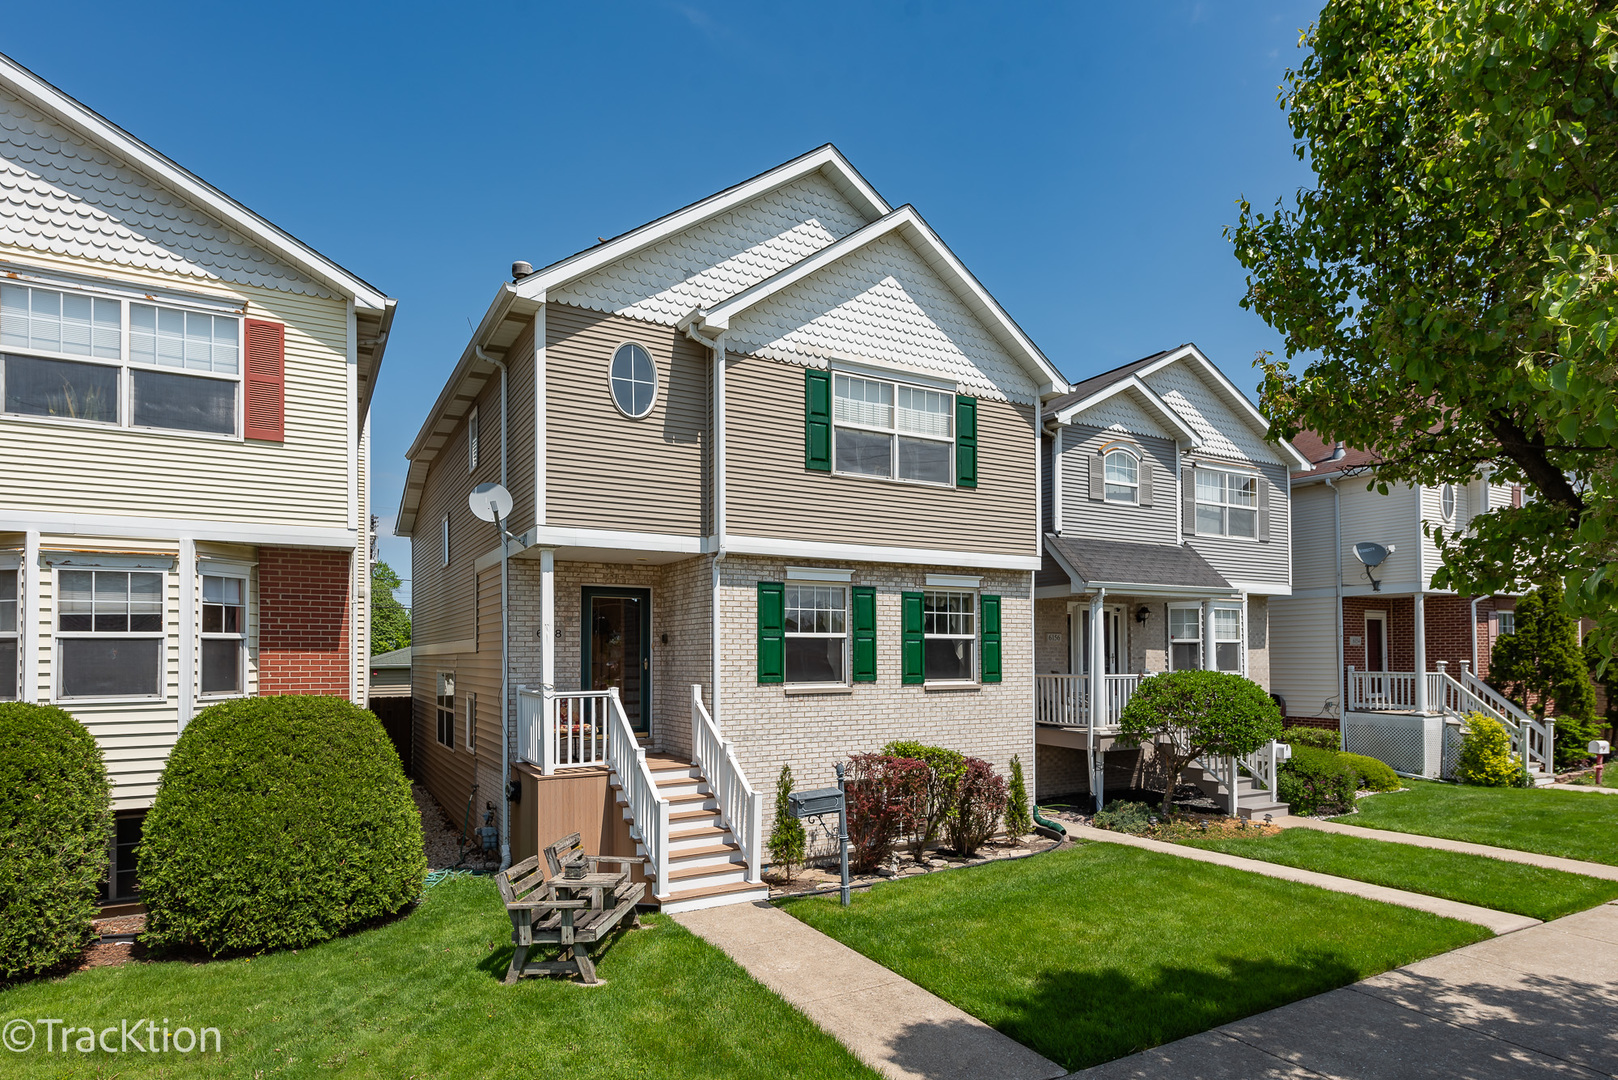
6158 W 60th St, Chicago, IL 60638
$-458
Cash flow
-5.3%
Cash-on-Cash Return
5.1%
Cap rate
0.8%
Rent to Value Ratio
Active
$625,000
2
bds
|
2
ba
|
1,781
sqft
|
built
2005
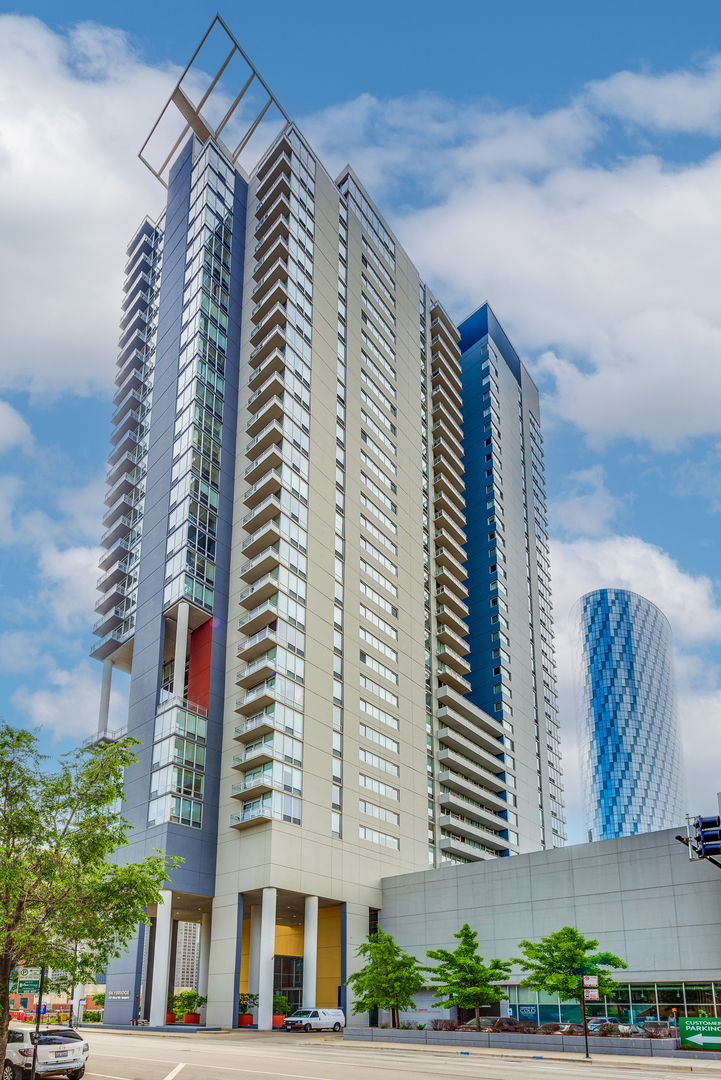
737 W Washington Blvd, Chicago, IL 60661
$-3,375
Cash flow
-28.2%
Cash-on-Cash Return
-0.2%
Cap rate
0.7%
Rent to Value Ratio
Active
$224,500
1
bds
|
1
ba
|
850
sqft
|
built
1962
535 N Michigan Ave, Chicago, IL 60611
$-830
Cash flow
-19.3%
Cash-on-Cash Return
1.8%
Cap rate
1.0%
Rent to Value Ratio
Active
$269,900
5
bds
|
2
ba
|
1,500
sqft
|
built
1918
1132 N Monitor Ave, Chicago, IL 60651
$-136
Cash flow
-2.6%
Cash-on-Cash Return
5.7%
Cap rate
0.8%
Rent to Value Ratio
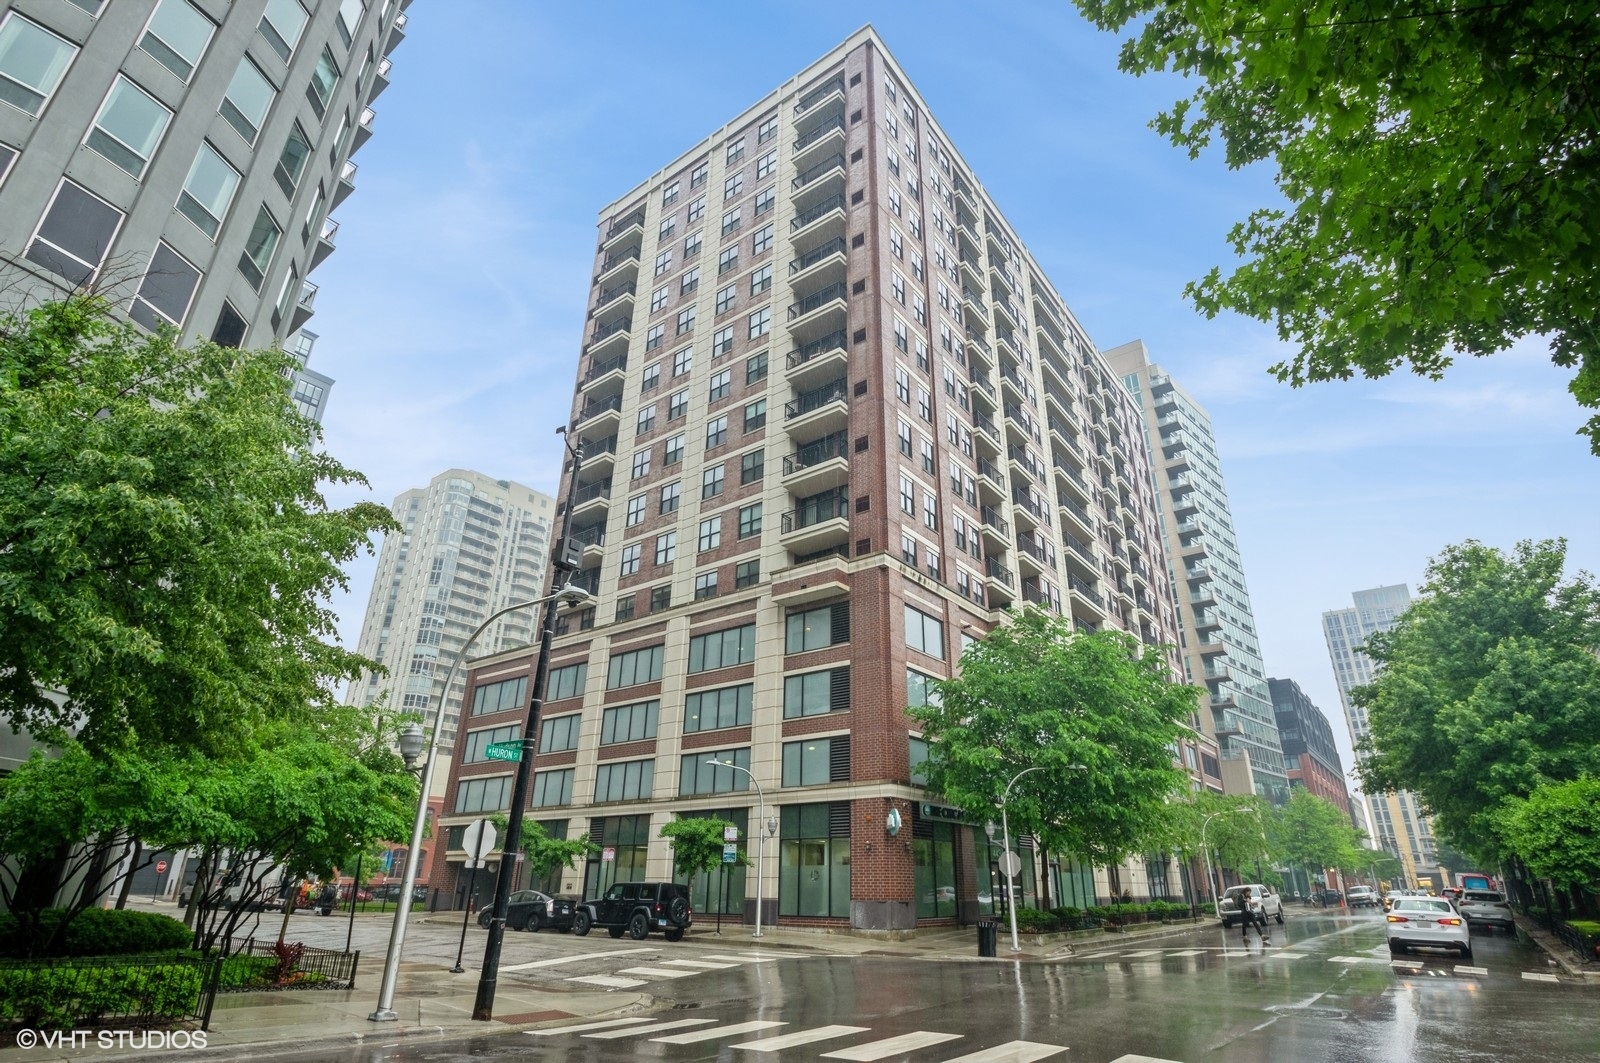
Active
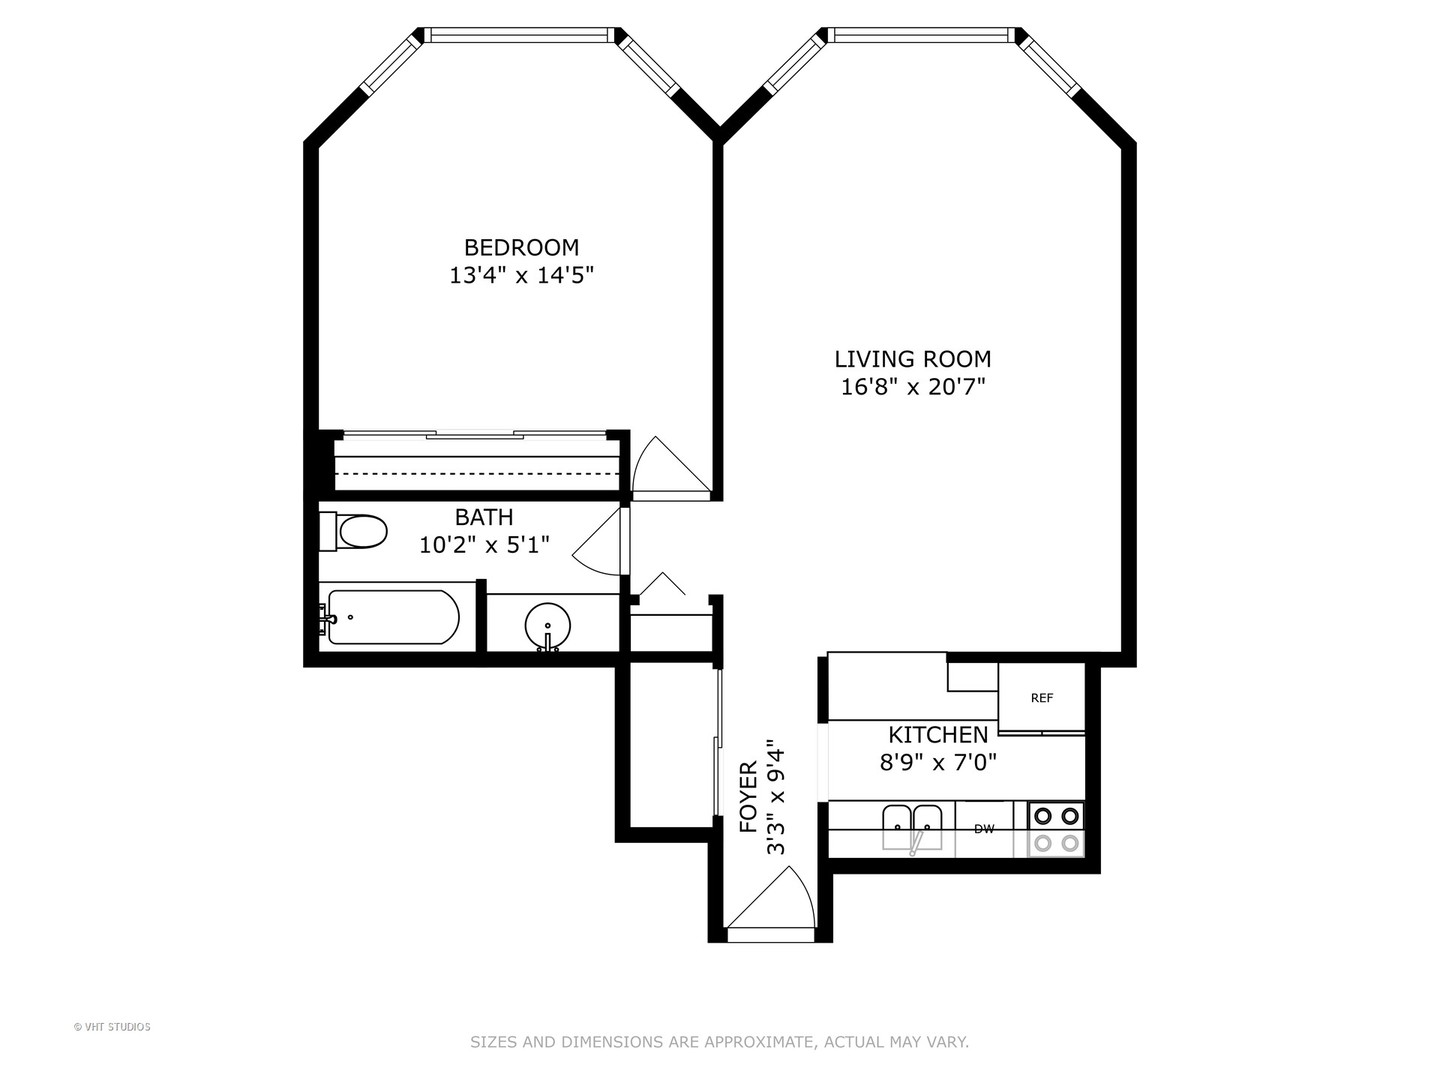
$320,000
1
bds
|
1
ba
|
780
sqft
|
built
2007
451 W Huron St, Chicago, IL 60654
$-917
Cash flow
-15.0%
Cash-on-Cash Return
2.8%
Cap rate
0.8%
Rent to Value Ratio
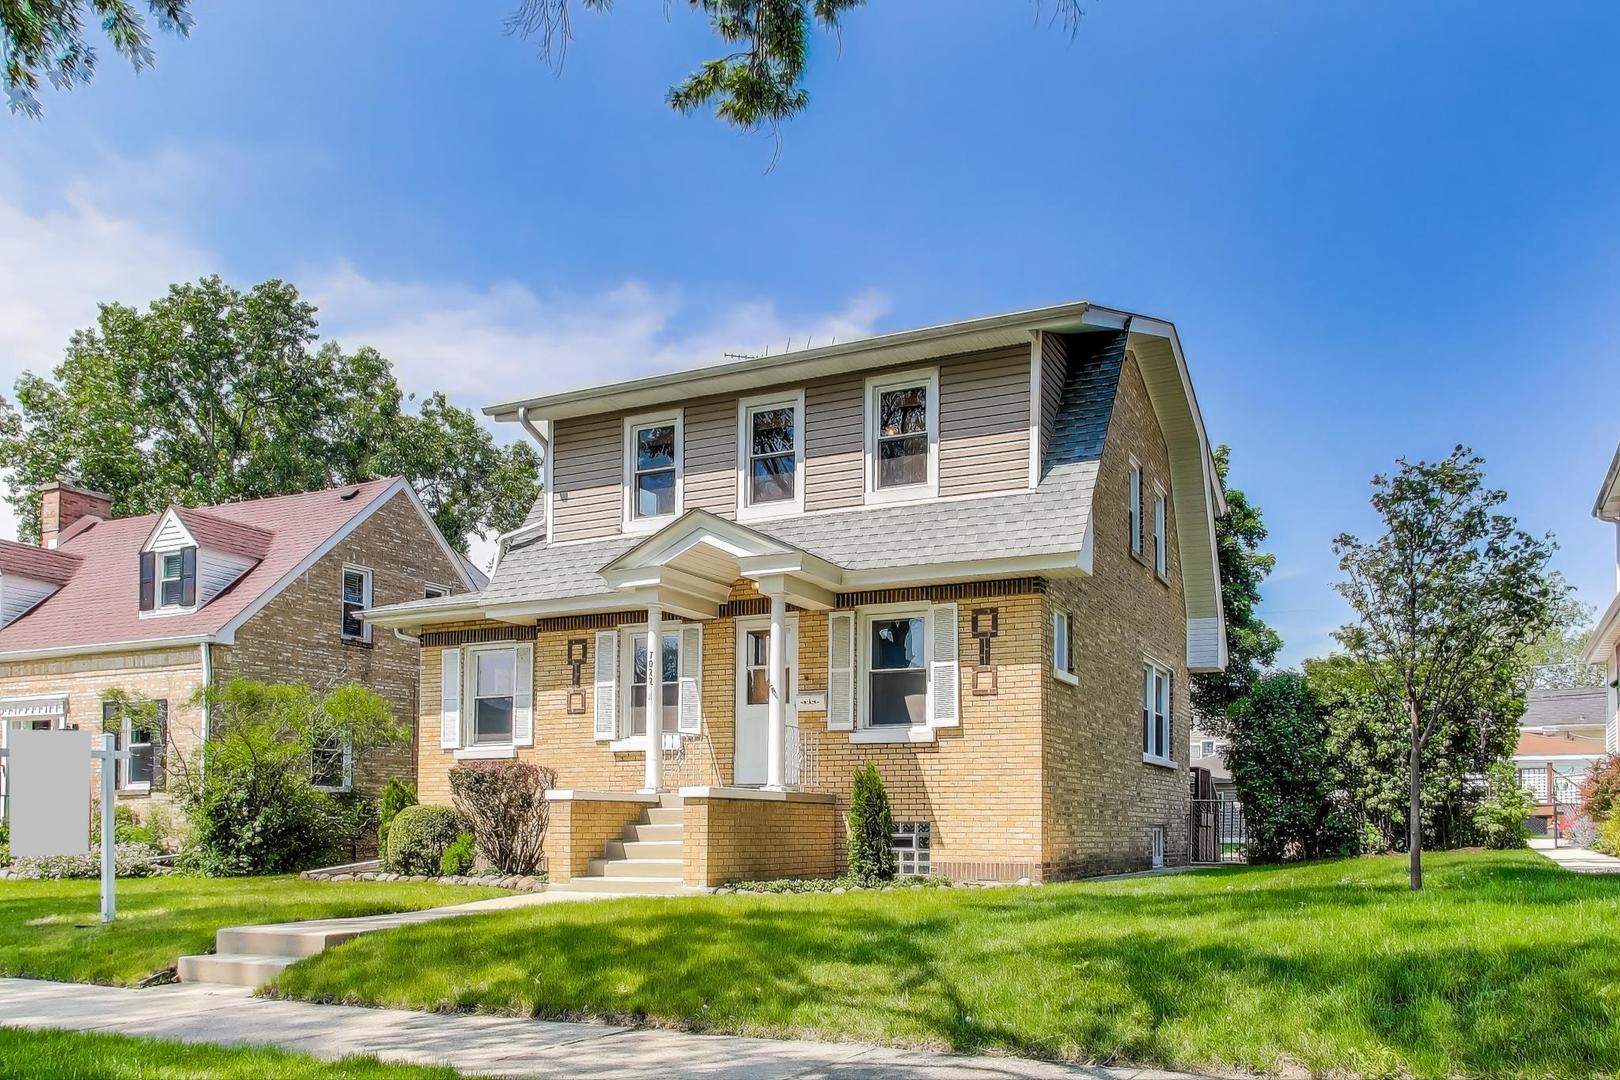
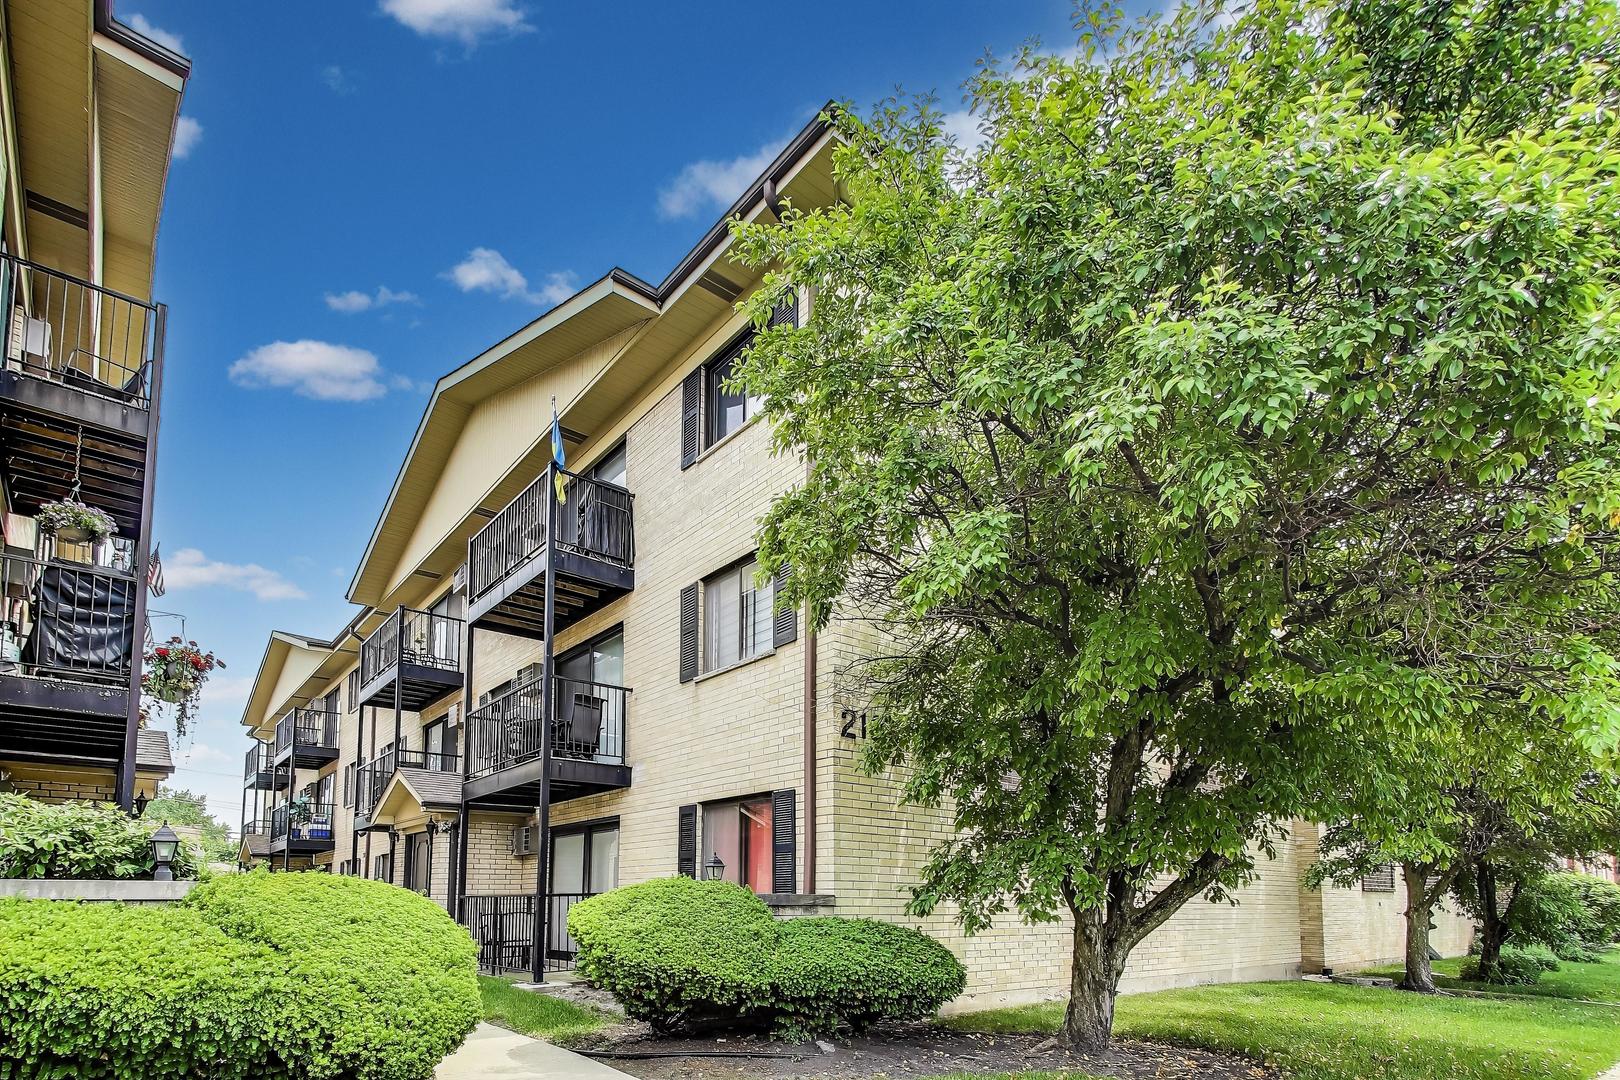
Pending
$575,000
3
bds
|
3
ba
|
0
sqft
|
built
1926
7022 N Olcott Ave, Chicago, IL 60631
$-1,300
Cash flow
-11.8%
Cash-on-Cash Return
3.6%
Cap rate
0.6%
Rent to Value Ratio
Active
$270,000
2
bds
|
2
ba
|
1,200
sqft
|
built
1969
6325 N Sheridan Rd, Chicago, IL 60660
$-902
Cash flow
-17.4%
Cash-on-Cash Return
2.3%
Cap rate
1.0%
Rent to Value Ratio
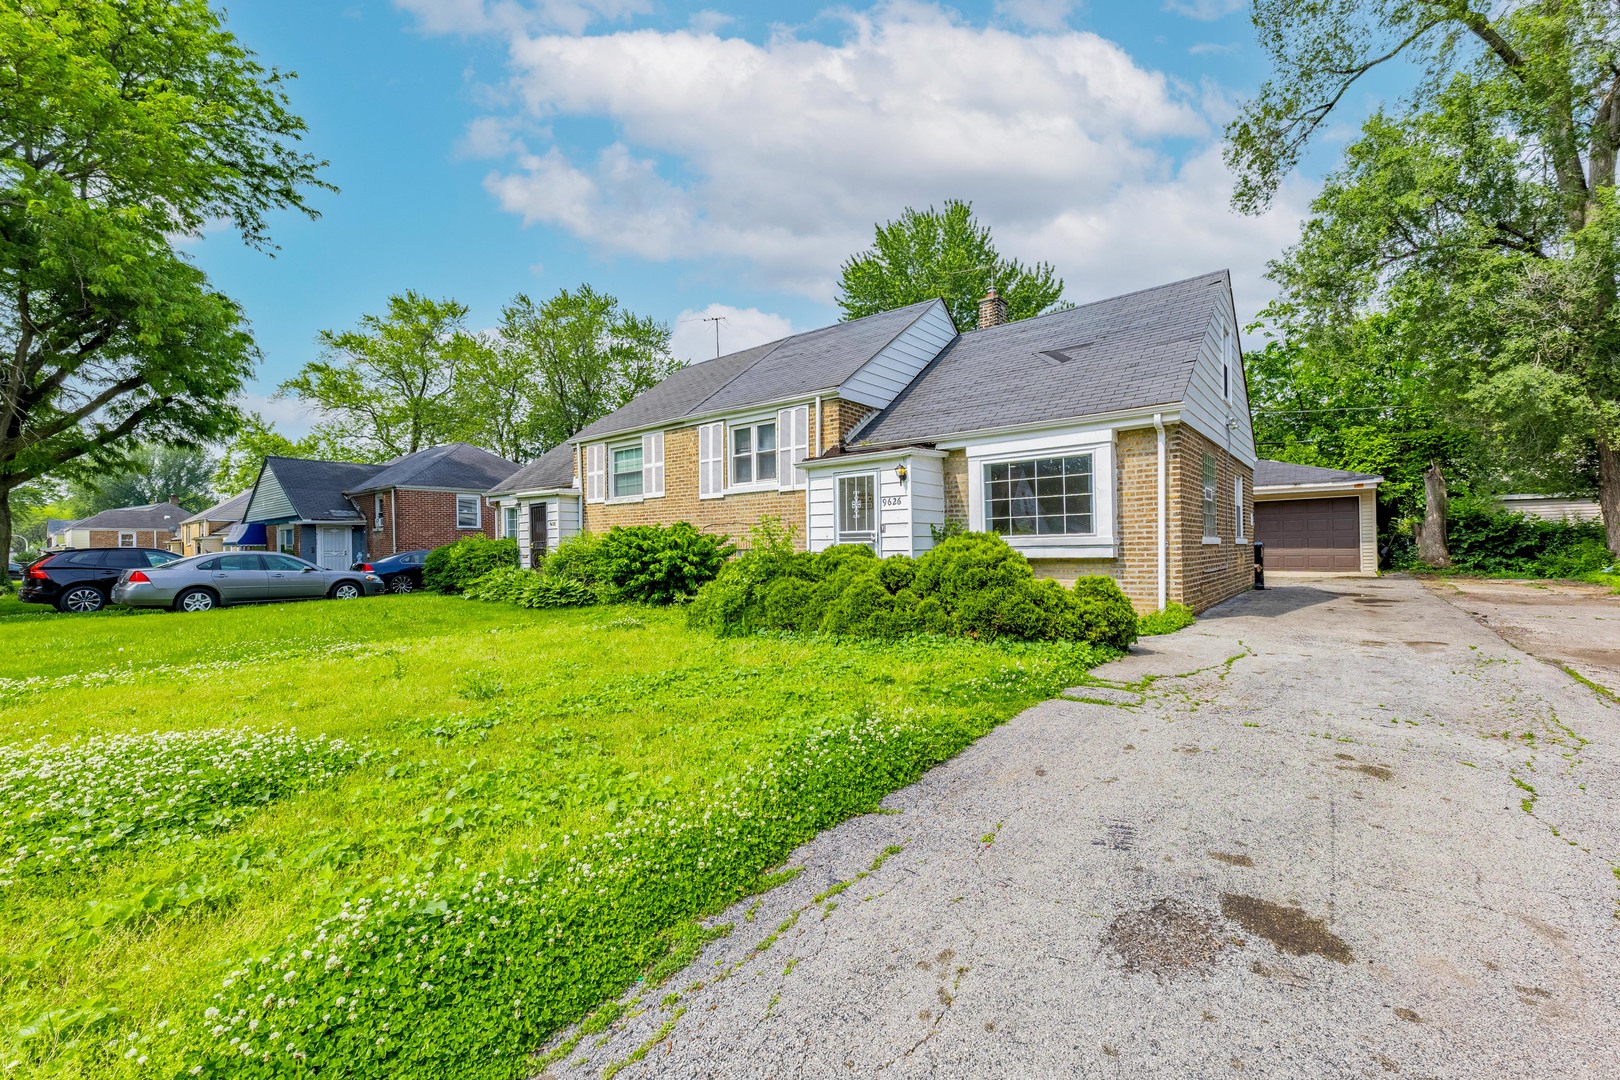
Active
$145,000
3
bds
|
2
ba
|
981
sqft
|
built
1948
9626 S Oglesby Ave, Chicago, IL 60617
$326
Cash flow
11.7%
Cash-on-Cash Return
9.0%
Cap rate
1.2%
Rent to Value Ratio
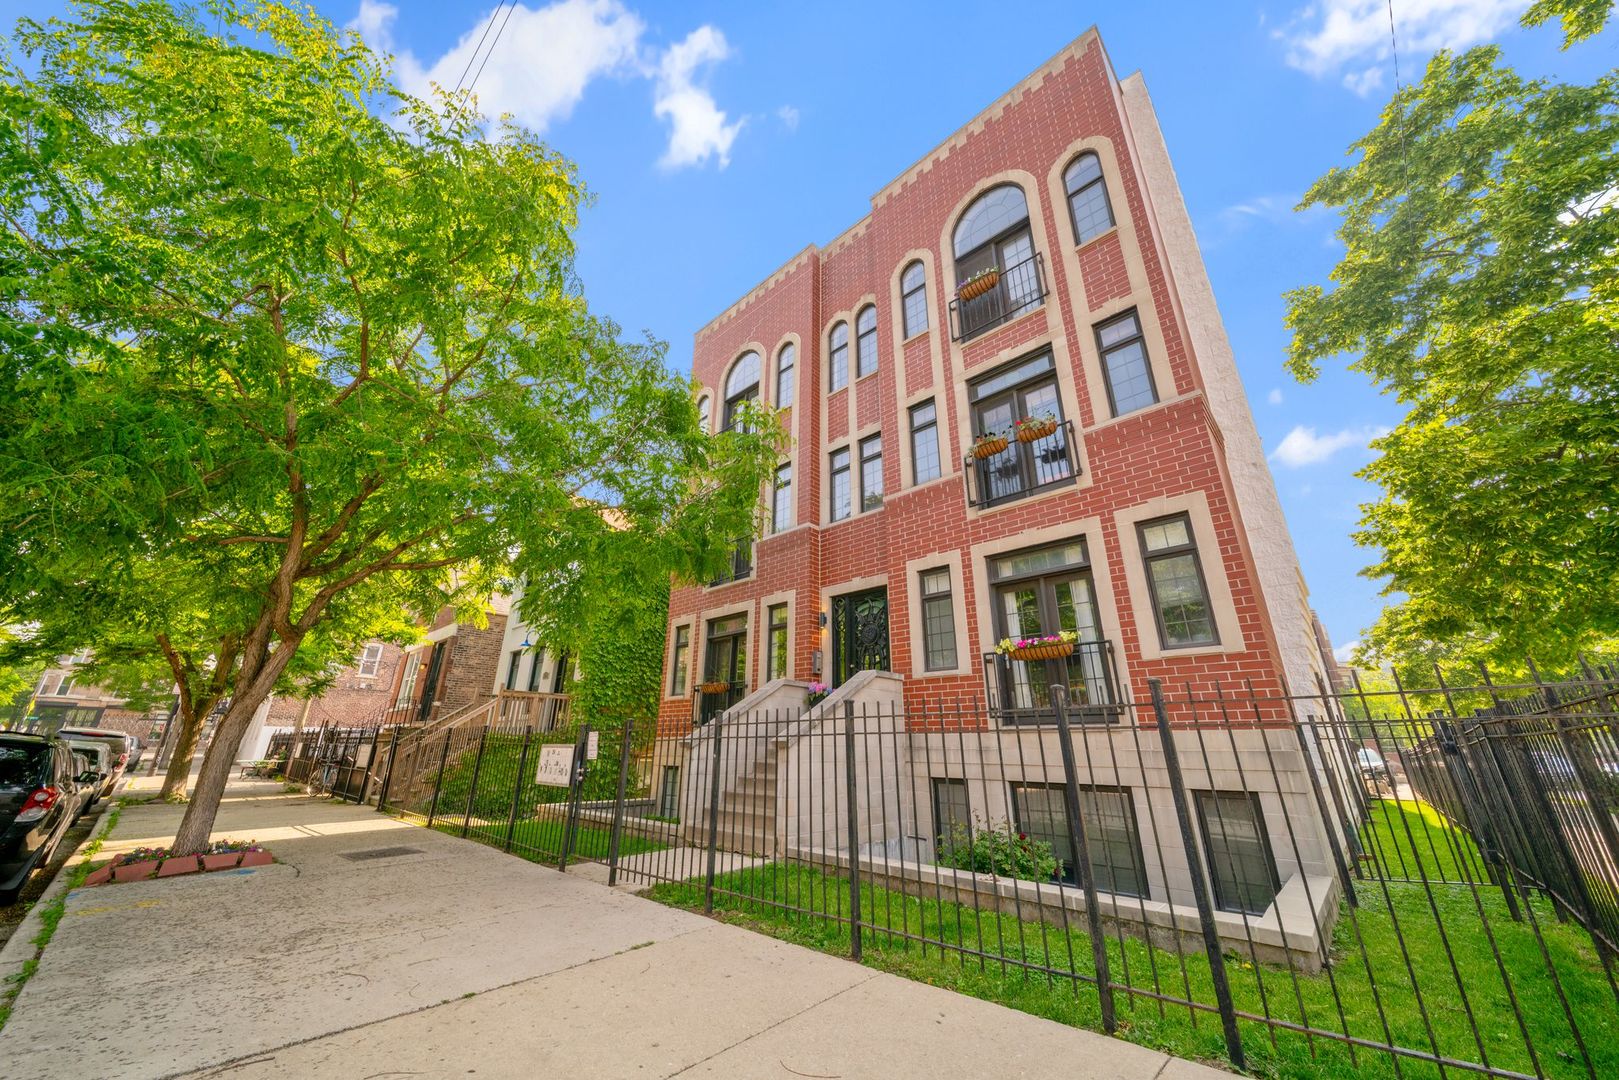
Active
$409,000
2
bds
|
2
ba
|
1,200
sqft
|
built
2005
1704 S Carpenter St, Chicago, IL 60608
$-988
Cash flow
-12.6%
Cash-on-Cash Return
3.4%
Cap rate
0.6%
Rent to Value Ratio
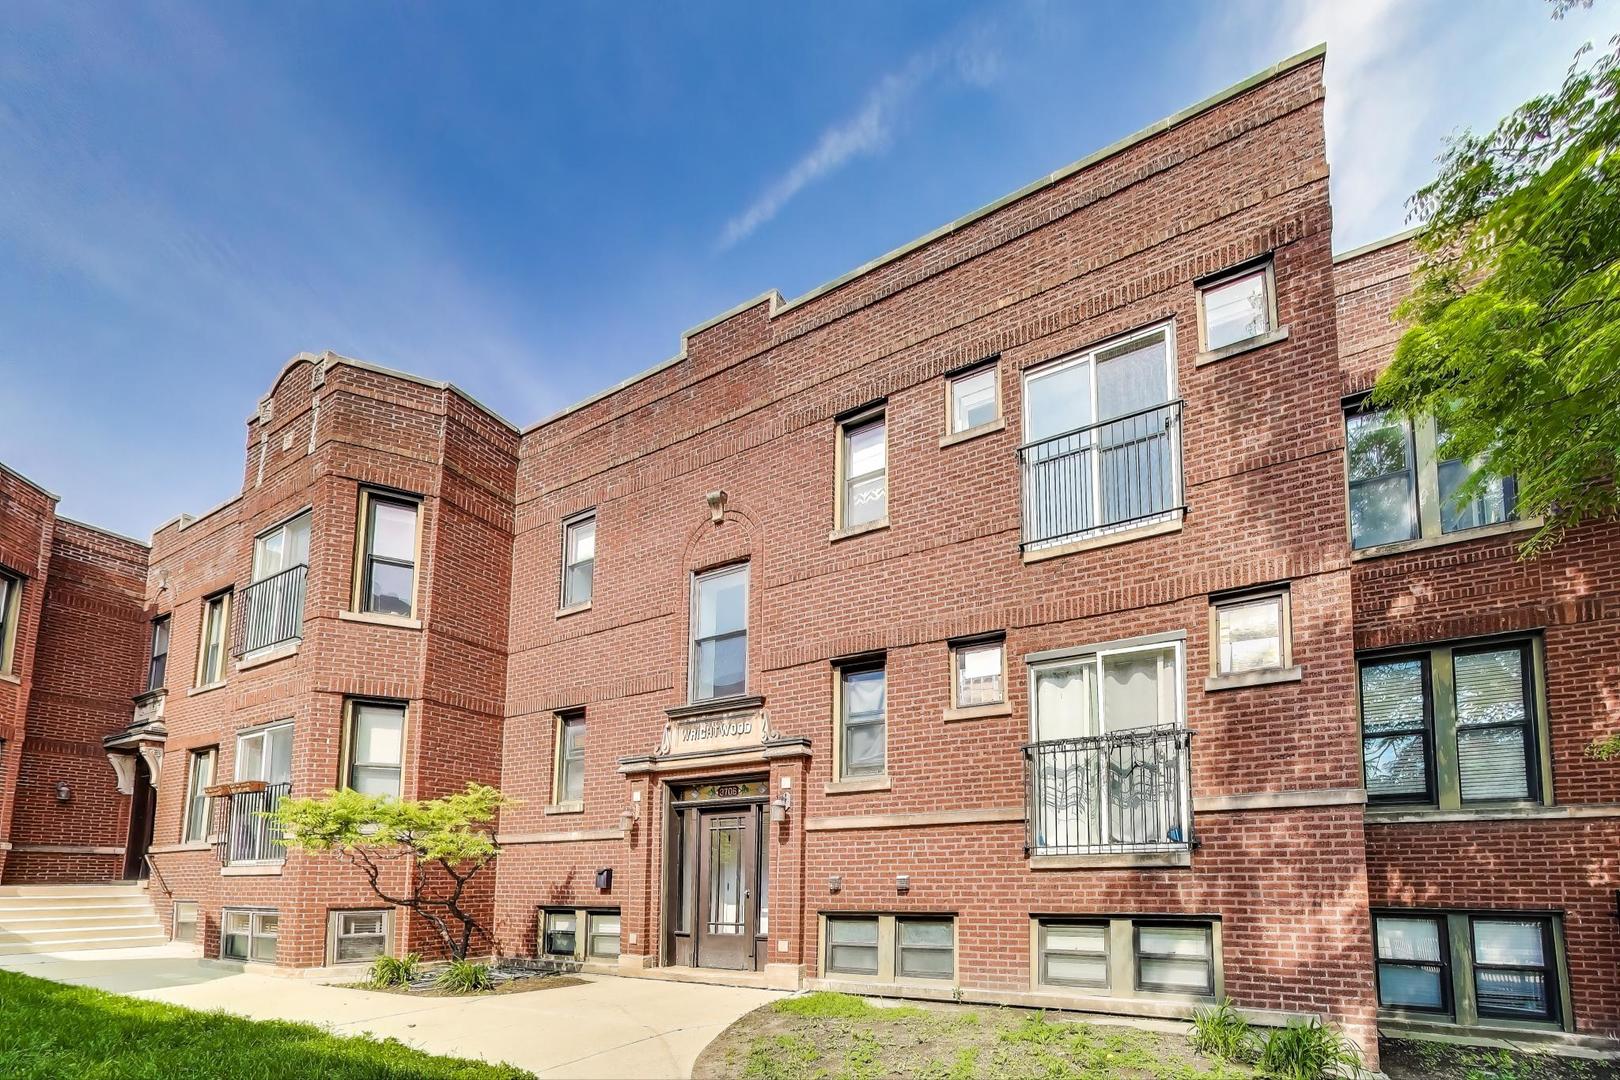
Active under contract
$325,000
2
bds
|
2
ba
|
0
sqft
|
built
1908
3706 W Wrightwood Ave, Chicago, IL 60647
$-759
Cash flow
-12.2%
Cash-on-Cash Return
3.5%
Cap rate
0.7%
Rent to Value Ratio
Active
$349,999
1
bds
|
1
ba
|
0
sqft
|
built
1985
211 E Ohio St, Chicago, IL 60611
$-1,502
Cash flow
-22.4%
Cash-on-Cash Return
1.1%
Cap rate
0.6%
Rent to Value Ratio
Active under contract
$599,000
8
bds
|
4
ba
|
0
sqft
|
built
1890
2816 S Lowe Ave, Chicago, IL 60616
$-1,660
Cash flow
-14.5%
Cash-on-Cash Return
3.0%
Cap rate
0.5%
Rent to Value Ratio
Active
$275,000
1
bds
|
1
ba
|
800
sqft
|
built
1925
1250 W Van Buren St, Chicago, IL 60607
$-244
Cash flow
-4.6%
Cash-on-Cash Return
5.2%
Cap rate
1.0%
Rent to Value Ratio
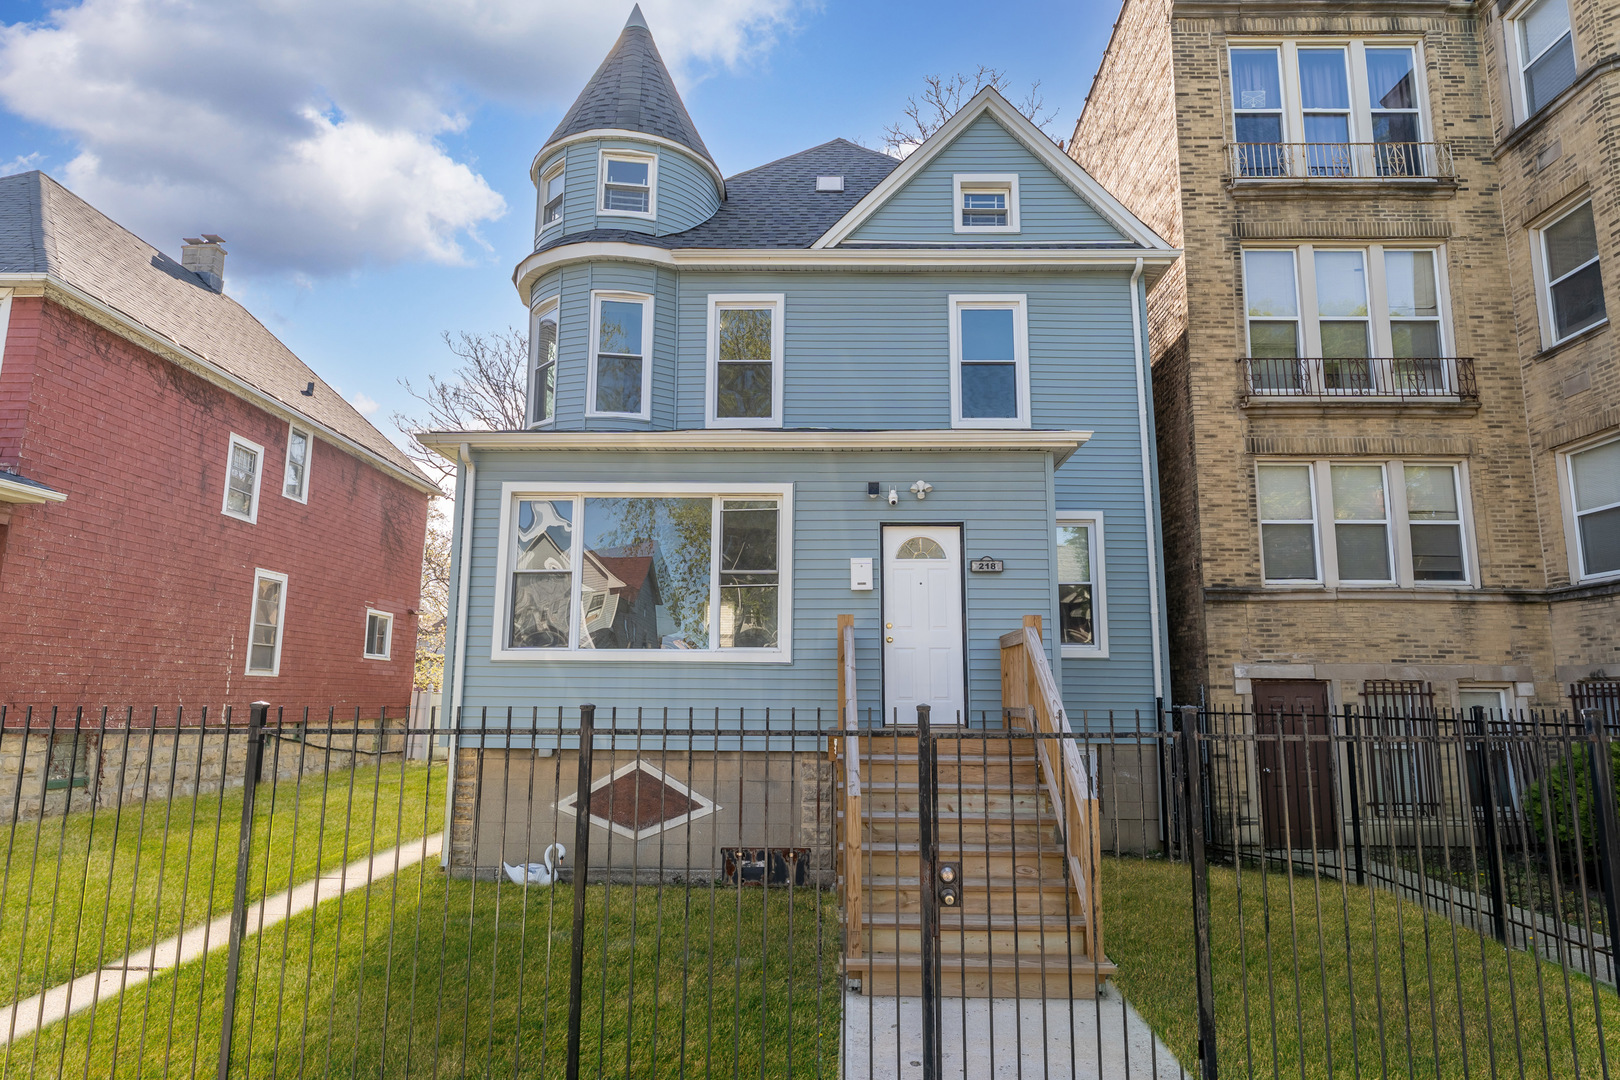
Active
$539,900
4
bds
|
3
ba
|
2,024
sqft
|
built
1895
218 N Mason Ave, Chicago, IL 60644
$-1,348
Cash flow
-13.0%
Cash-on-Cash Return
3.3%
Cap rate
0.5%
Rent to Value Ratio
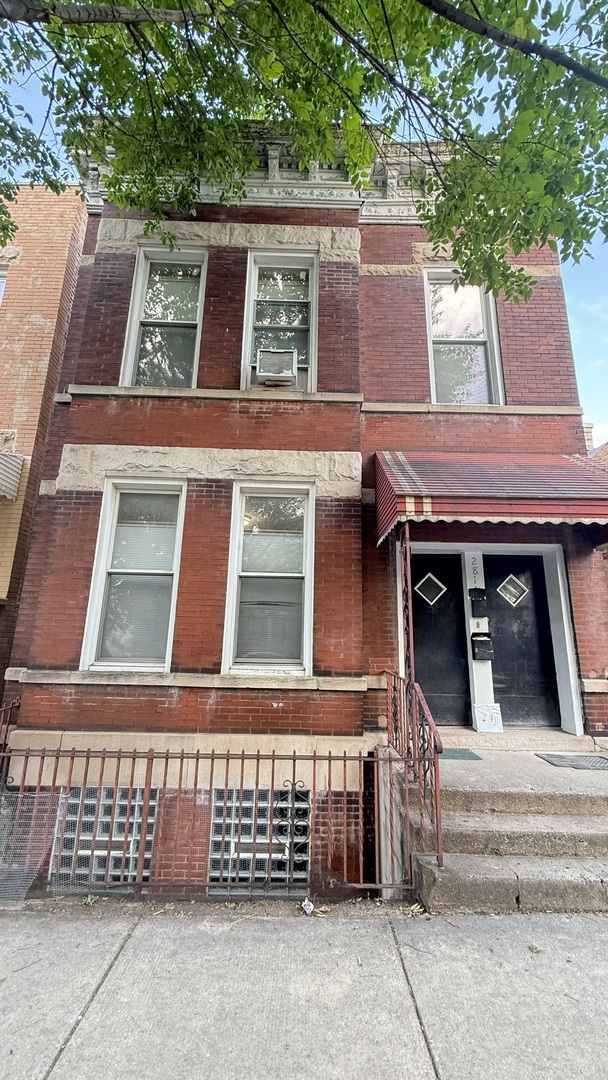
Active
$268,999
4
bds
|
3
ba
|
1,632
sqft
|
built
1893
7421 S Eggleston Ave, Chicago, IL 60621
$-305
Cash flow
-5.9%
Cash-on-Cash Return
4.9%
Cap rate
0.6%
Rent to Value Ratio
Active
$299,000
4
bds
|
2
ba
|
1,120
sqft
|
built
1964
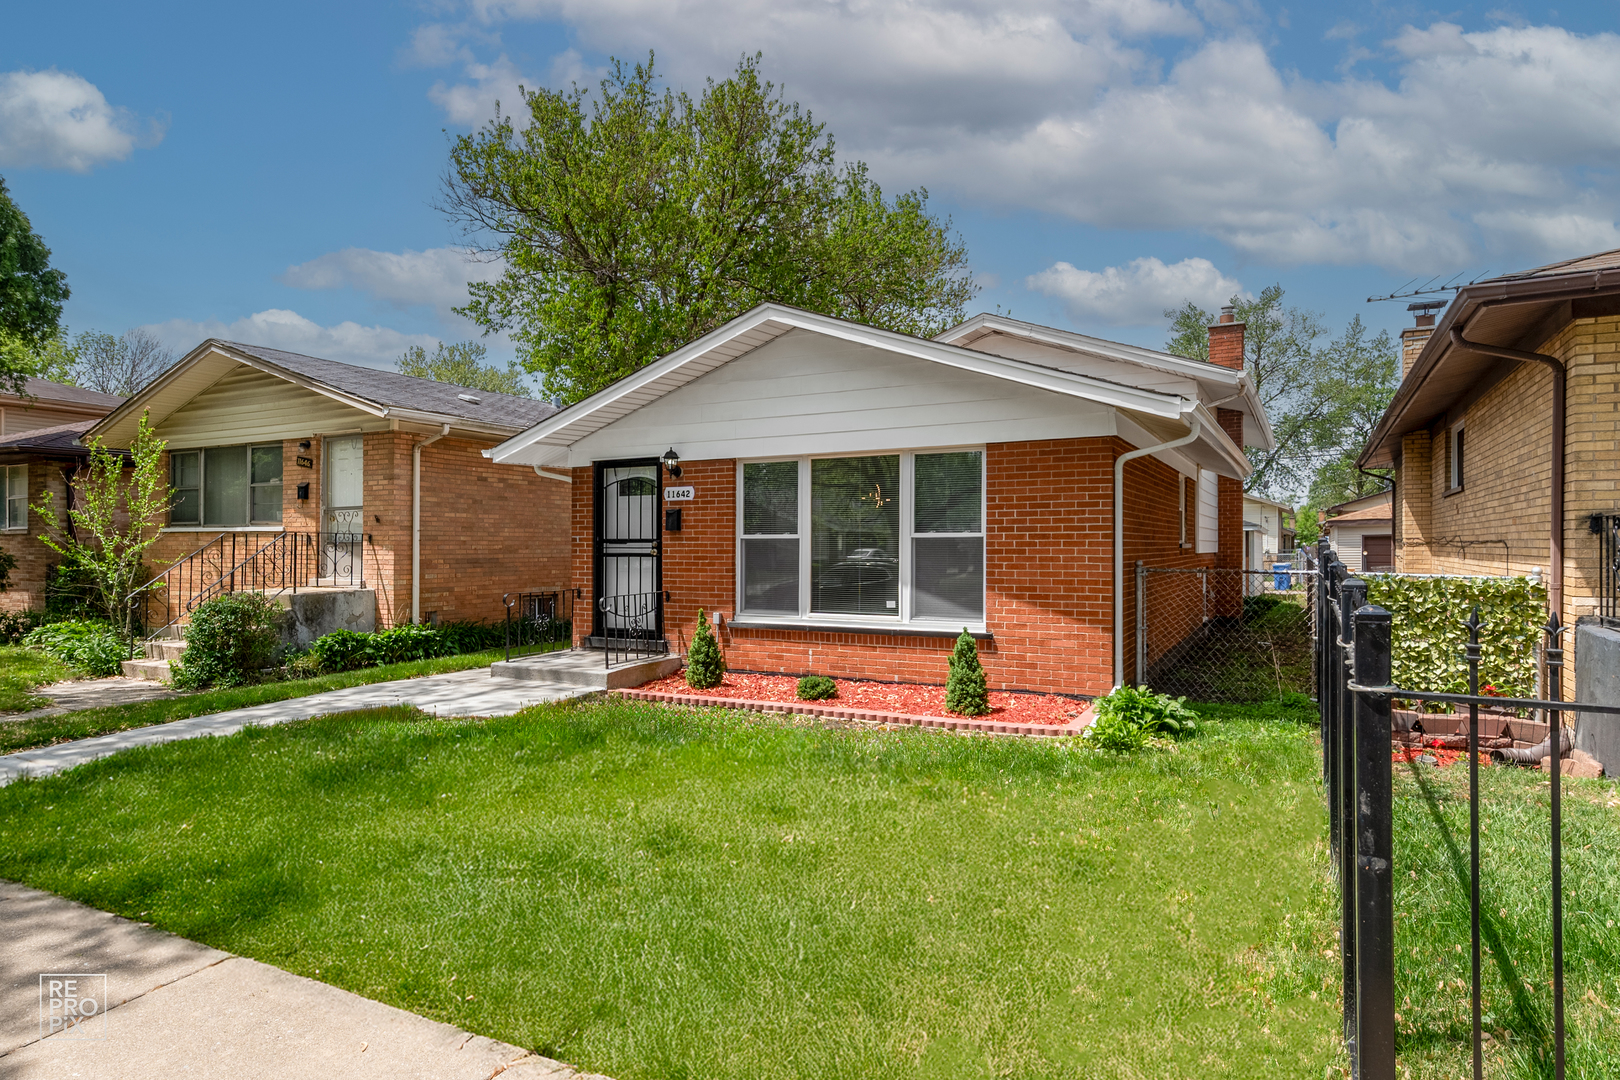
11642 S Elizabeth St, Chicago, IL 60643
$-450
Cash flow
-7.9%
Cash-on-Cash Return
4.5%
Cap rate
0.7%
Rent to Value Ratio
Active
$370,000
2
bds
|
2
ba
|
1,165
sqft
|
built
1927
208 W Washington St, Chicago, IL 60606
$-1,522
Cash flow
-21.5%
Cash-on-Cash Return
1.3%
Cap rate
0.8%
Rent to Value Ratio
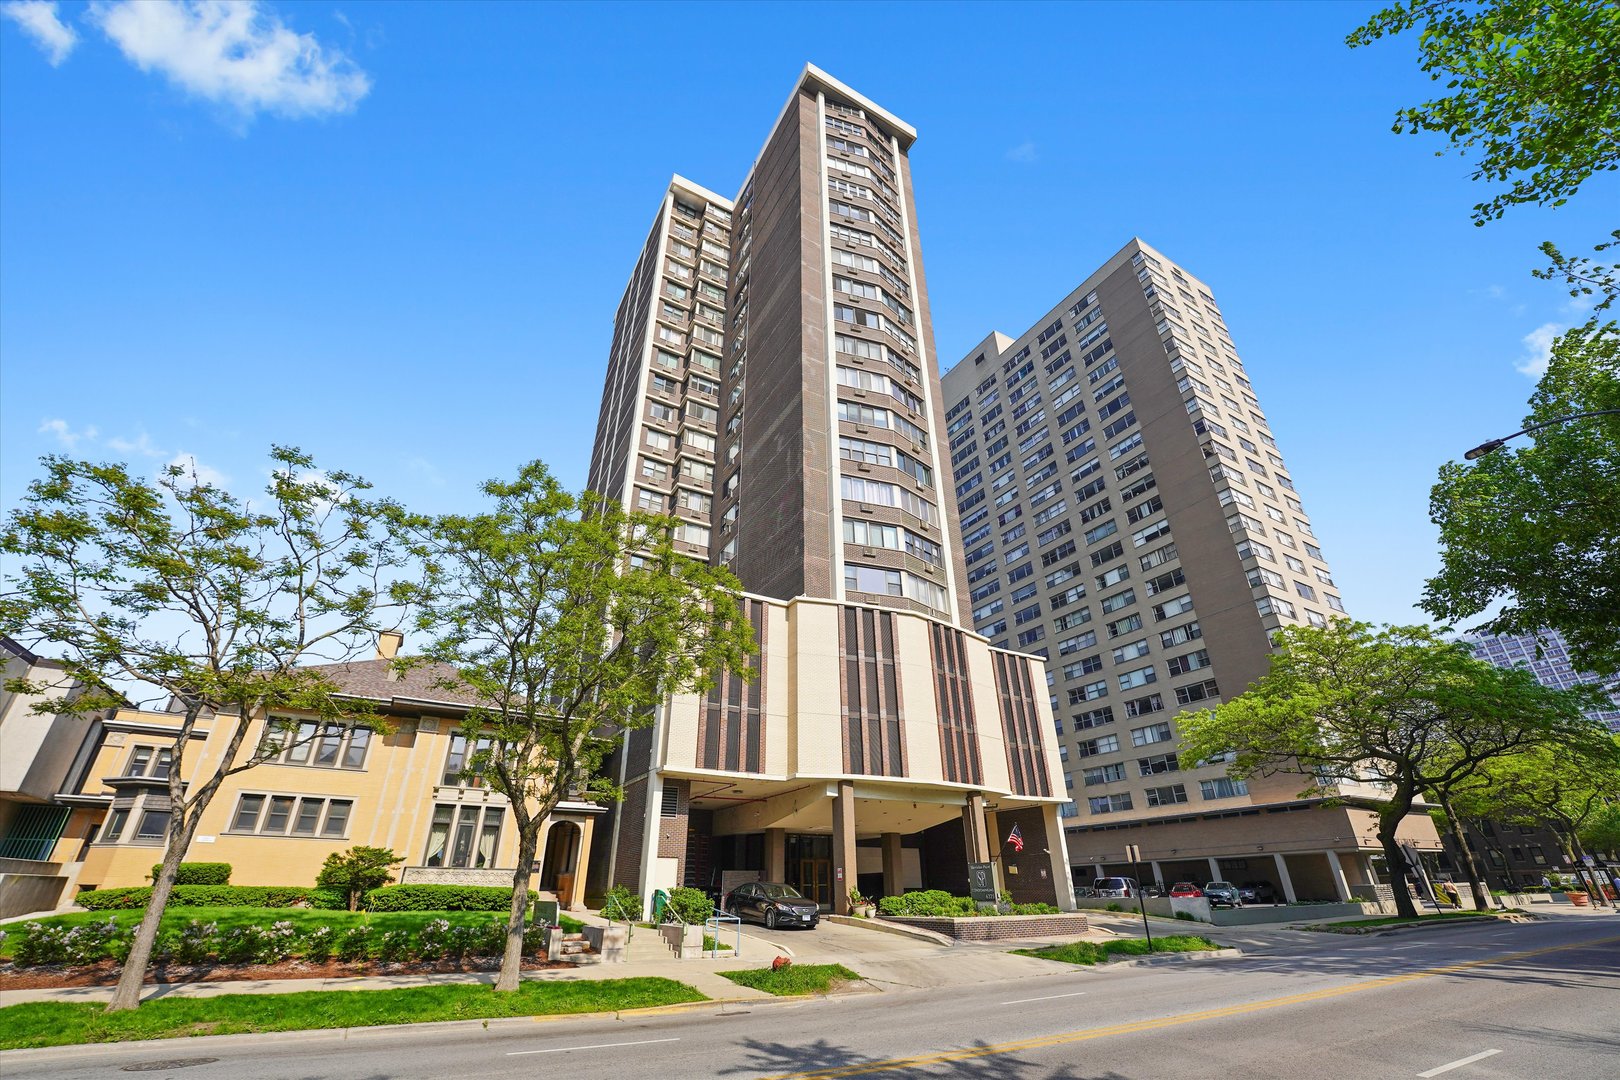
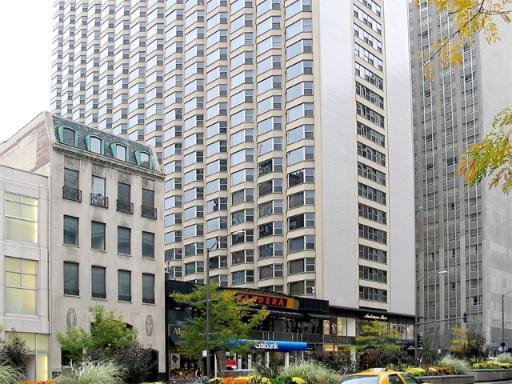
Active
$685,000
2
bds
|
2
ba
|
1,200
sqft
|
built
1971
1030 N State St, Chicago, IL 60610
$-2,532
Cash flow
-19.3%
Cash-on-Cash Return
1.8%
Cap rate
0.6%
Rent to Value Ratio
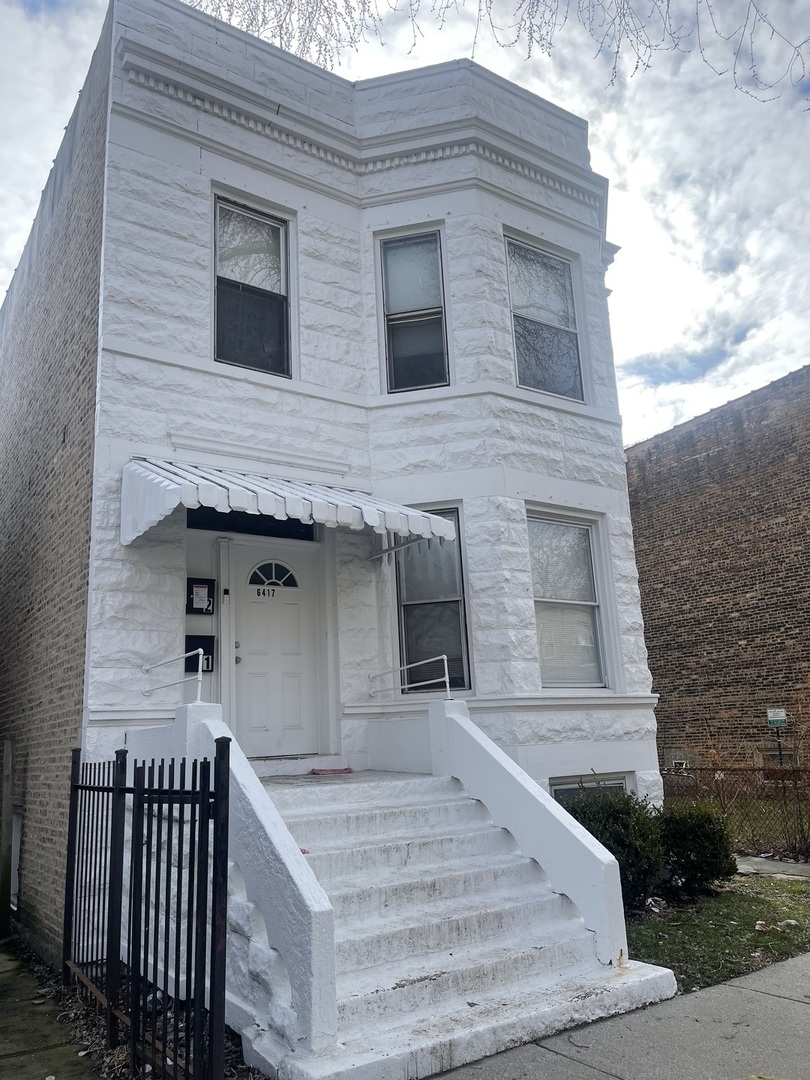
Active
$470,000
7
bds
|
2
ba
|
0
sqft
|
built
1897
6417 S Eberhart Ave, Chicago, IL 60637
$-2,001
Cash flow
-22.2%
Cash-on-Cash Return
1.2%
Cap rate
0.2%
Rent to Value Ratio
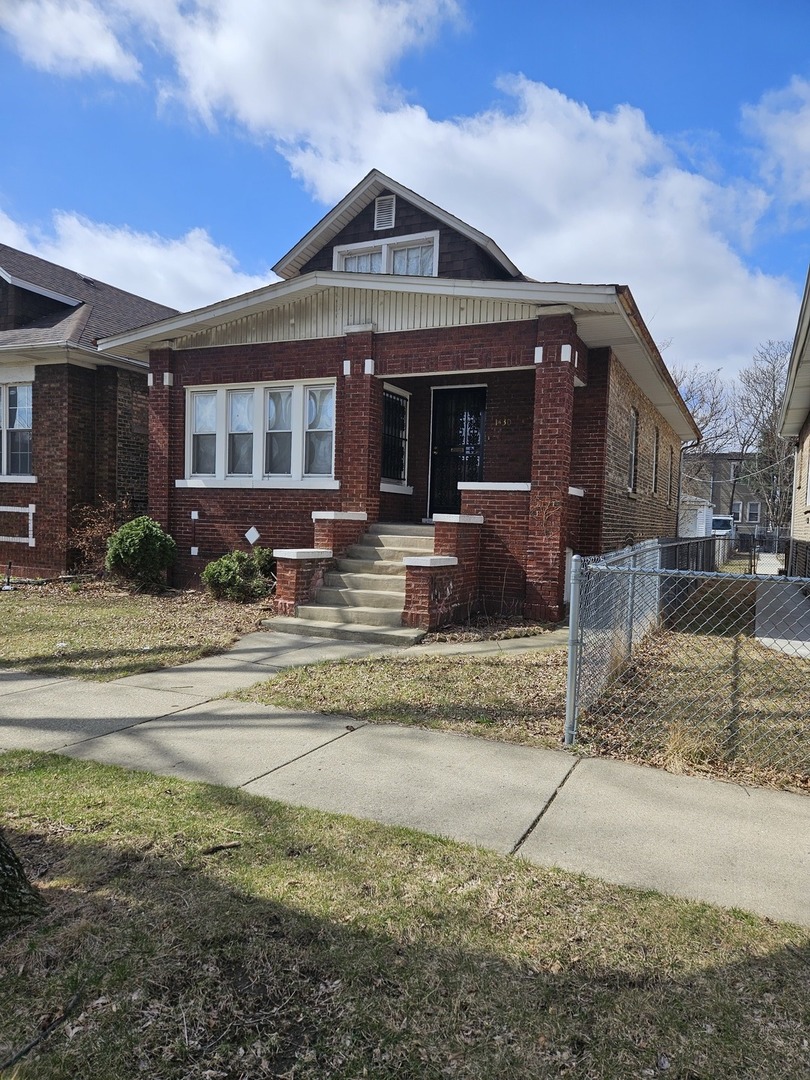
Active under contract
$159,000
4
bds
|
2
ba
|
1,362
sqft
|
built
1923
8525 S Rhodes Ave, Chicago, IL 60619
$353
Cash flow
11.6%
Cash-on-Cash Return
9.0%
Cap rate
1.3%
Rent to Value Ratio
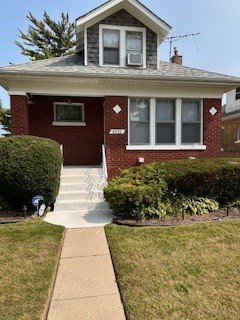
Active
$265,000
2
bds
|
1
ba
|
1,095
sqft
|
built
1919
1430 N Long Ave, Chicago, IL 60651
$-99
Cash flow
-1.9%
Cash-on-Cash Return
5.8%
Cap rate
0.8%
Rent to Value Ratio
Active
$199,000
1
bds
|
1
ba
|
850
sqft
|
built
1962
535 N Michigan Ave, Chicago, IL 60611
$-878
Cash flow
-23.0%
Cash-on-Cash Return
1.0%
Cap rate
1.1%
Rent to Value Ratio
Active under contract
$210,000
2
bds
|
1
ba
|
1,000
sqft
|
built
1980
2131 N Harlem Ave, Chicago, IL 60707
$-186
Cash flow
-4.6%
Cash-on-Cash Return
5.2%
Cap rate
1.0%
Rent to Value Ratio
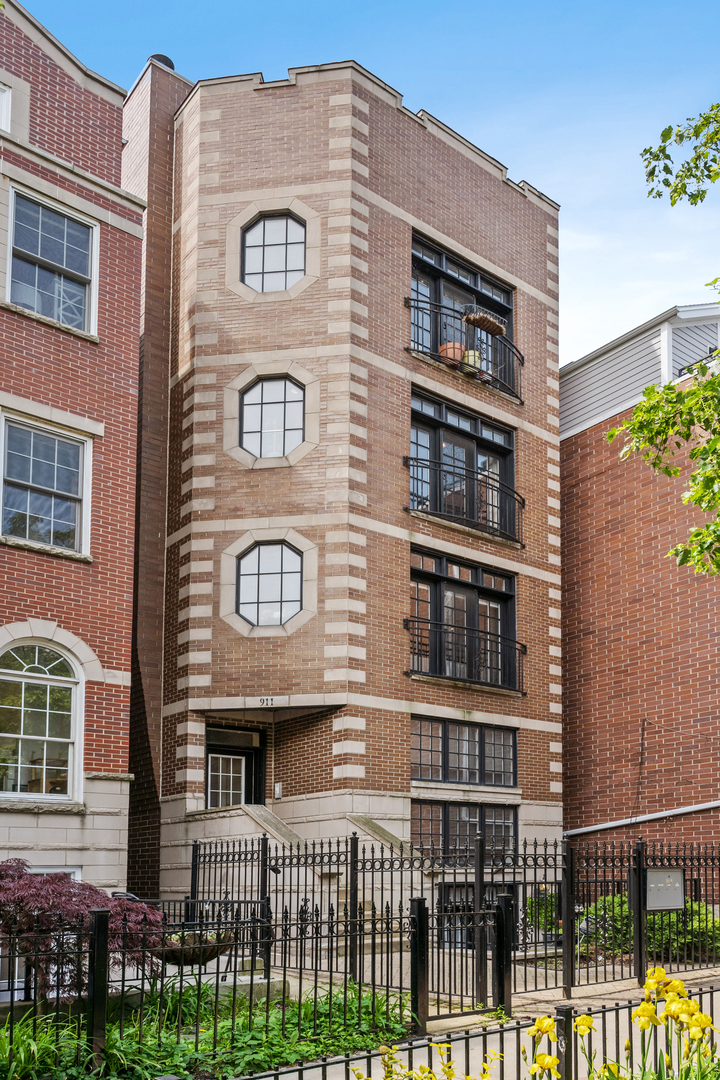
Active under contract
$569,000
2
bds
|
2
ba
|
0
sqft
|
built
2004
911 W Roscoe St, Chicago, IL 60657
$-1,265
Cash flow
-11.6%
Cash-on-Cash Return
3.6%
Cap rate
0.7%
Rent to Value Ratio
Active
$405,000
3
bds
|
2
ba
|
1,020
sqft
|
built
1952
2925 N Nagle Ave, Chicago, IL 60634
$-451
Cash flow
-5.8%
Cash-on-Cash Return
4.9%
Cap rate
0.8%
Rent to Value Ratio
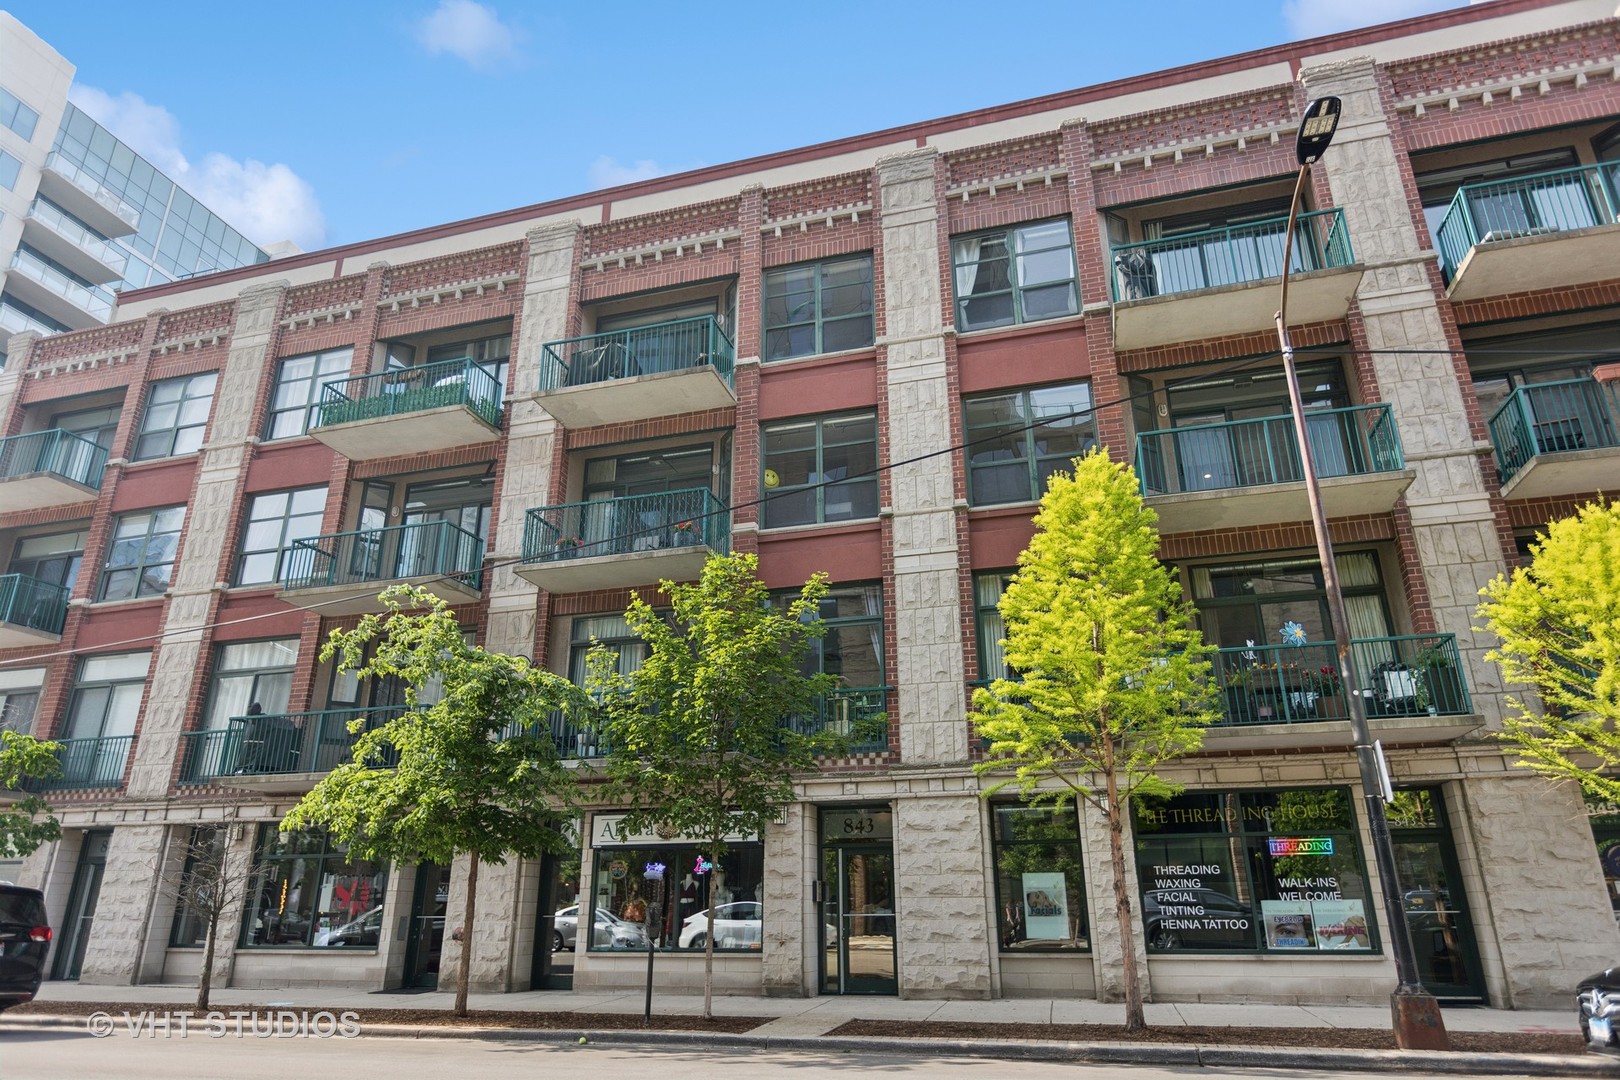
Active
$750,000
2
bds
|
2
ba
|
1,600
sqft
|
built
2001
843 W Monroe St, Chicago, IL 60607
$-2,743
Cash flow
-19.1%
Cash-on-Cash Return
1.9%
Cap rate
0.5%
Rent to Value Ratio
Active under contract
$225,000
1
bds
|
1
ba
|
0
sqft
|
built
2005
659 W Randolph St, Chicago, IL 60661
$-570
Cash flow
-13.2%
Cash-on-Cash Return
3.2%
Cap rate
1.0%
Rent to Value Ratio
Active
$375,000
3
bds
|
2
ba
|
1,121
sqft
|
built
1954
2743 W 83rd St, Chicago, IL 60652
$-708
Cash flow
-9.9%
Cash-on-Cash Return
4.0%
Cap rate
0.5%
Rent to Value Ratio
Active under contract
$499,900
7
bds
|
4
ba
|
0
sqft
|
built
1909
6023 S Michigan Ave, Chicago, IL 60637
$-1,308
Cash flow
-13.7%
Cash-on-Cash Return
3.1%
Cap rate
0.5%
Rent to Value Ratio
Active
$179,900
6
bds
|
2
ba
|
1,713
sqft
|
built
1912
7807 S Burnham Ave, Chicago, IL 60649
$314
Cash flow
9.1%
Cash-on-Cash Return
8.4%
Cap rate
1.1%
Rent to Value Ratio
Active
$115,000
3
bds
|
2
ba
|
1,200
sqft
|
built
1920
3816 S King Dr, Chicago, IL 60653
$832
Cash flow
37.7%
Cash-on-Cash Return
15.0%
Cap rate
2.3%
Rent to Value Ratio
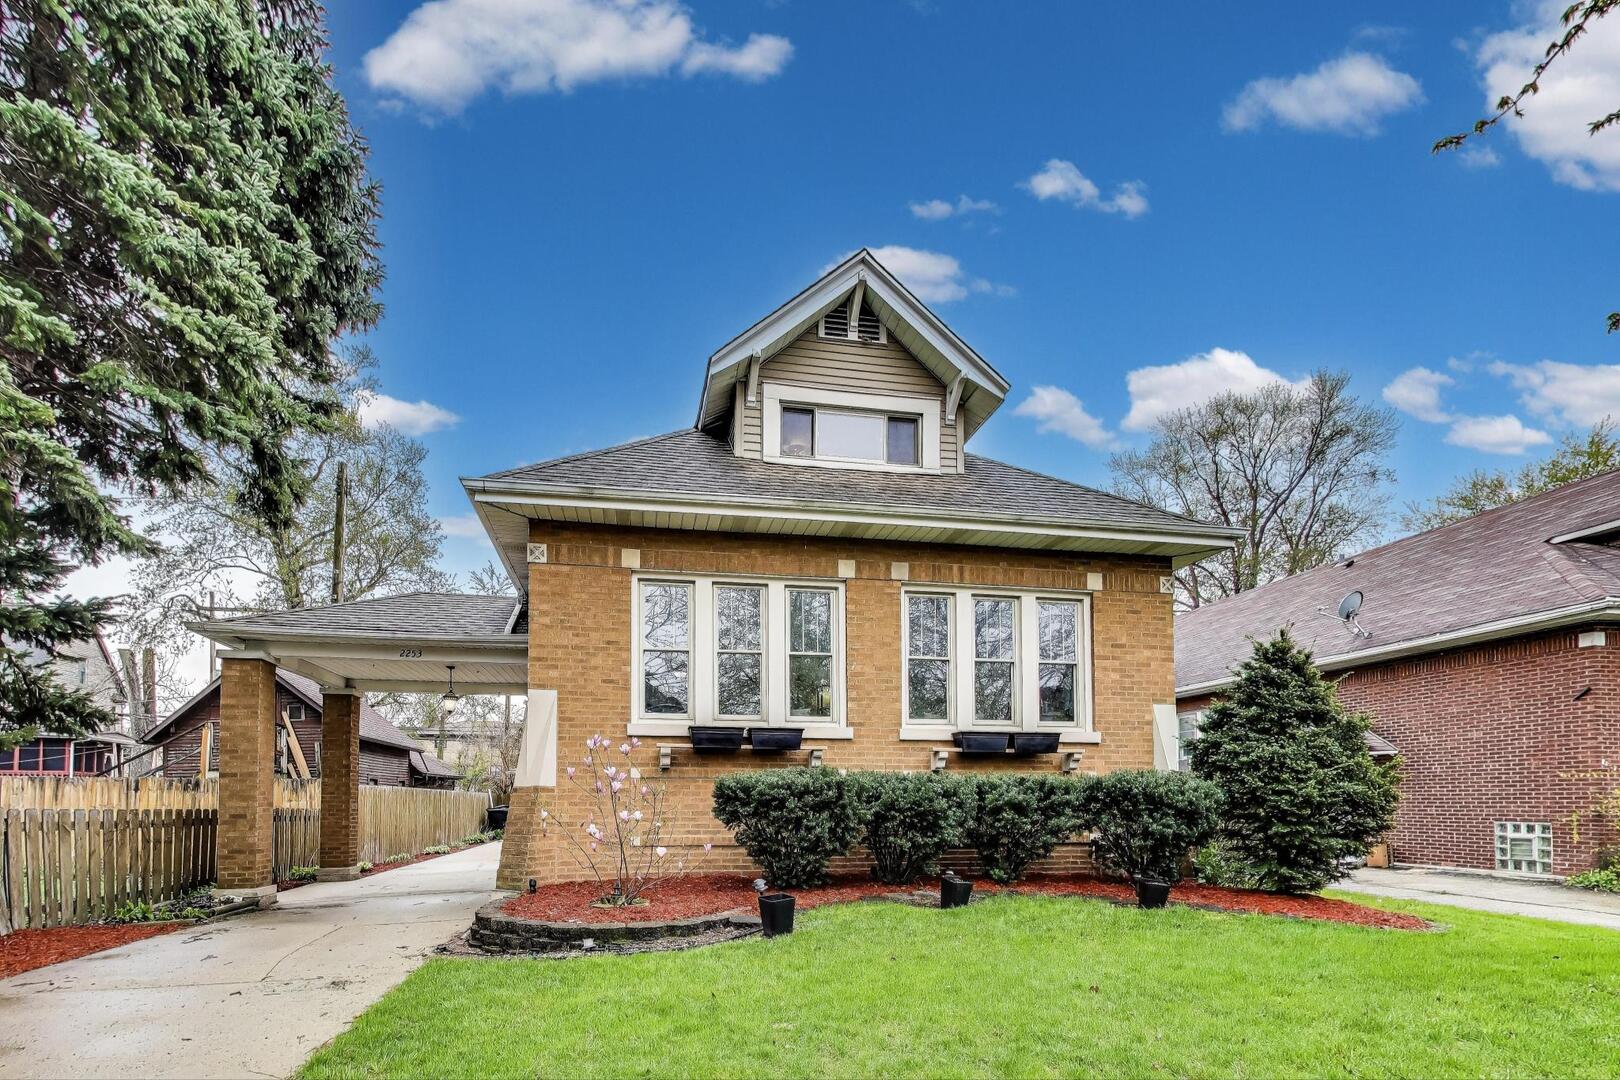
Active
$389,900
3
bds
|
2
ba
|
2,108
sqft
|
built
1926
2253 W 110th Pl, Chicago, IL 60643
$-72
Cash flow
-1.0%
Cash-on-Cash Return
6.1%
Cap rate
0.9%
Rent to Value Ratio
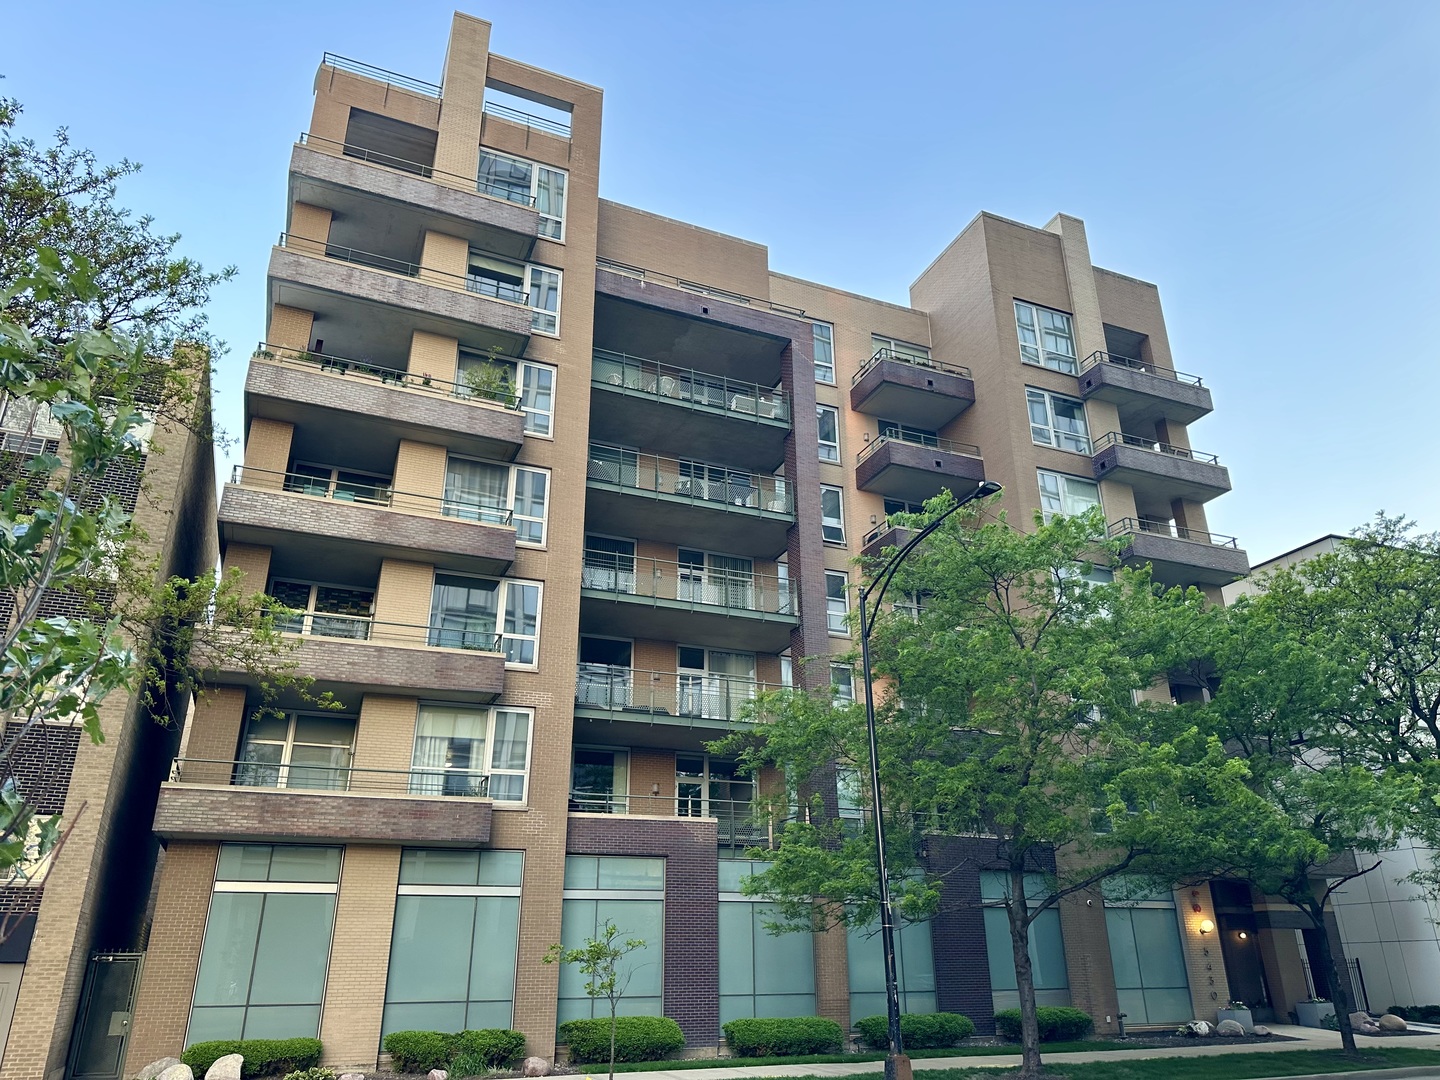
Active
$425,000
2
bds
|
2
ba
|
1,250
sqft
|
built
2007
5430 N Sheridan Rd, Chicago, IL 60640
$-1,338
Cash flow
-16.4%
Cash-on-Cash Return
2.5%
Cap rate
0.7%
Rent to Value Ratio
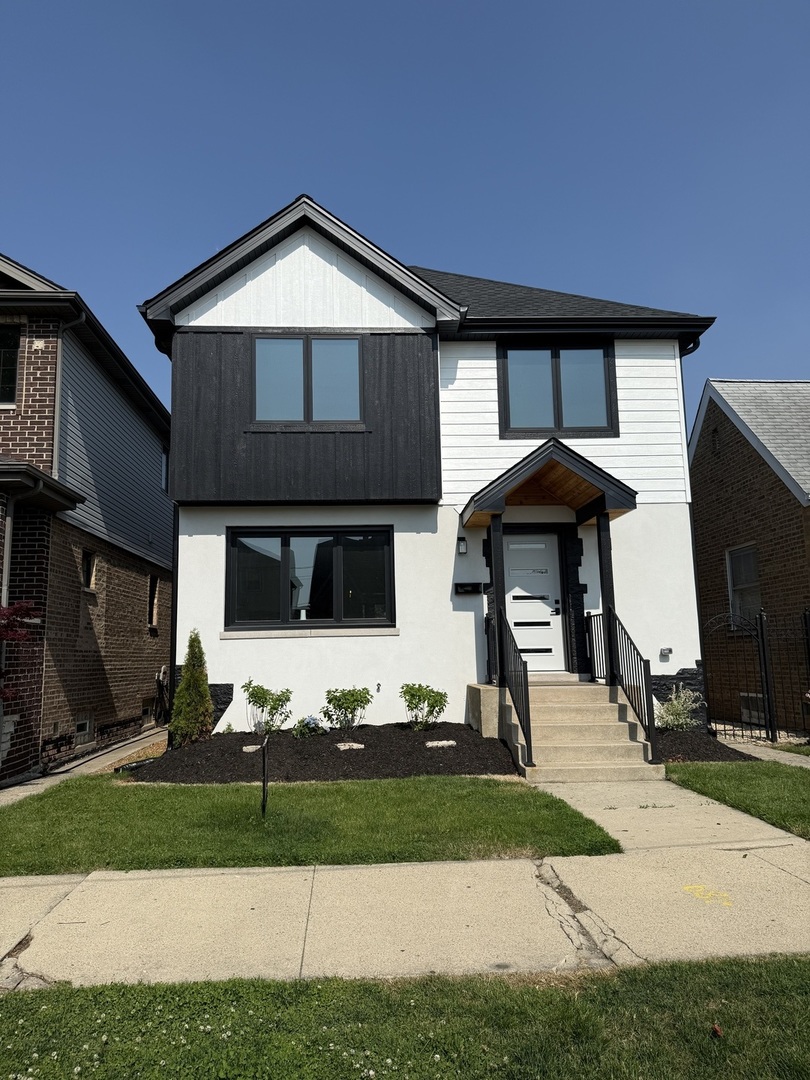
Active
$644,750
3
bds
|
4
ba
|
2,688
sqft
|
built
1940
5443 S Rutherford Ave, Chicago, IL 60638
$-2,196
Cash flow
-17.8%
Cash-on-Cash Return
2.2%
Cap rate
0.4%
Rent to Value Ratio
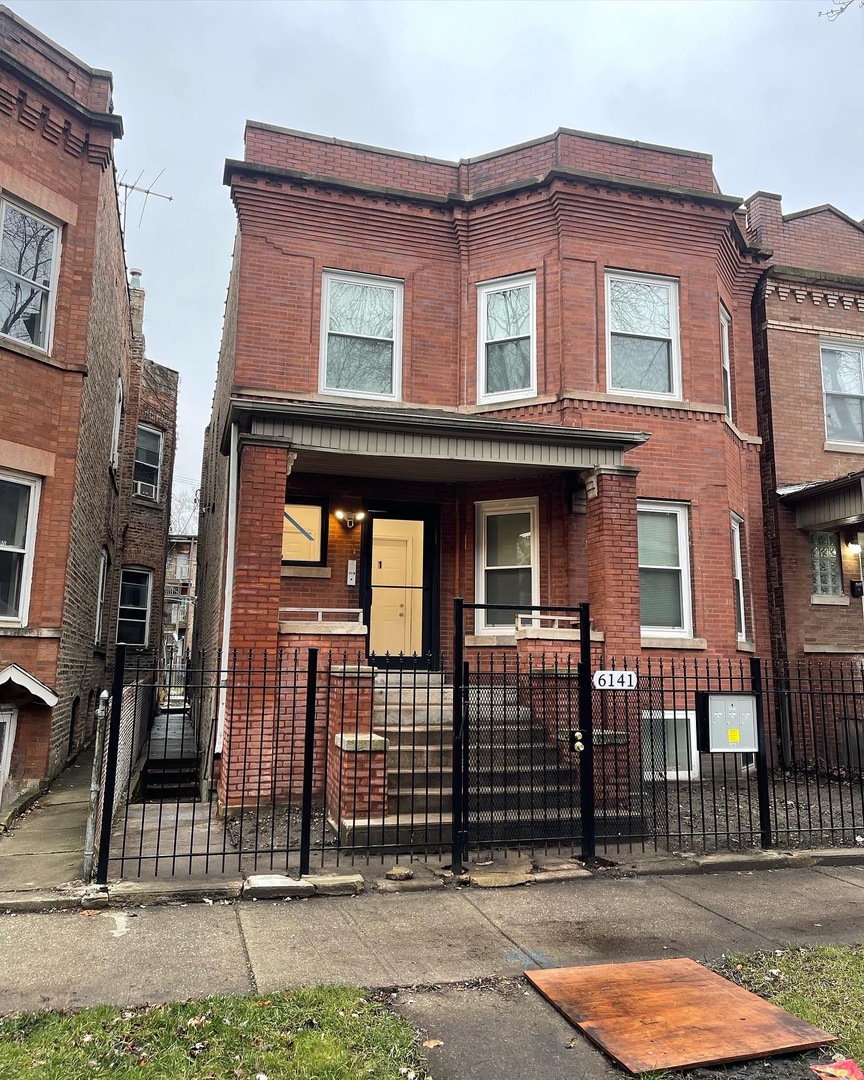
Active
$640,000
9
bds
|
3
ba
|
0
sqft
|
built
1910
6141 S Eberhart Ave, Chicago, IL 60637
$-2,254
Cash flow
-18.4%
Cash-on-Cash Return
2.1%
Cap rate
0.3%
Rent to Value Ratio