Chicago, IL Investment Properties for Sale
Browse homes for sale and investment properties in Chicago, IL. Refine your search by price, property type, or more.
Best cash flowing properties in Chicago, IL
Active
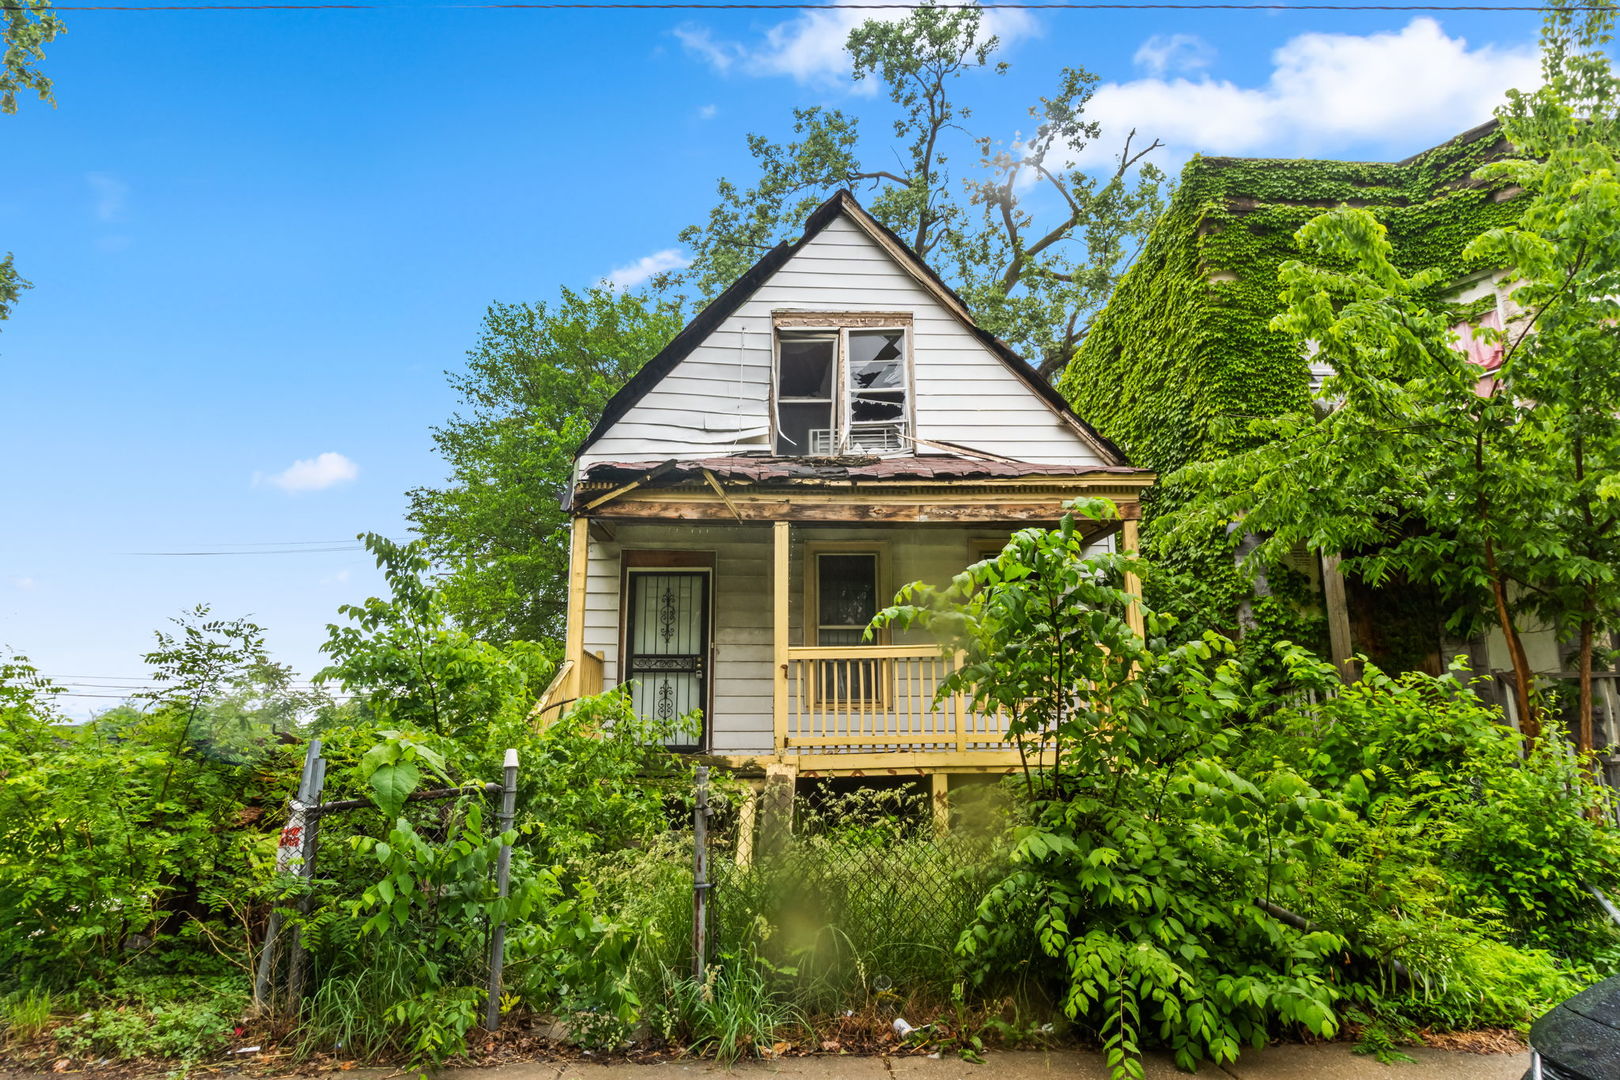
$39,000
3
bds
|
1
ba
|
971
sqft
|
built
1876
6641 S Green St, Chicago, IL 60621
$1,329
Cash flow
39.7%
Cash-on-Cash Return
40.9%
Cap rate
5.1%
Rent to Value Ratio
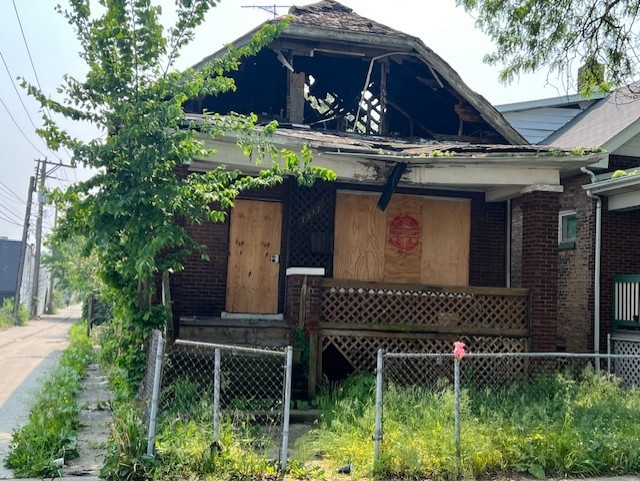
Active
$45,000
3
bds
|
1
ba
|
1,128
sqft
|
built
1918
7917 S Colfax Ave, Chicago, IL 60617
$1,154
Cash flow
29.9%
Cash-on-Cash Return
30.8%
Cap rate
4.0%
Rent to Value Ratio
3,734 out of 4,286 properties for sale in Chicago, IL
Limited Results Shown
Create a free account, or log in to reveal all property listings and enjoy the complete experience.
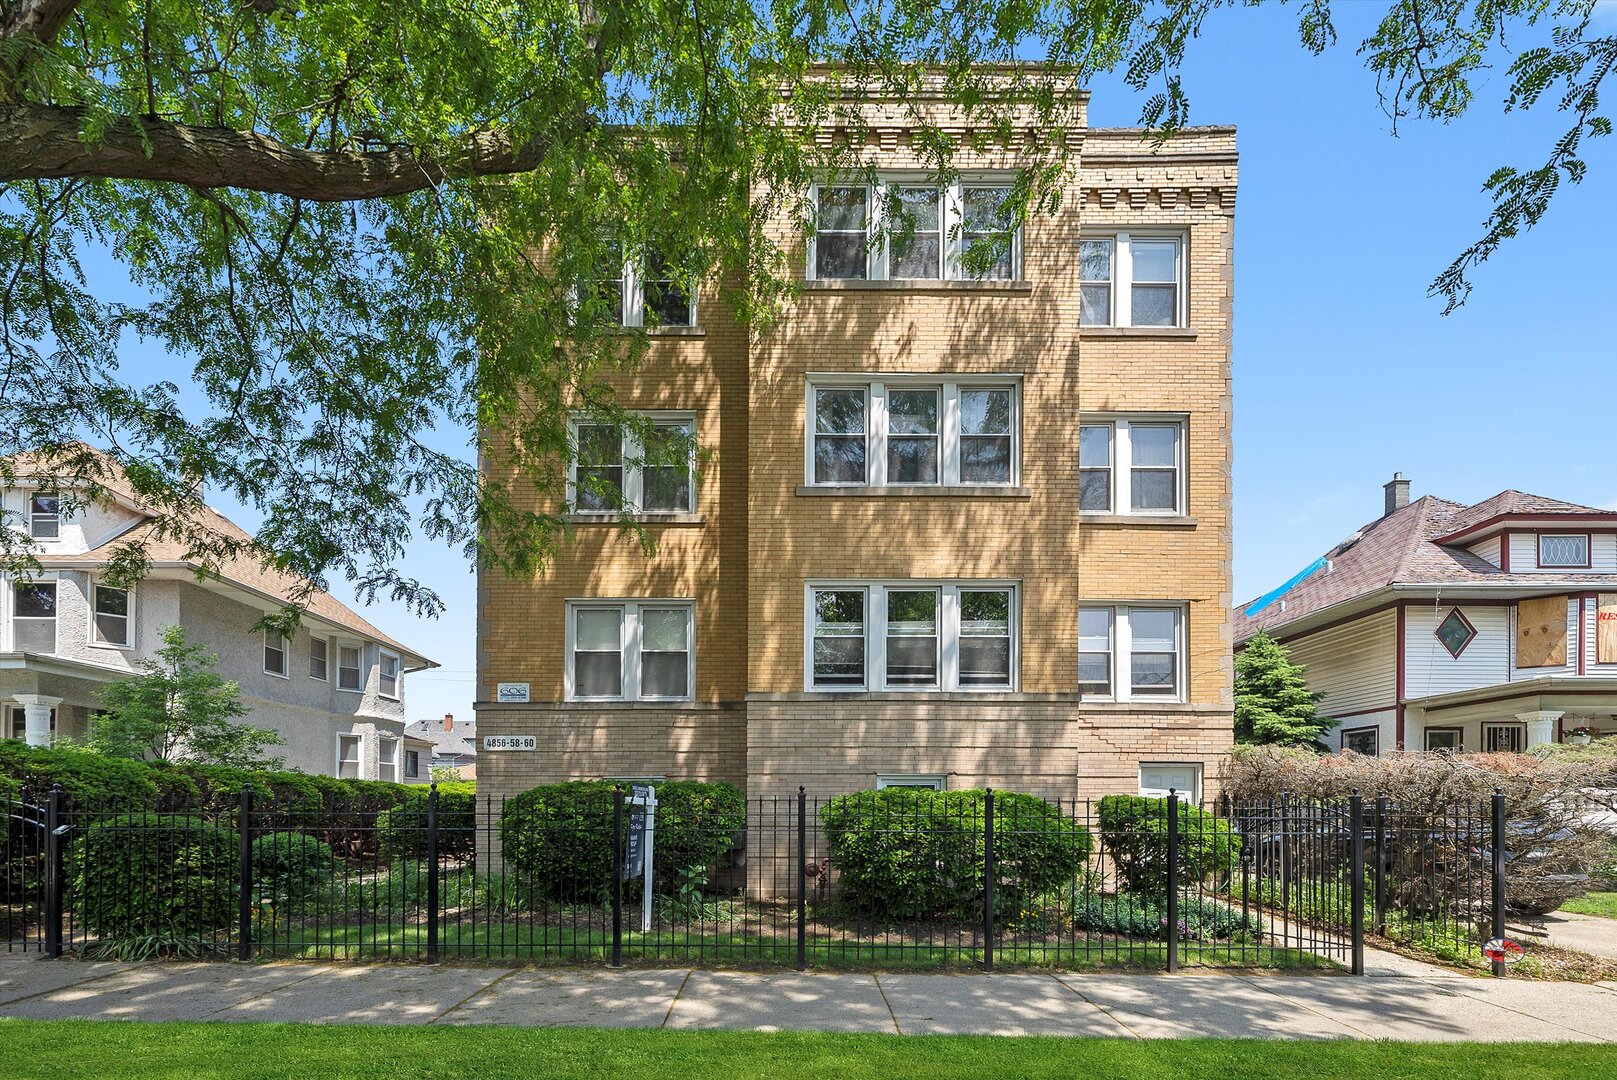
Active under contract
$175,000
1
bds
|
1
ba
|
0
sqft
|
built
1929
4860 W Warner Ave, Chicago, IL 60641
$-264
Cash flow
-7.9%
Cash-on-Cash Return
4.5%
Cap rate
0.9%
Rent to Value Ratio
Active
$45,000
3
bds
|
1
ba
|
1,128
sqft
|
built
1918
7917 S Colfax Ave, Chicago, IL 60617
$1,154
Cash flow
29.9%
Cash-on-Cash Return
30.8%
Cap rate
4.0%
Rent to Value Ratio
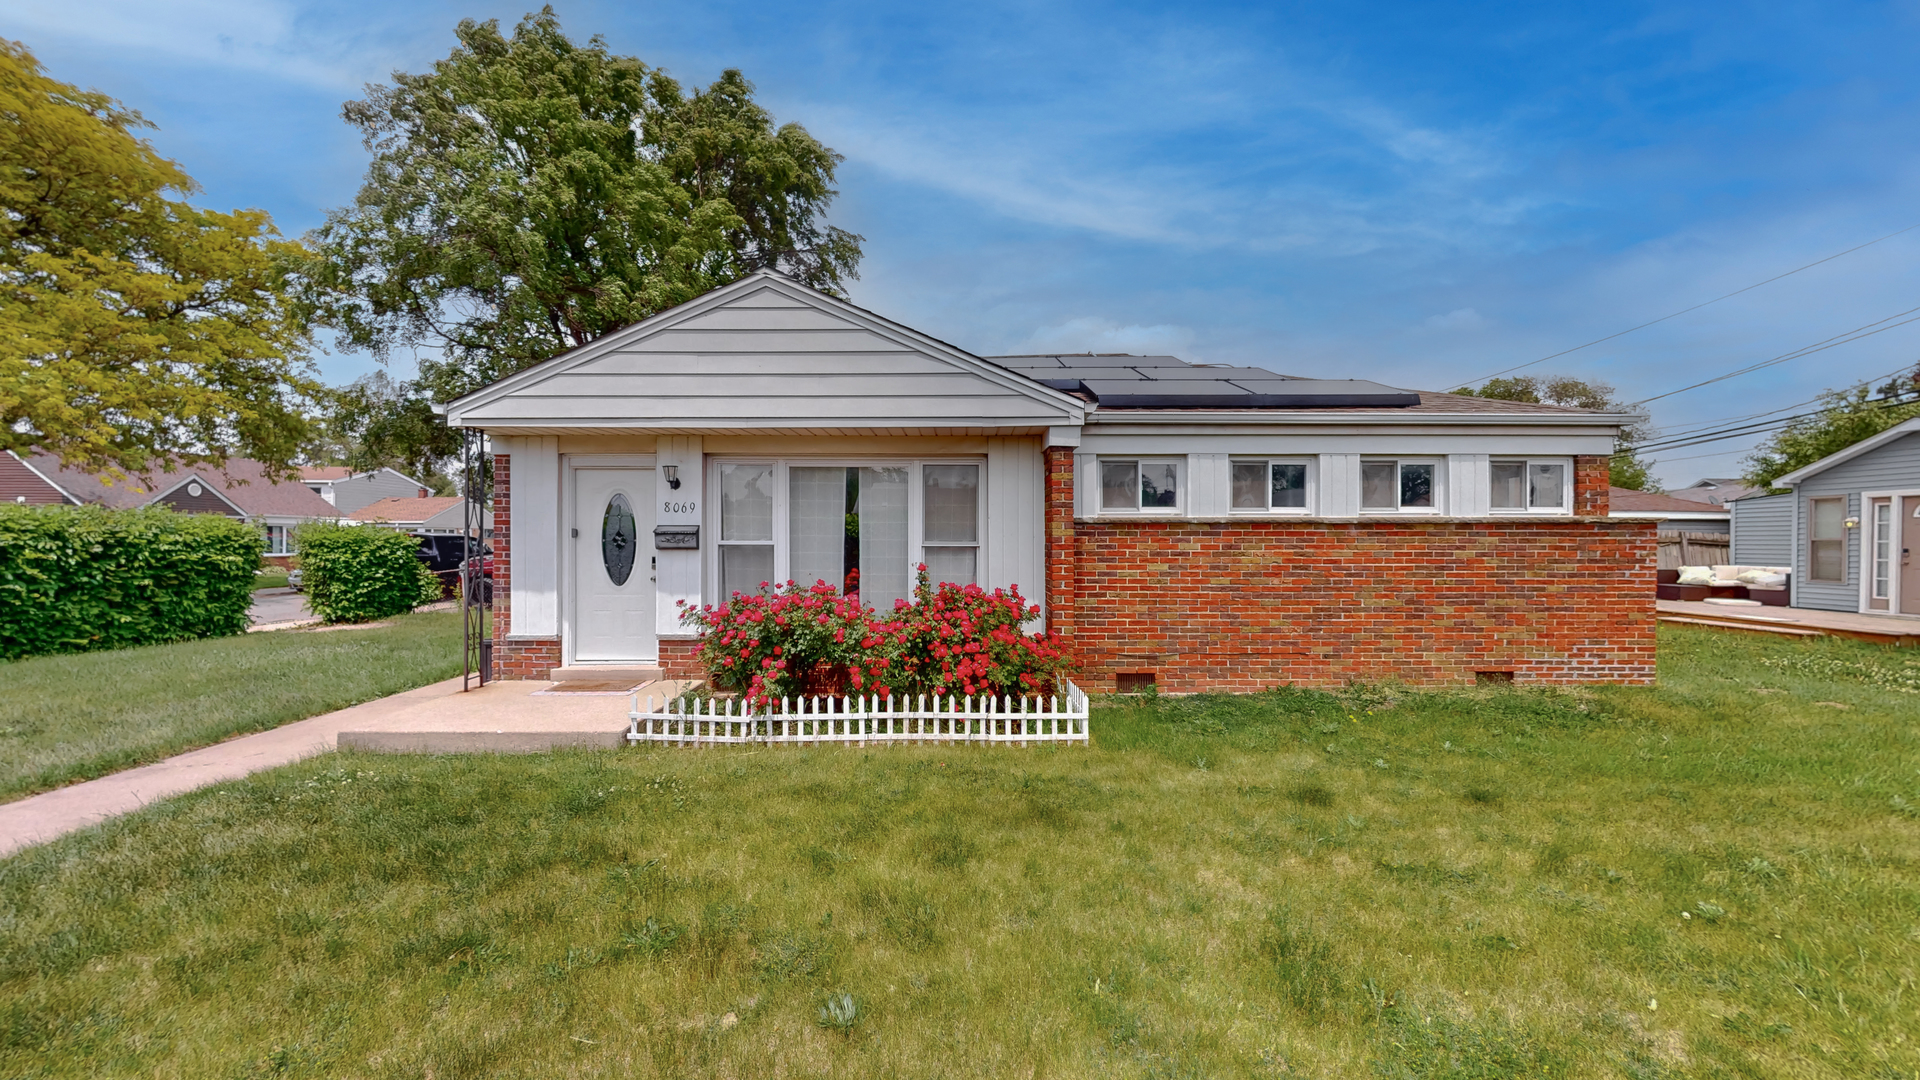
Active under contract
$275,000
3
bds
|
1
ba
|
988
sqft
|
built
1956
8069 S Kolmar Ave, Chicago, IL 60652
$234
Cash flow
4.4%
Cash-on-Cash Return
7.3%
Cap rate
1.0%
Rent to Value Ratio
Active
$249,500
2
bds
|
1
ba
|
700
sqft
|
built
1911
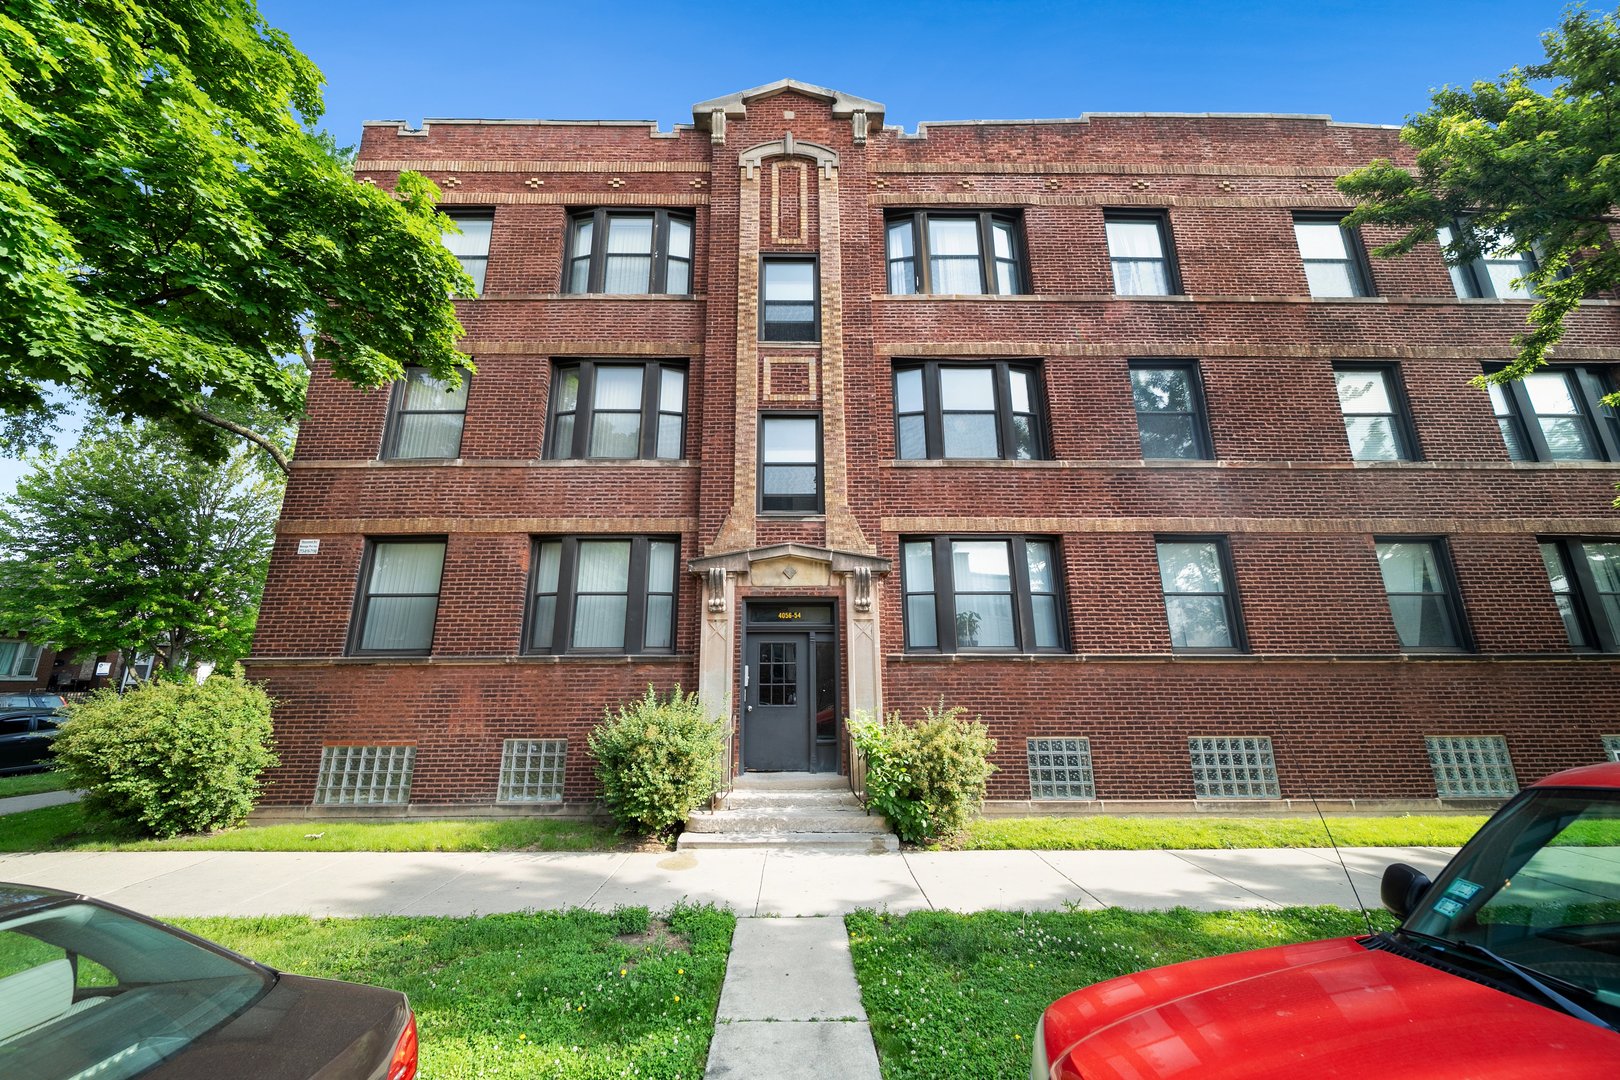
4054 W Palmer St, Chicago, IL 60639
$-463
Cash flow
-9.7%
Cash-on-Cash Return
4.1%
Cap rate
0.6%
Rent to Value Ratio
Active
$379,000
3
bds
|
2
ba
|
1,269
sqft
|
built
2020
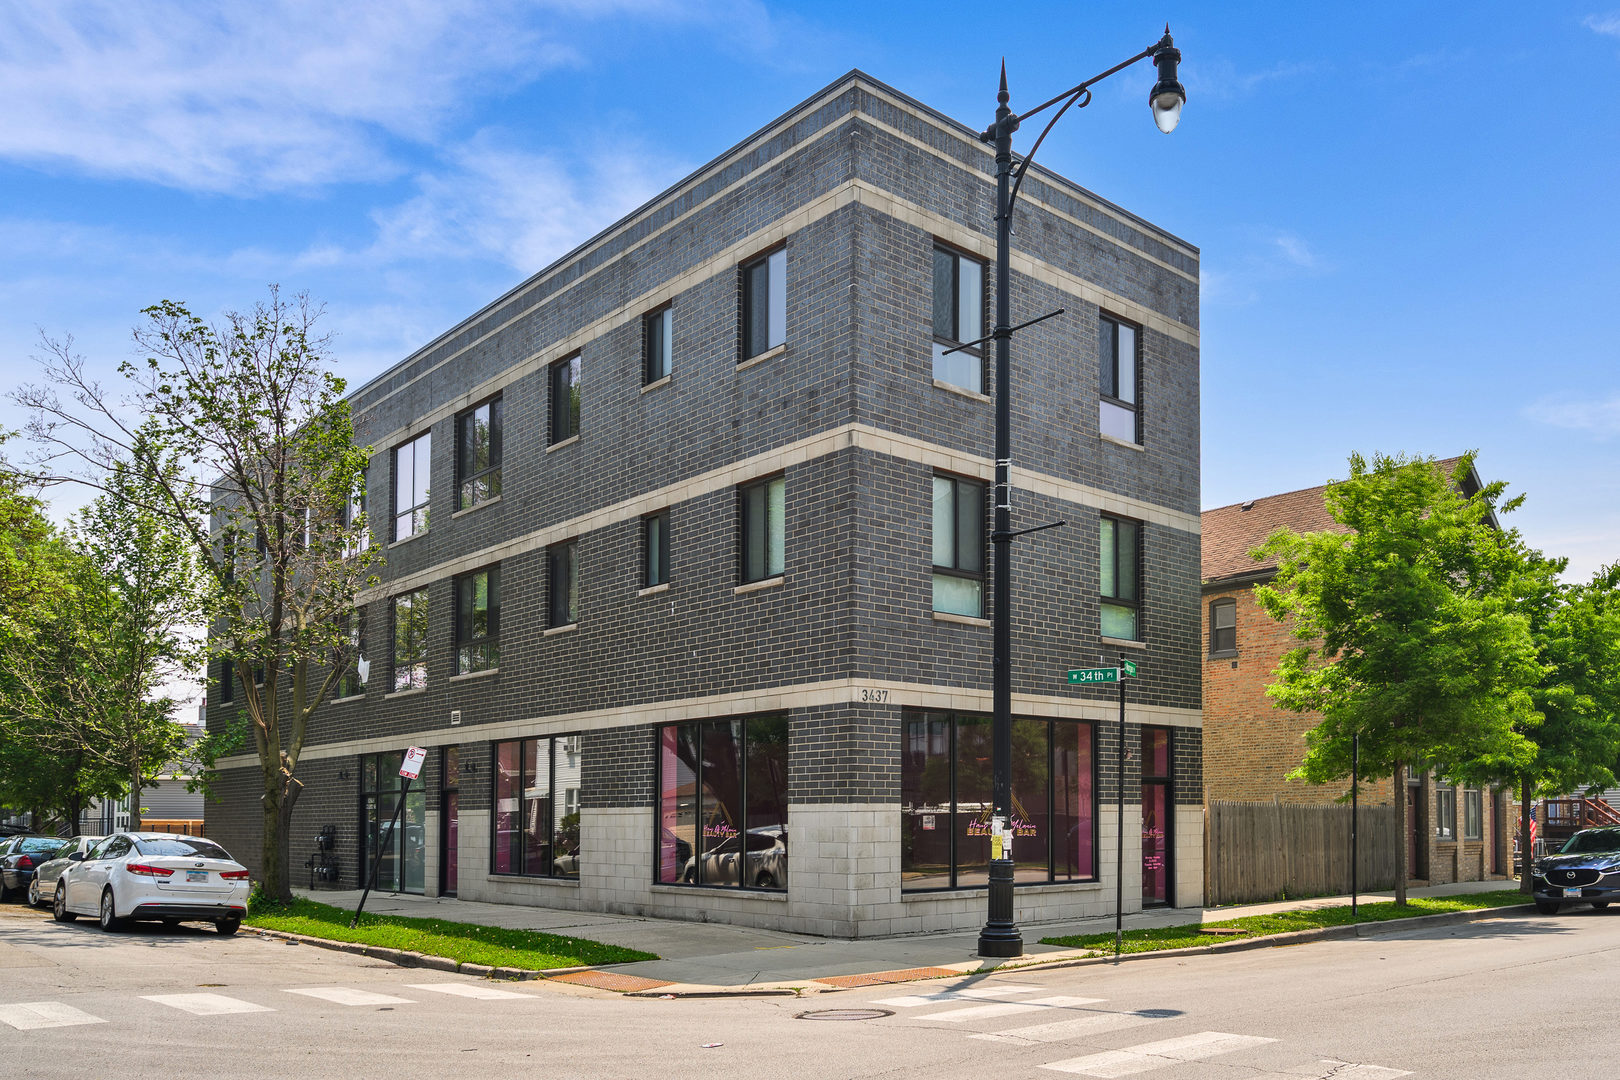
3437 S Morgan St, Chicago, IL 60608
$-175
Cash flow
-2.4%
Cash-on-Cash Return
5.7%
Cap rate
0.8%
Rent to Value Ratio
Active
$214,000
1
bds
|
1
ba
|
0
sqft
|
built
1964
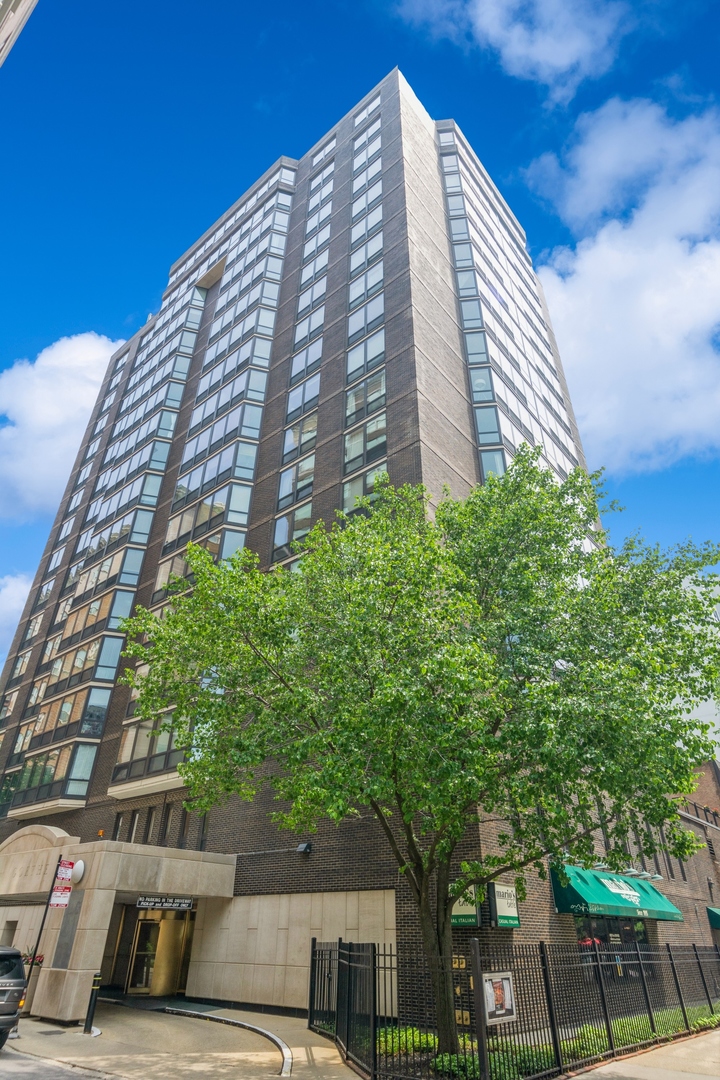
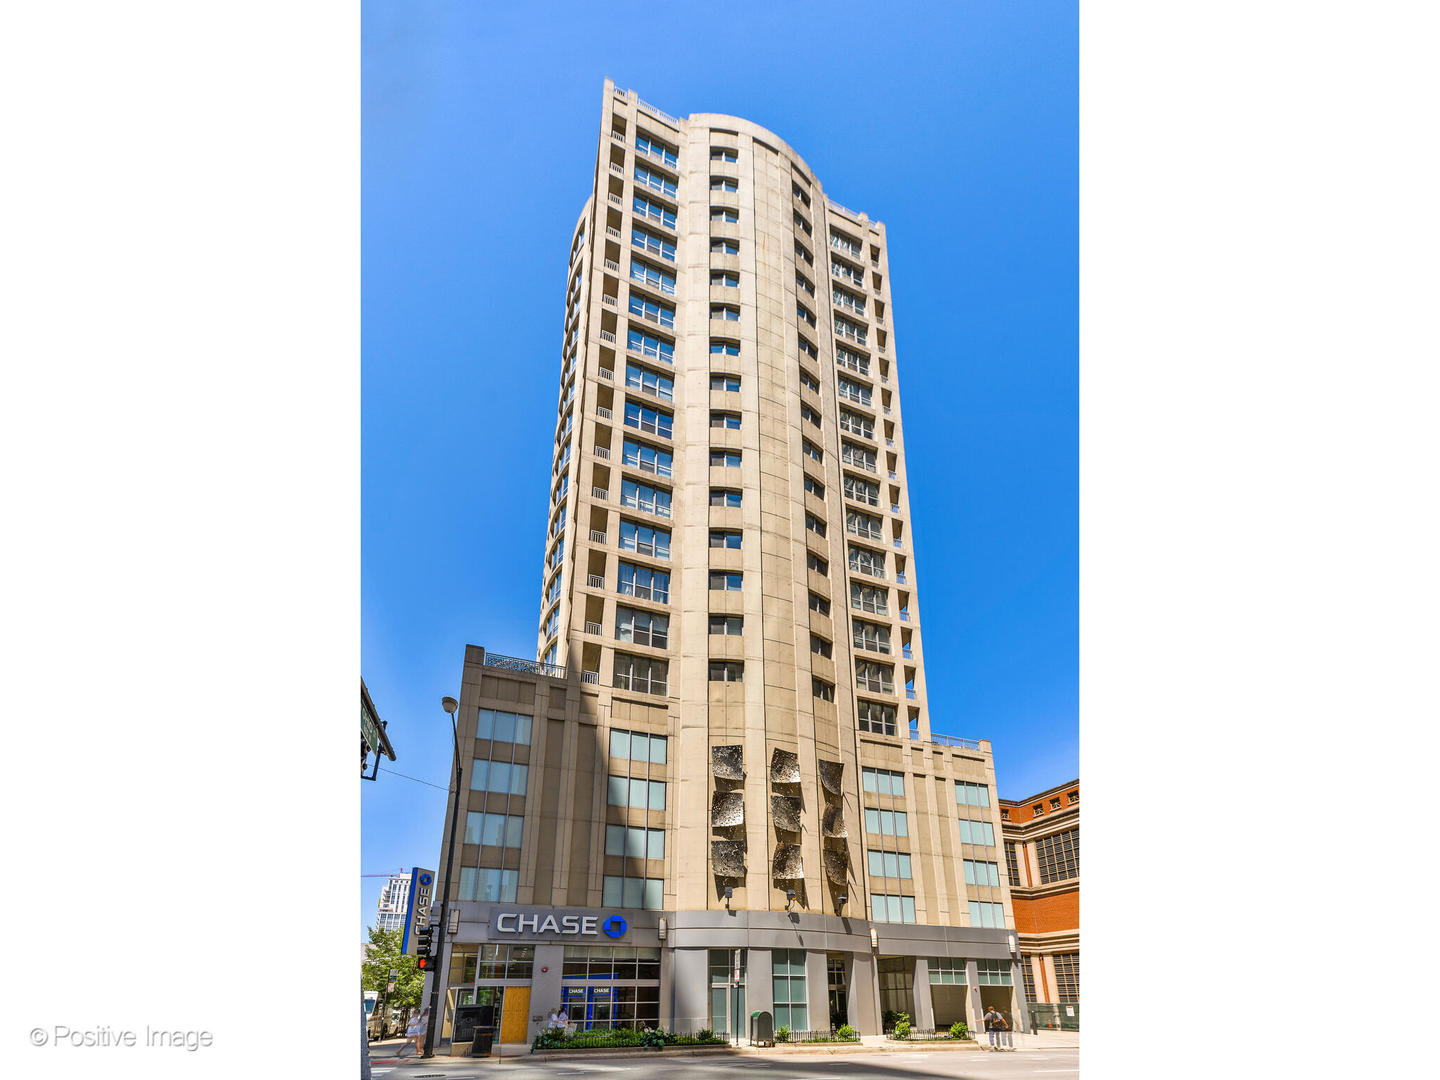
21 W Goethe St, Chicago, IL 60610
$-878
Cash flow
-21.4%
Cash-on-Cash Return
1.4%
Cap rate
1.0%
Rent to Value Ratio
Active under contract
$374,900
6
bds
|
2
ba
|
0
sqft
|
built
1865
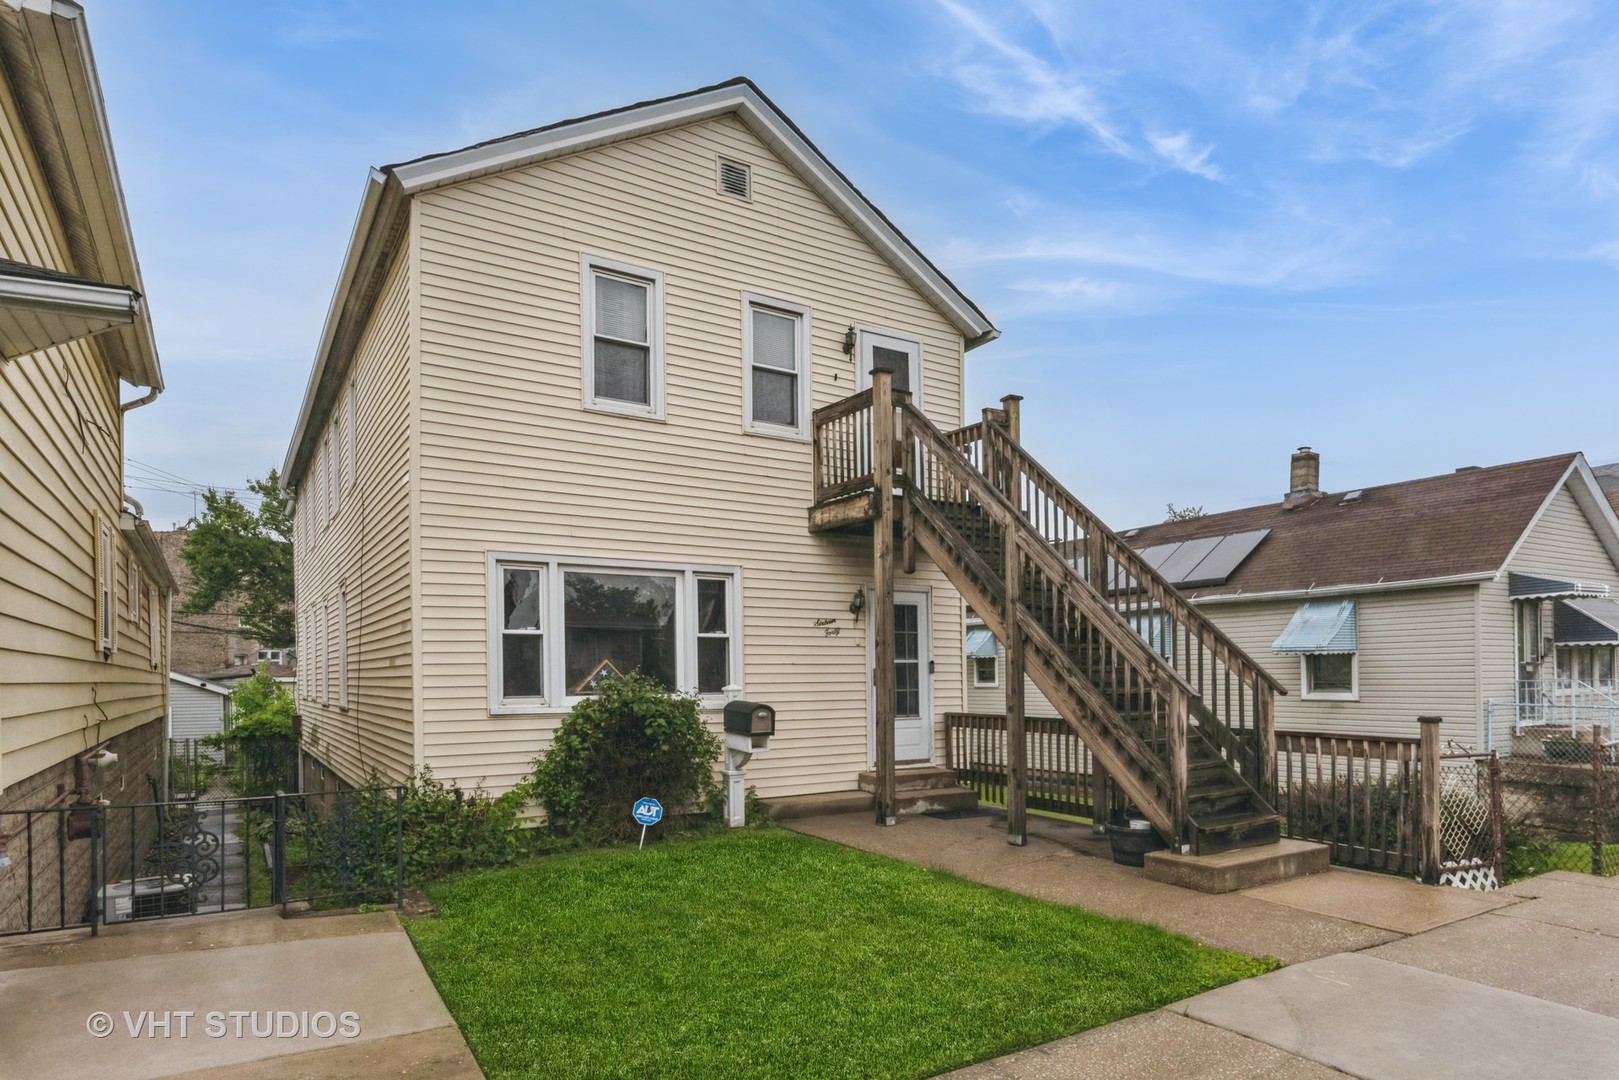
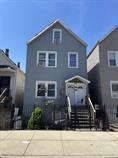
1640 W 32nd St, Chicago, IL 60608
$-639
Cash flow
-8.9%
Cash-on-Cash Return
4.2%
Cap rate
0.6%
Rent to Value Ratio
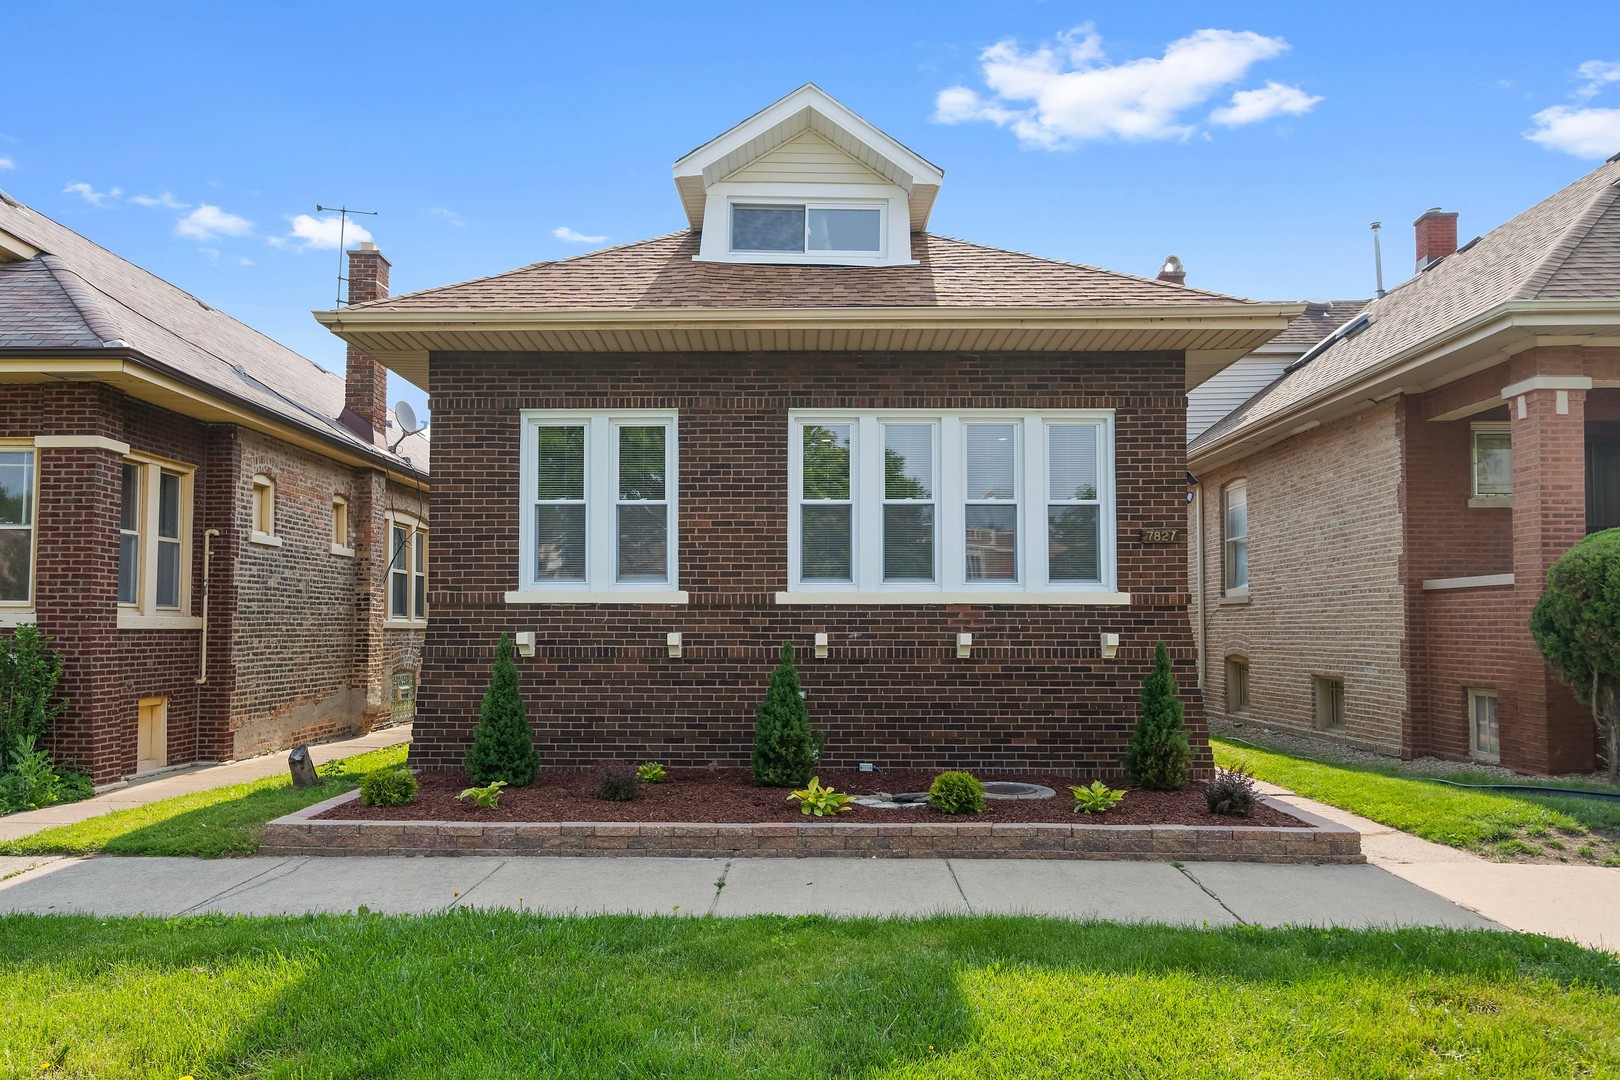
Active
$344,000
3
bds
|
2
ba
|
1,988
sqft
|
built
1923
7827 S Calumet Ave, Chicago, IL 60619
$-461
Cash flow
-7.0%
Cash-on-Cash Return
4.7%
Cap rate
0.7%
Rent to Value Ratio
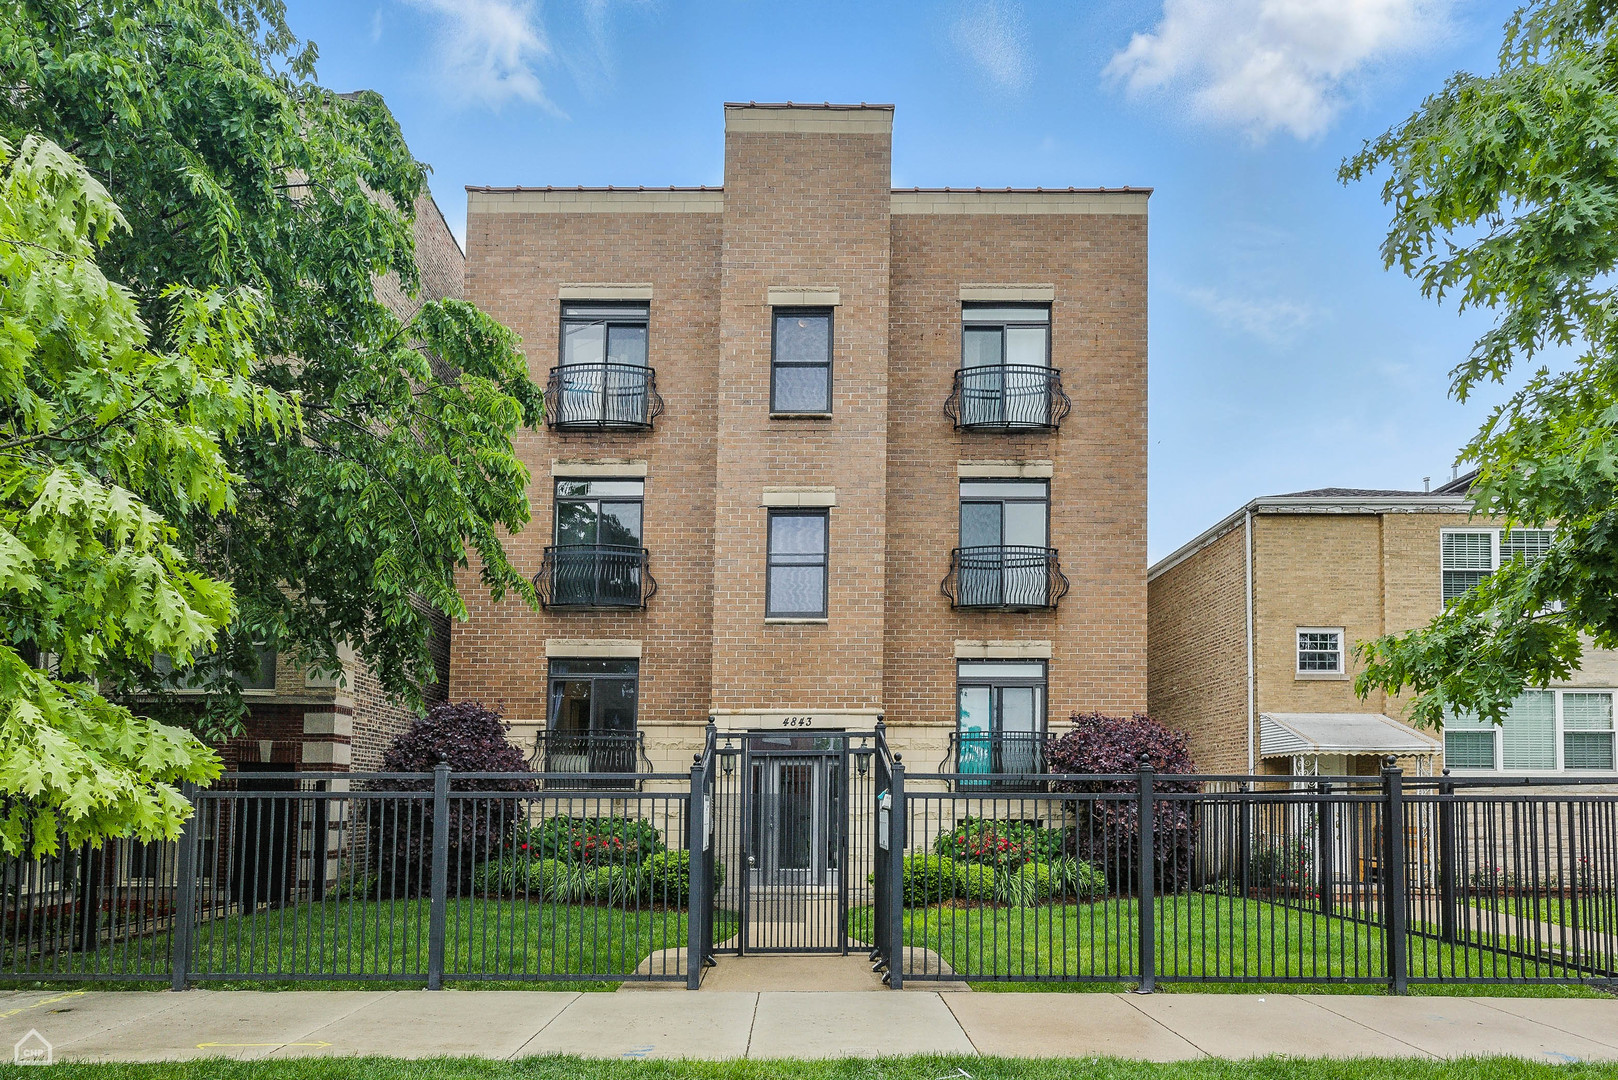
Active
$449,000
3
bds
|
3
ba
|
2,200
sqft
|
built
2009
4843 N Harding Ave, Chicago, IL 60625
$-727
Cash flow
-8.4%
Cash-on-Cash Return
4.3%
Cap rate
0.8%
Rent to Value Ratio
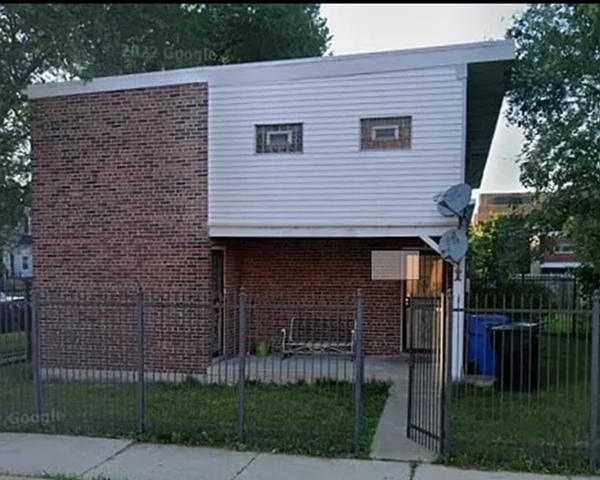
Active
$474,999
6
bds
|
3
ba
|
0
sqft
|
built
1944
3725 S Wabash Ave, Chicago, IL 60653
$-946
Cash flow
-10.4%
Cash-on-Cash Return
3.9%
Cap rate
0.5%
Rent to Value Ratio
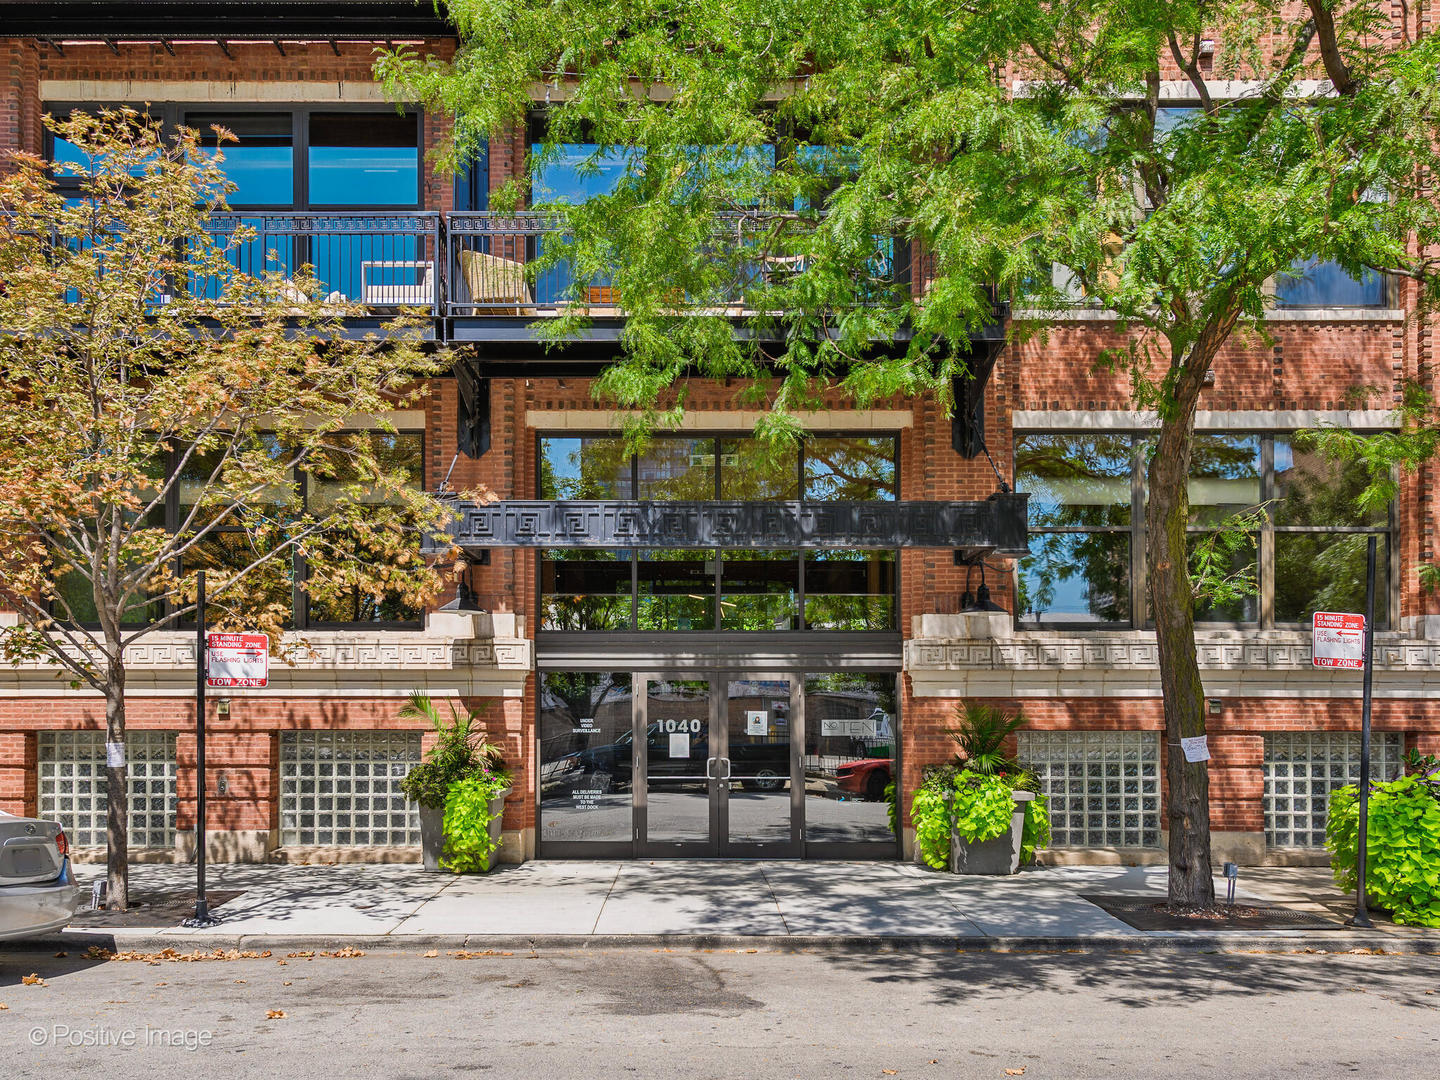
Active under contract
$550,000
2
bds
|
2
ba
|
0
sqft
|
built
2006
1040 W Adams St, Chicago, IL 60607
$-2,018
Cash flow
-19.1%
Cash-on-Cash Return
1.9%
Cap rate
0.6%
Rent to Value Ratio
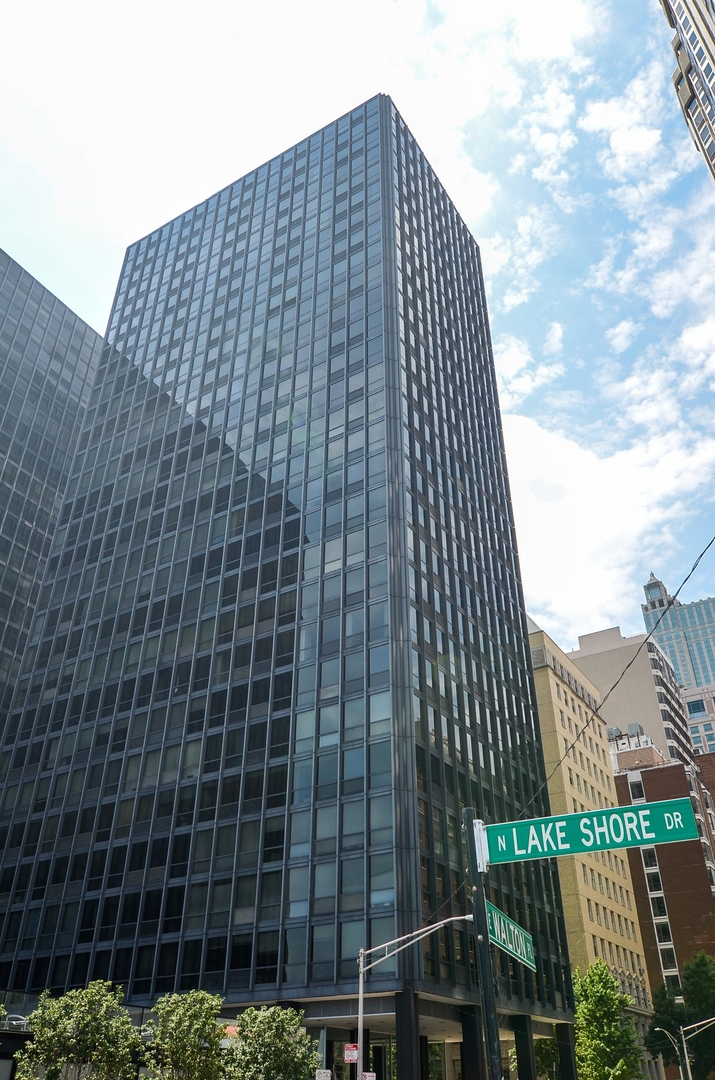
Active
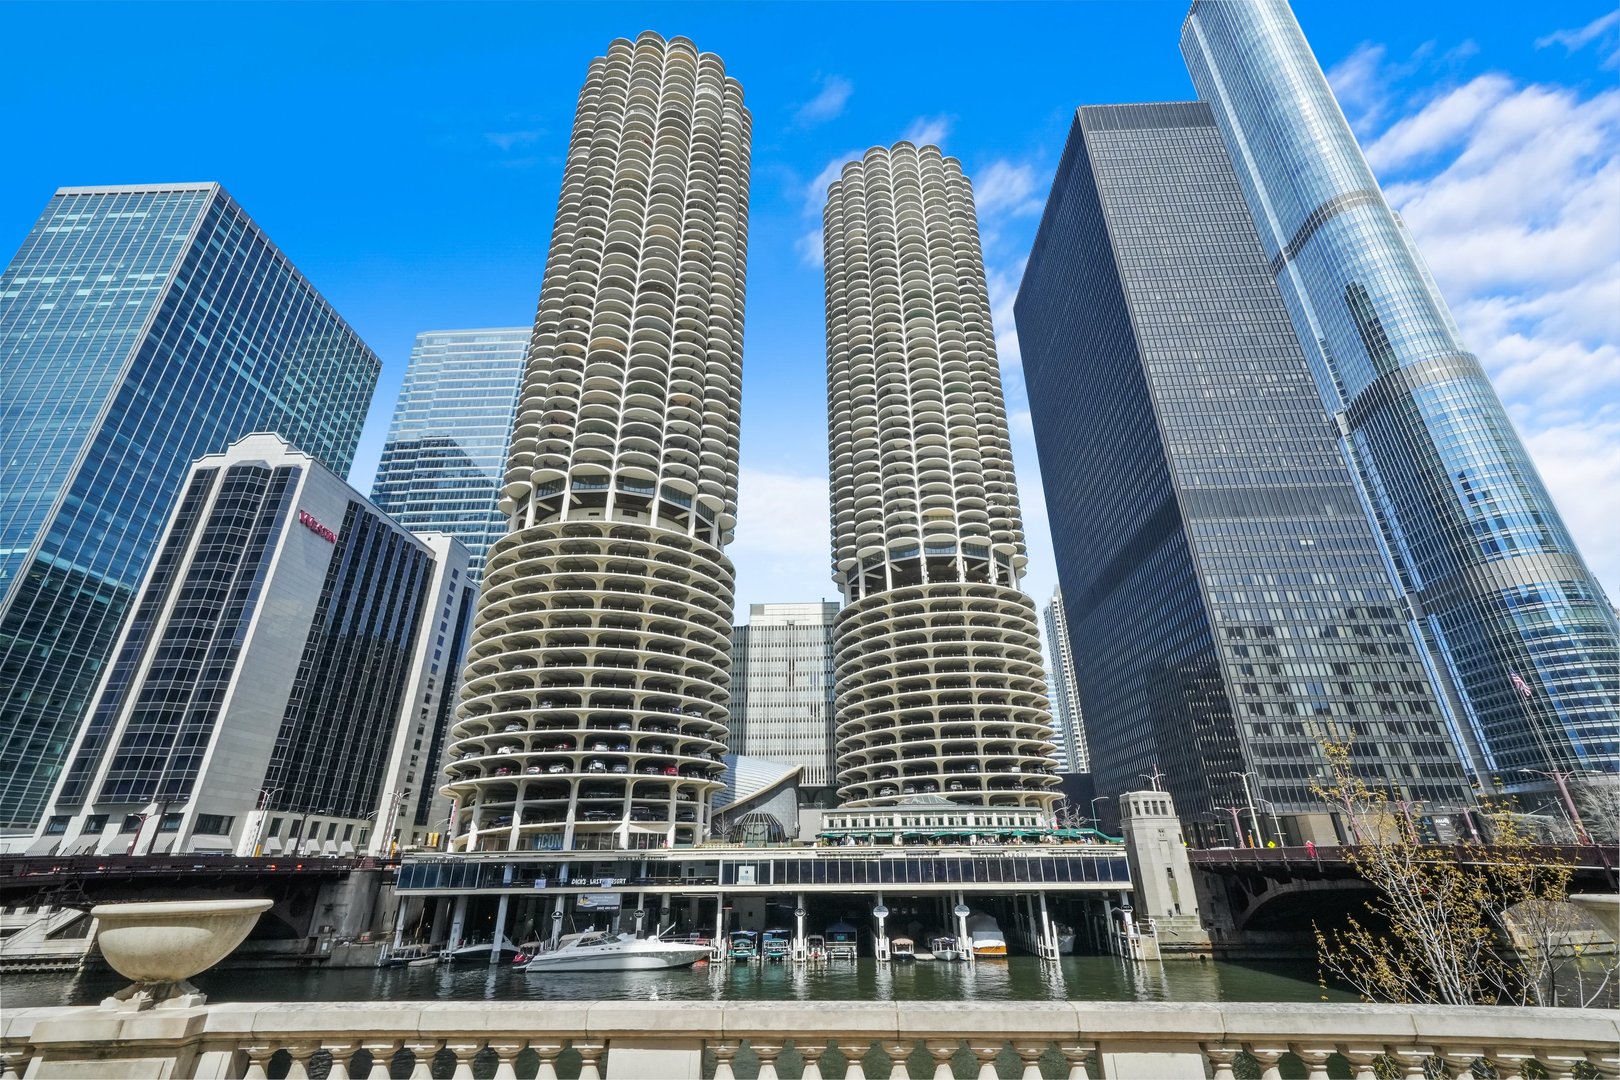
$315,000
1
bds
|
1
ba
|
841
sqft
|
built
1955
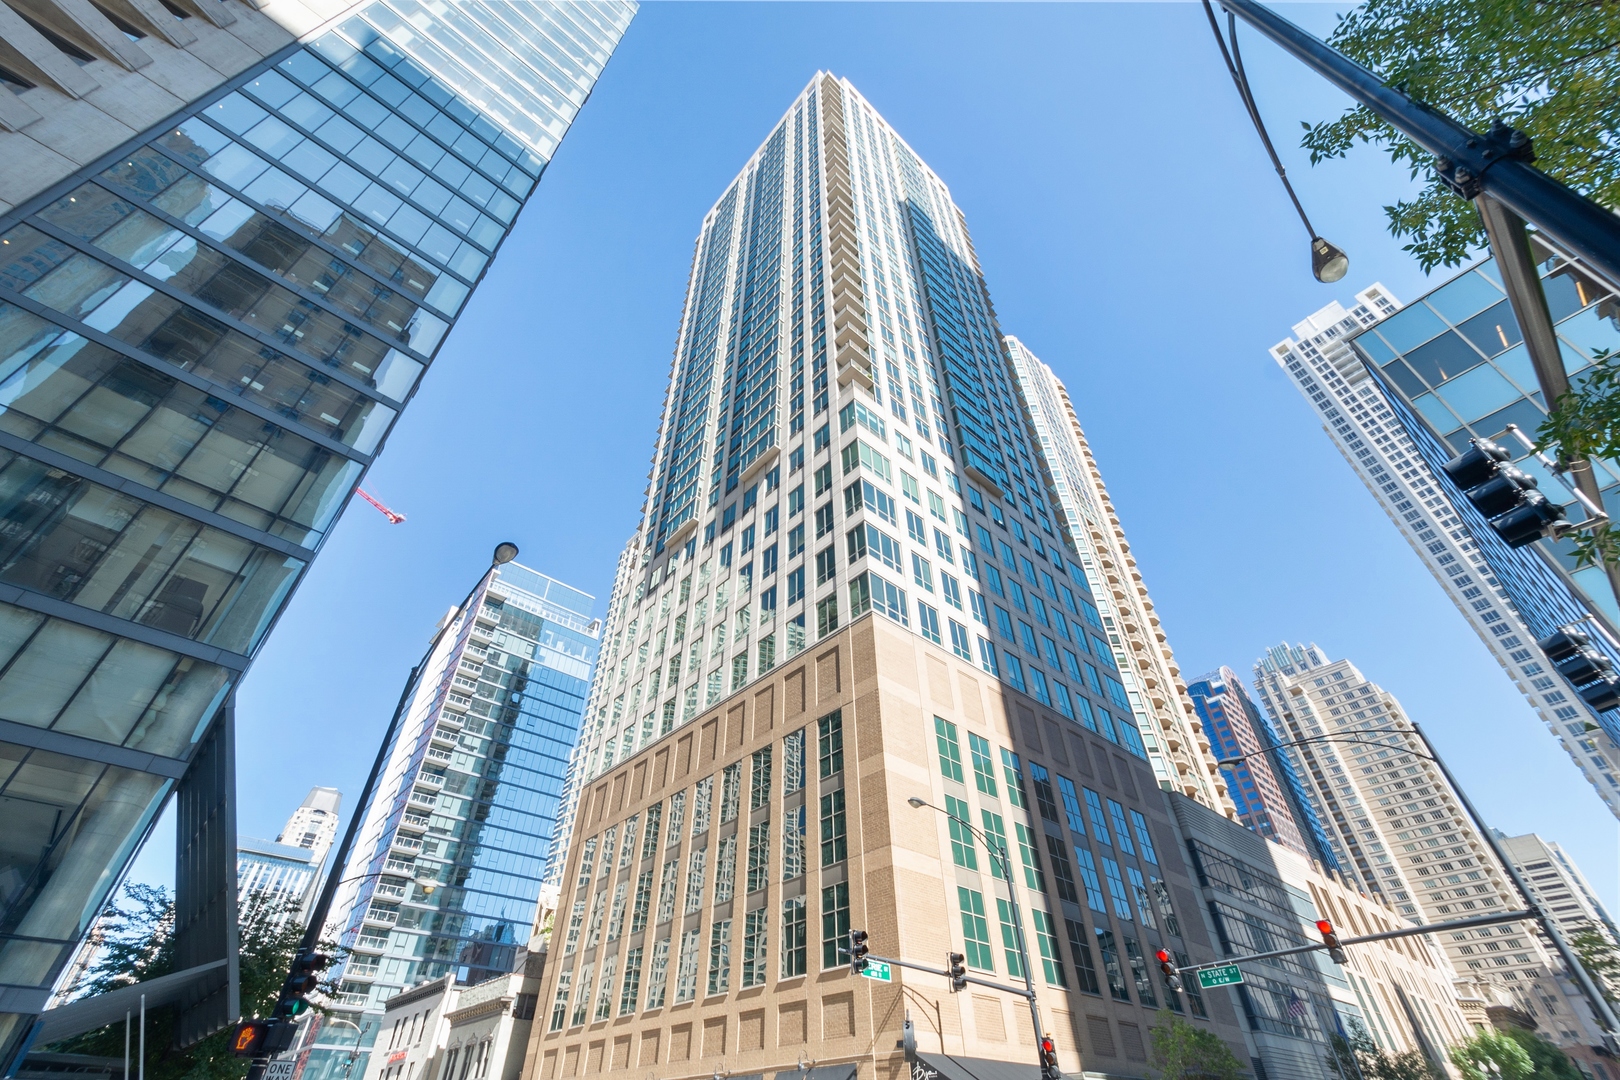
910 N Lake Shore Dr, Chicago, IL 60611
$-1,213
Cash flow
-20.1%
Cash-on-Cash Return
1.7%
Cap rate
0.8%
Rent to Value Ratio
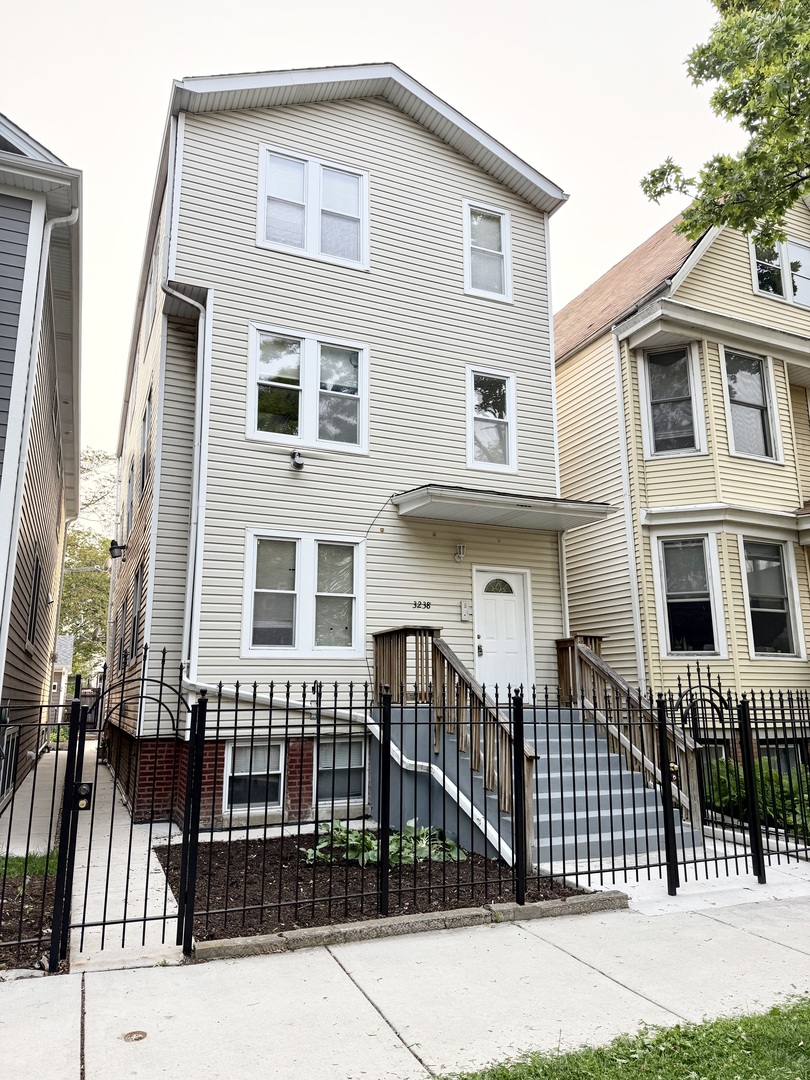
Active
$895,000
5
bds
|
6
ba
|
0
sqft
|
built
1910
3238 N Whipple St, Chicago, IL 60618
$-2,835
Cash flow
-16.5%
Cash-on-Cash Return
2.5%
Cap rate
0.4%
Rent to Value Ratio
Active
$349,900
6
bds
|
3
ba
|
0
sqft
|
built
1919
8122 S Evans Ave, Chicago, IL 60619
$-578
Cash flow
-8.6%
Cash-on-Cash Return
4.3%
Cap rate
0.6%
Rent to Value Ratio
Active
$124,999
2
bds
|
2
ba
|
910
sqft
|
built
1908
3014 S Kolin Ave, Chicago, IL 60623
$47
Cash flow
2.0%
Cash-on-Cash Return
6.7%
Cap rate
1.1%
Rent to Value Ratio
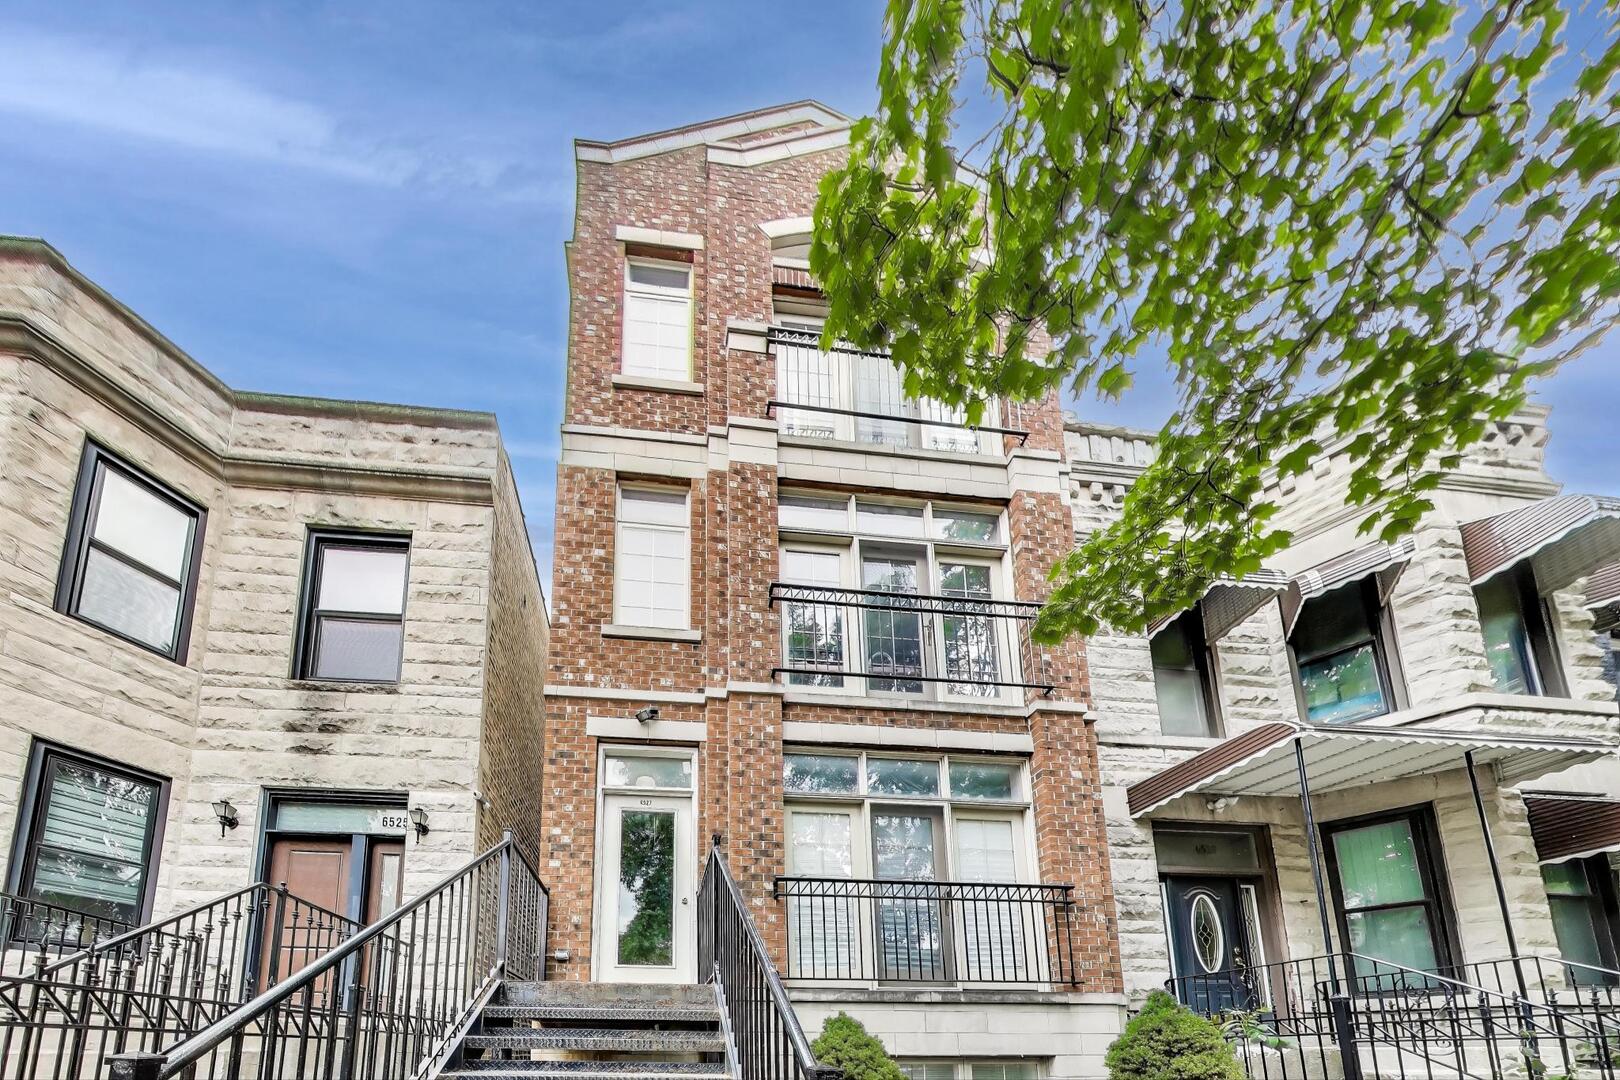
Active
$799,900
8
bds
|
7
ba
|
0
sqft
|
built
2008
6527 S Drexel Ave, Chicago, IL 60637
$-3,638
Cash flow
-23.7%
Cash-on-Cash Return
0.8%
Cap rate
0.3%
Rent to Value Ratio
Active
$249,900
2
bds
|
2
ba
|
1,250
sqft
|
built
1968
5757 N Sheridan Rd, Chicago, IL 60660
$-1,062
Cash flow
-22.2%
Cash-on-Cash Return
1.2%
Cap rate
1.0%
Rent to Value Ratio
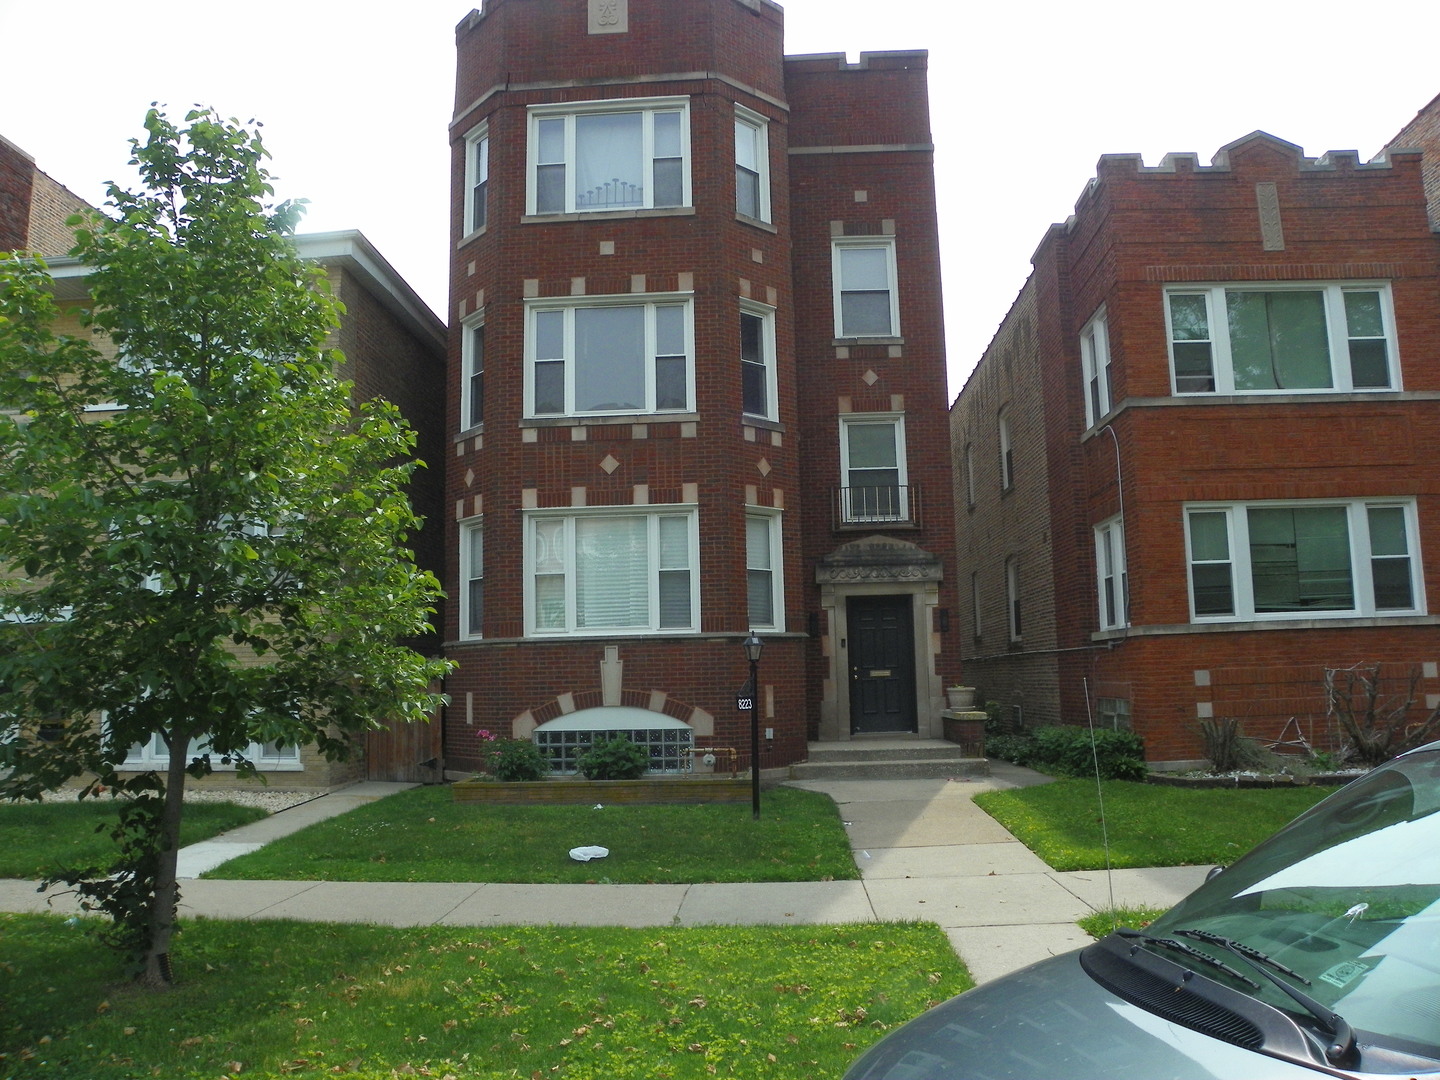
Active
$400,000
6
bds
|
3
ba
|
0
sqft
|
built
1925
8223 S Langley Ave, Chicago, IL 60619
$-716
Cash flow
-9.3%
Cash-on-Cash Return
4.1%
Cap rate
0.6%
Rent to Value Ratio
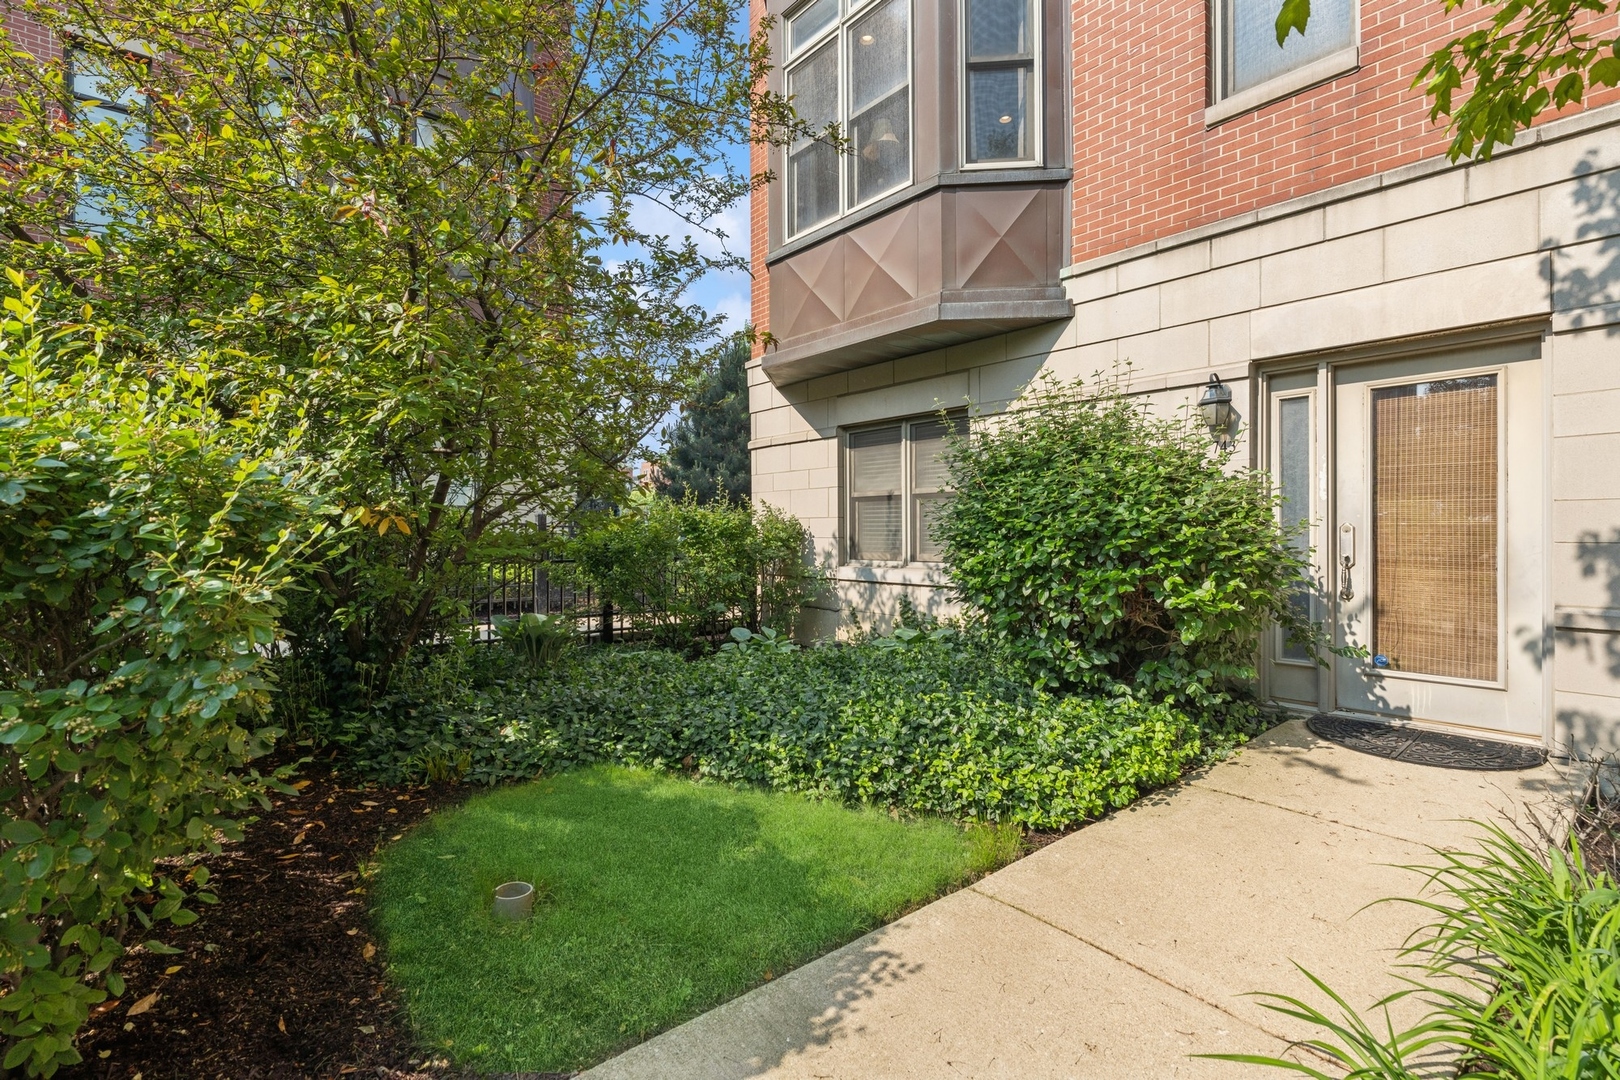
Active
$849,500
4
bds
|
4
ba
|
2,907
sqft
|
built
2008
743 W 15th St, Chicago, IL 60607
$-2,764
Cash flow
-17.0%
Cash-on-Cash Return
2.4%
Cap rate
0.5%
Rent to Value Ratio
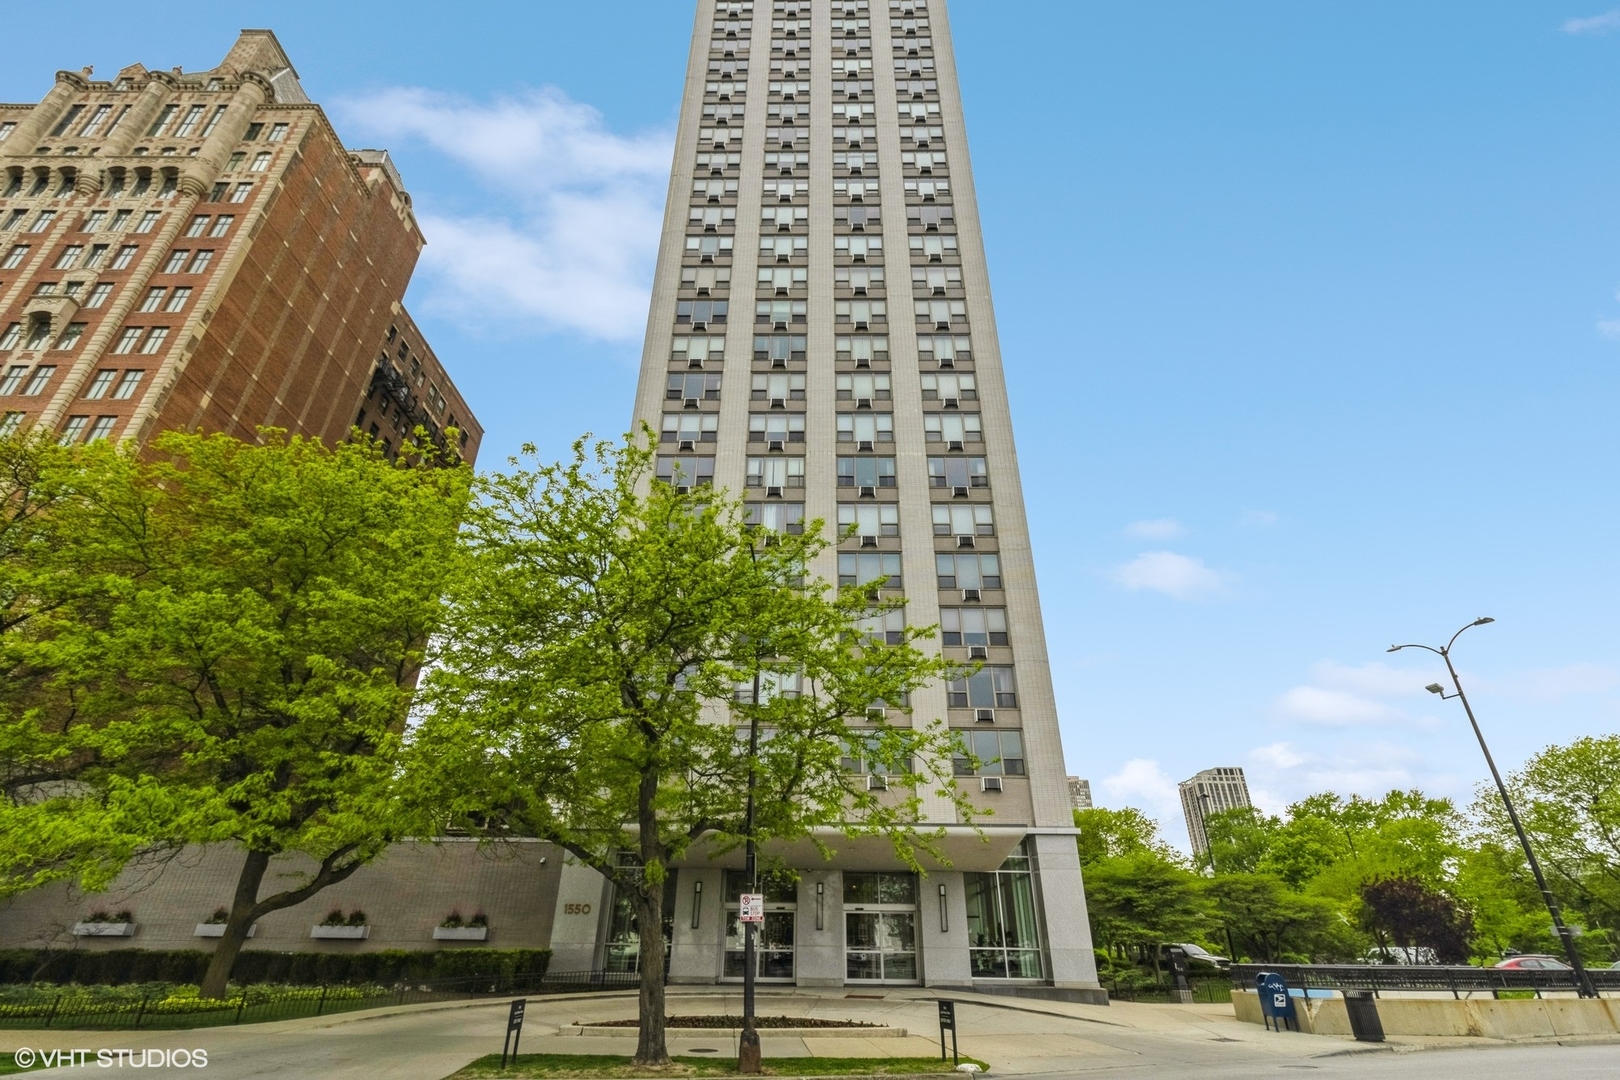
Active
$259,000
1
bds
|
1
ba
|
800
sqft
|
built
1960
1550 N Lake Shore Dr, Chicago, IL 60610
$-930
Cash flow
-18.7%
Cash-on-Cash Return
2.0%
Cap rate
0.9%
Rent to Value Ratio
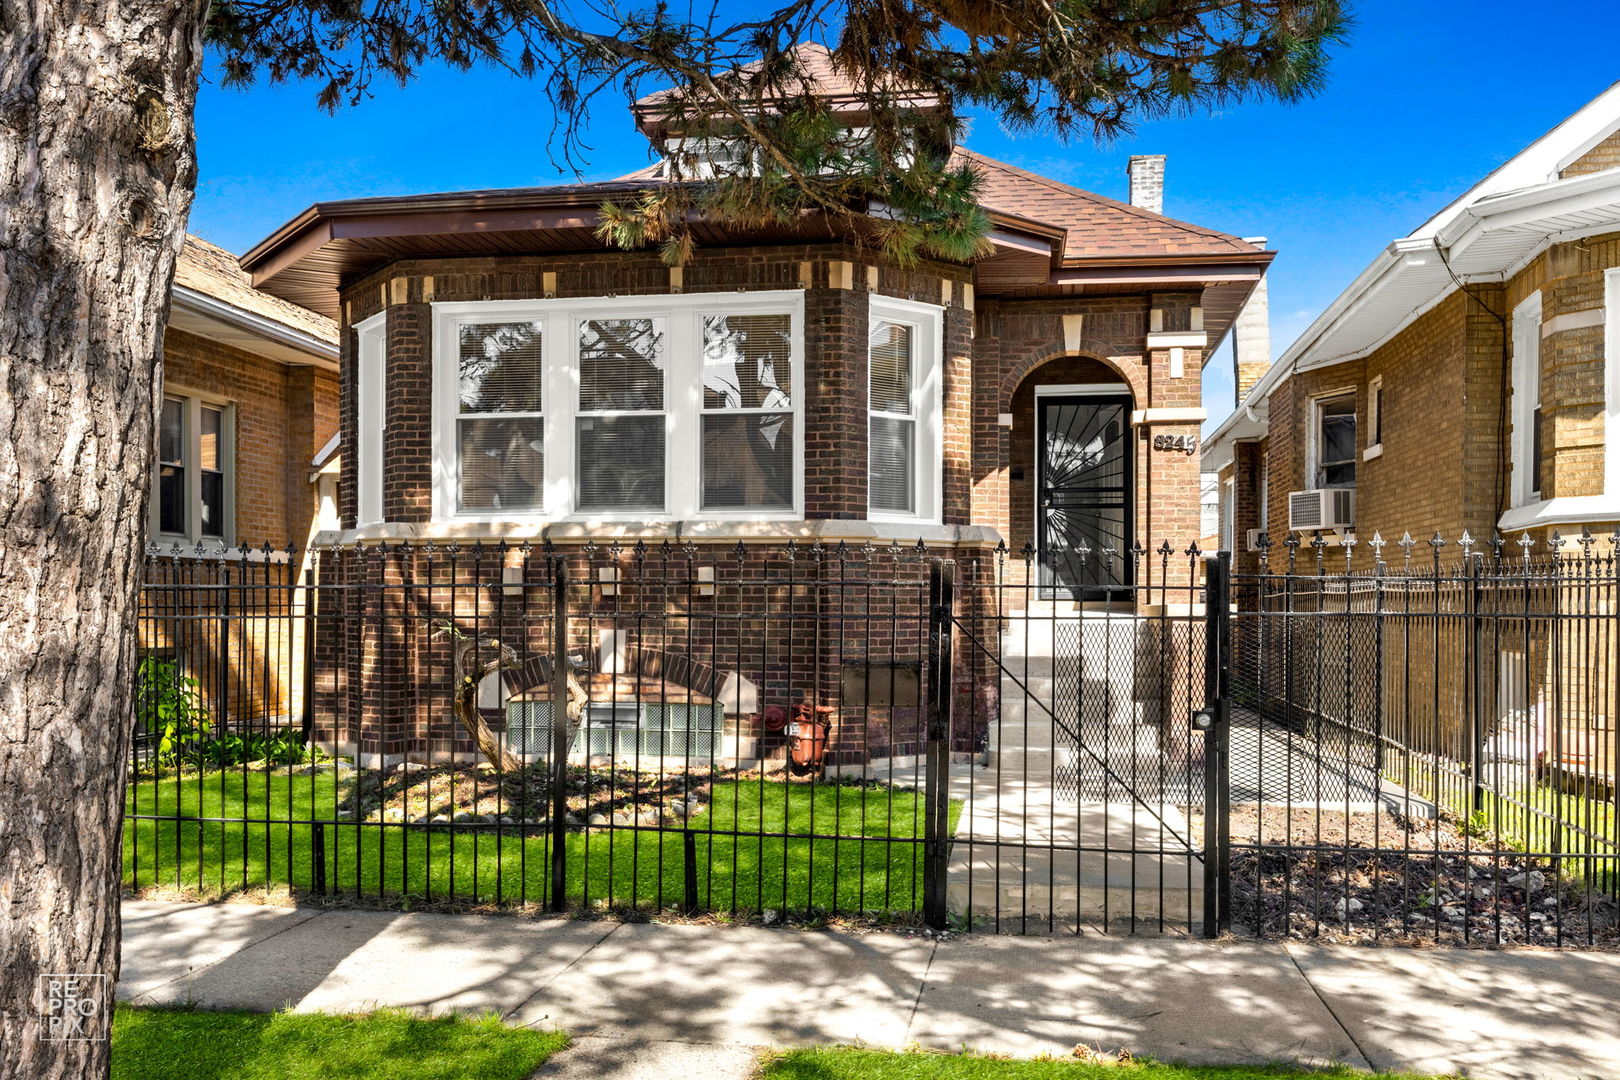
Active
$329,000
4
bds
|
3
ba
|
1,825
sqft
|
built
1923
8245 S Justine St, Chicago, IL 60620
$-504
Cash flow
-8.0%
Cash-on-Cash Return
4.4%
Cap rate
0.7%
Rent to Value Ratio
Active
$425,000
2
bds
|
2
ba
|
1,100
sqft
|
built
2008
1464 S Michigan Ave, Chicago, IL 60605
$-1,526
Cash flow
-18.7%
Cash-on-Cash Return
2.0%
Cap rate
0.7%
Rent to Value Ratio
Active
$899,999
4
bds
|
4
ba
|
2,781
sqft
|
built
1908
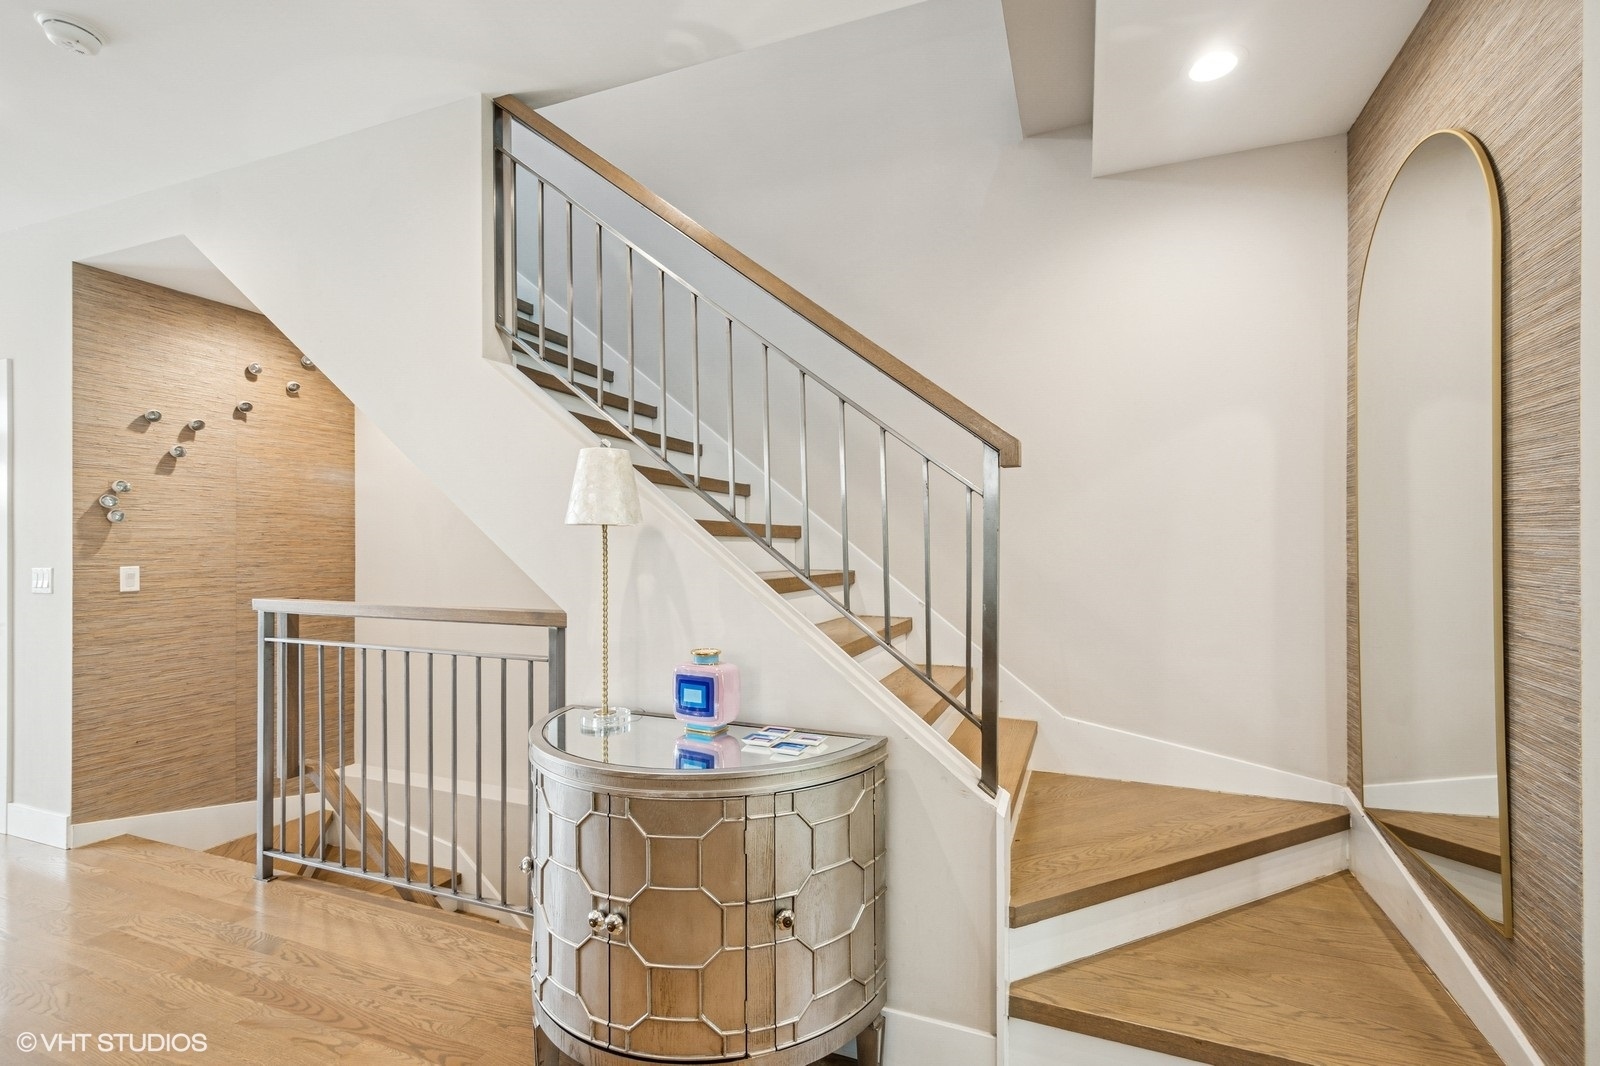
400 S Green St, Chicago, IL 60607
$-1,783
Cash flow
-10.3%
Cash-on-Cash Return
3.9%
Cap rate
0.9%
Rent to Value Ratio
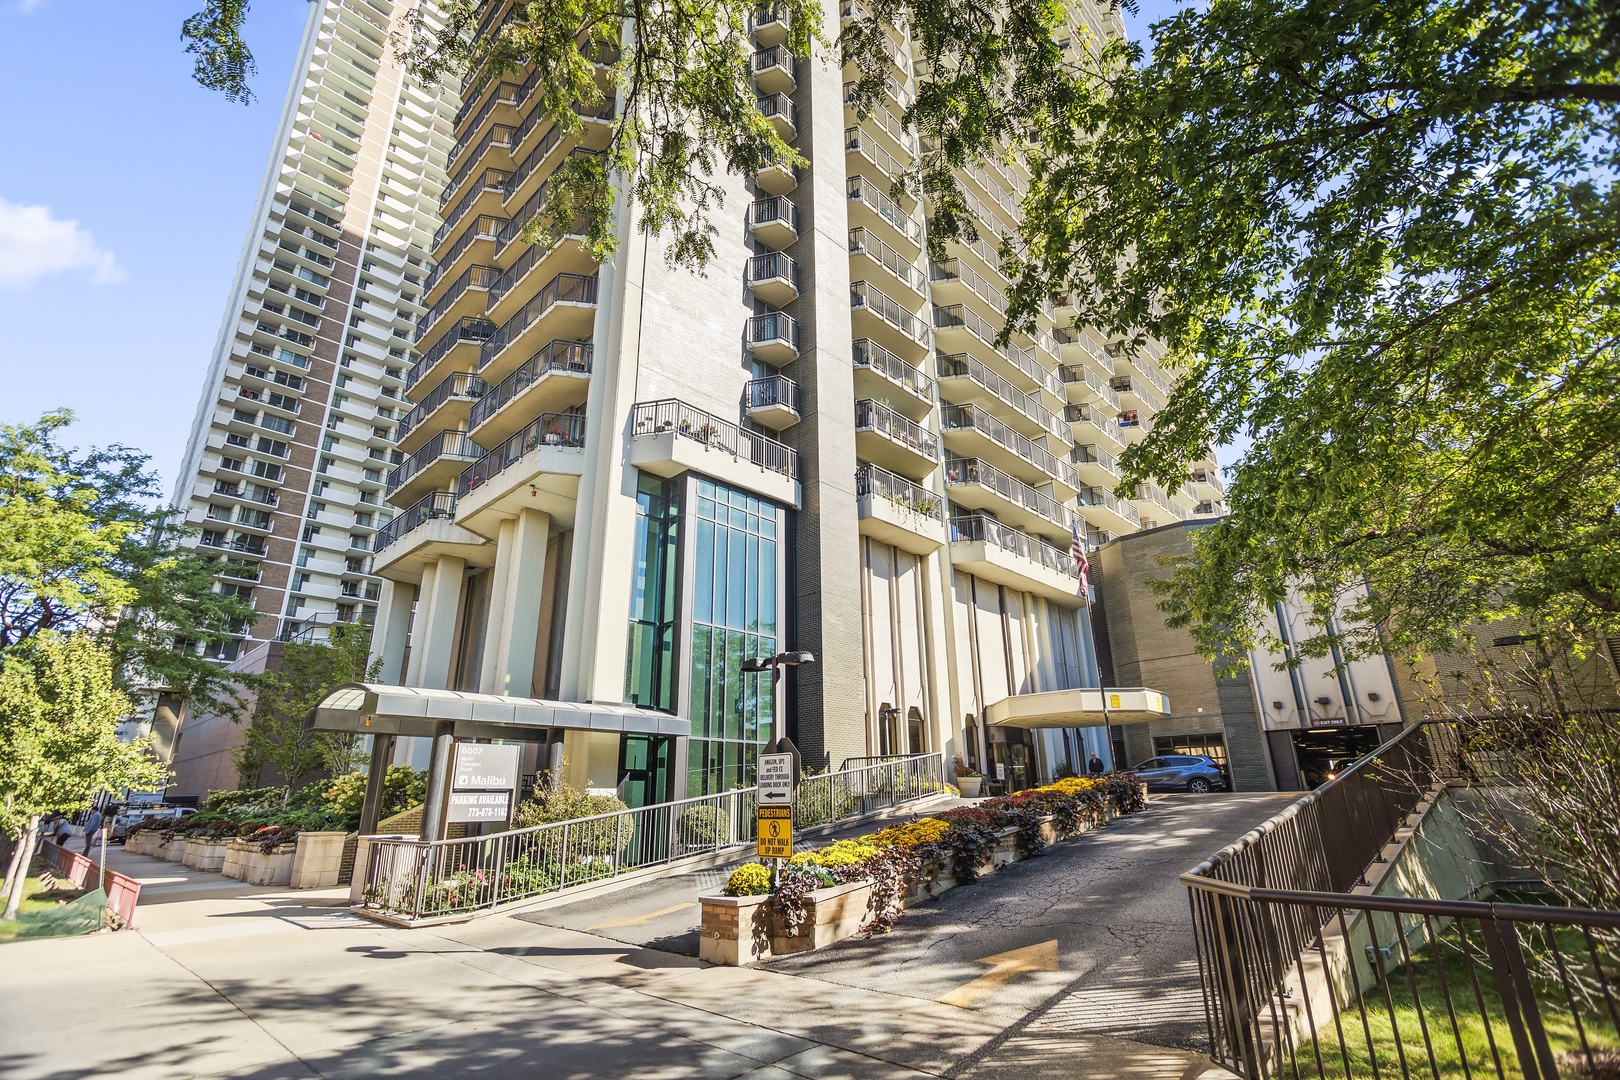
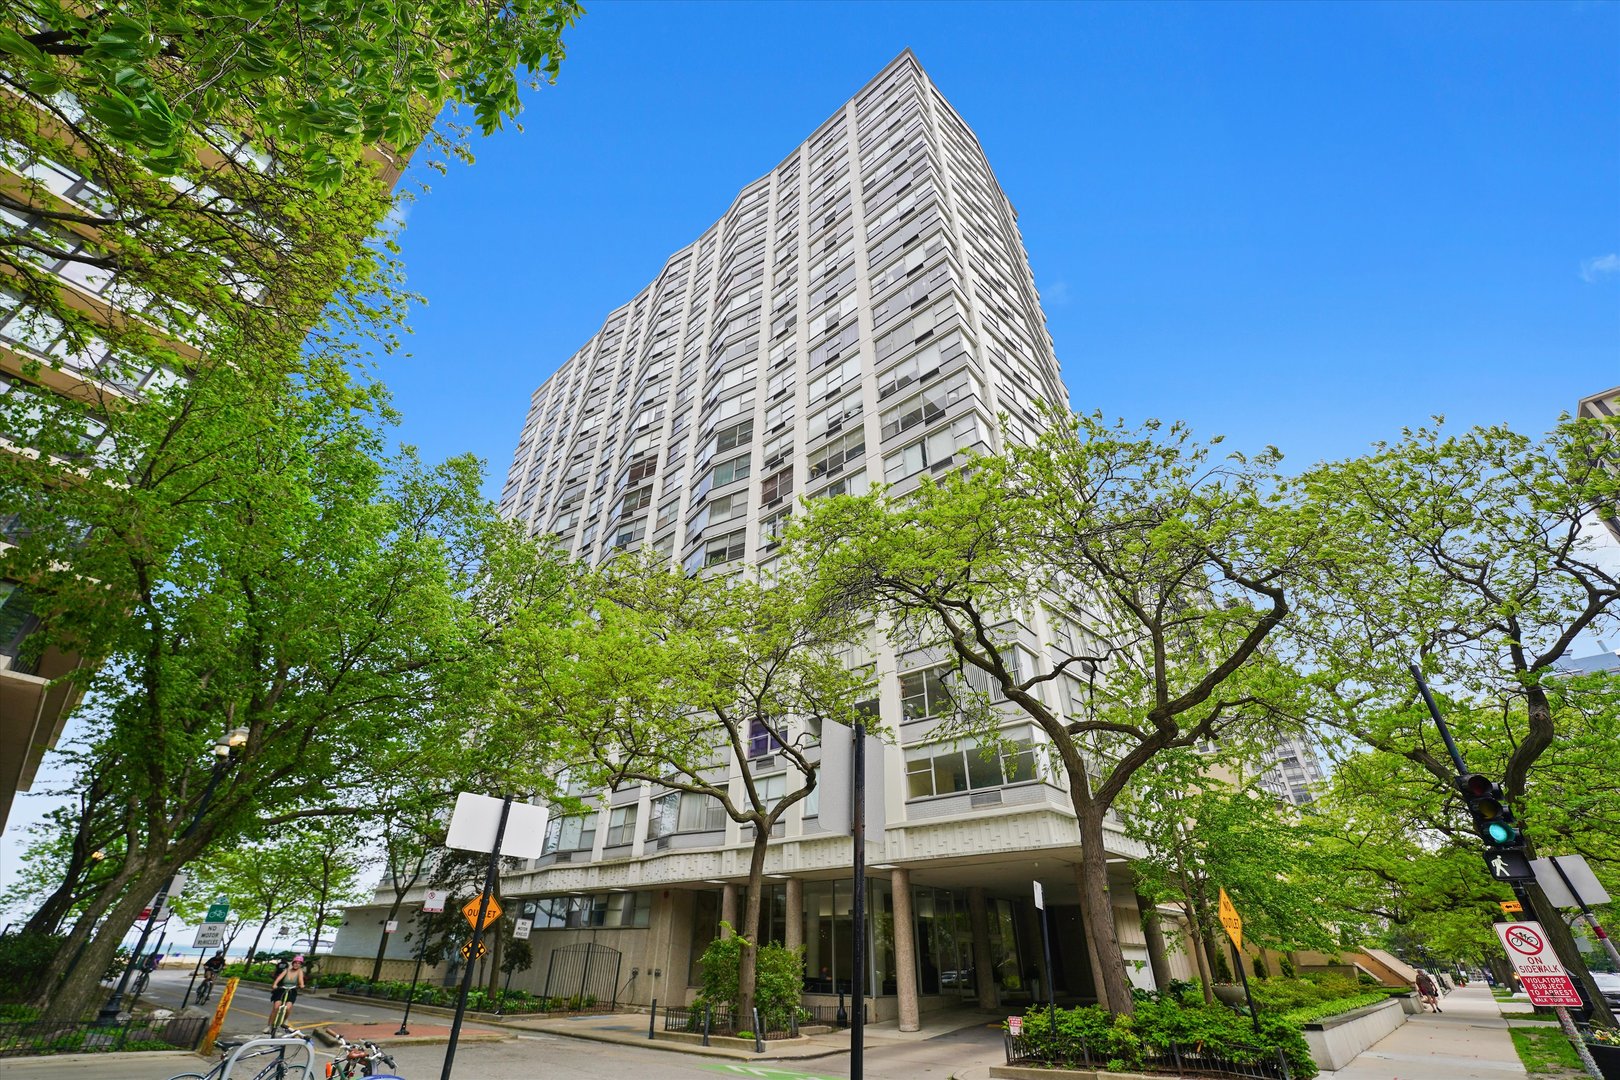
Active
$269,900
1
bds
|
1
ba
|
1,000
sqft
|
built
1967
6007 N Sheridan Rd, Chicago, IL 60660
$-778
Cash flow
-15.0%
Cash-on-Cash Return
2.8%
Cap rate
0.9%
Rent to Value Ratio
Active
$39,000
3
bds
|
1
ba
|
971
sqft
|
built
1876
6641 S Green St, Chicago, IL 60621
$1,329
Cash flow
39.7%
Cash-on-Cash Return
40.9%
Cap rate
5.1%
Rent to Value Ratio
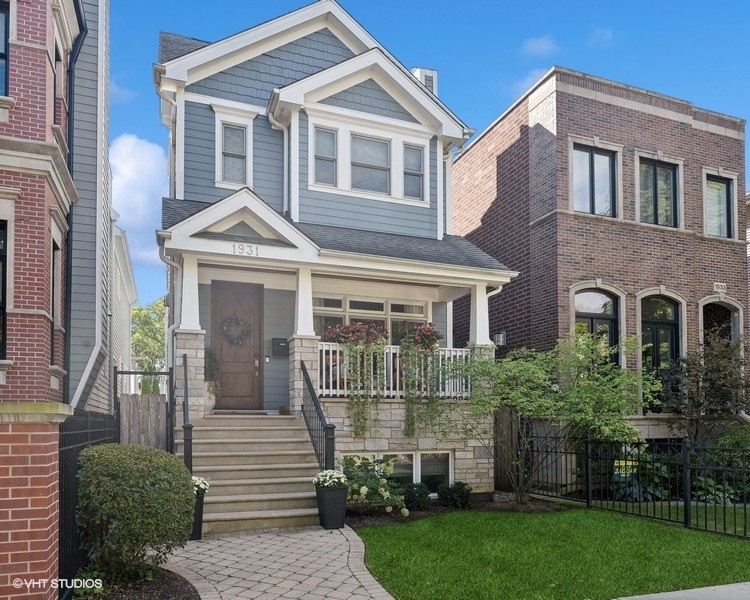
Active under contract
$1,595,000
3
bds
|
5
ba
|
4,200
sqft
|
built
2011
1931 W Barry Ave, Chicago, IL 60657
$-4,152
Cash flow
-13.6%
Cash-on-Cash Return
3.2%
Cap rate
0.6%
Rent to Value Ratio
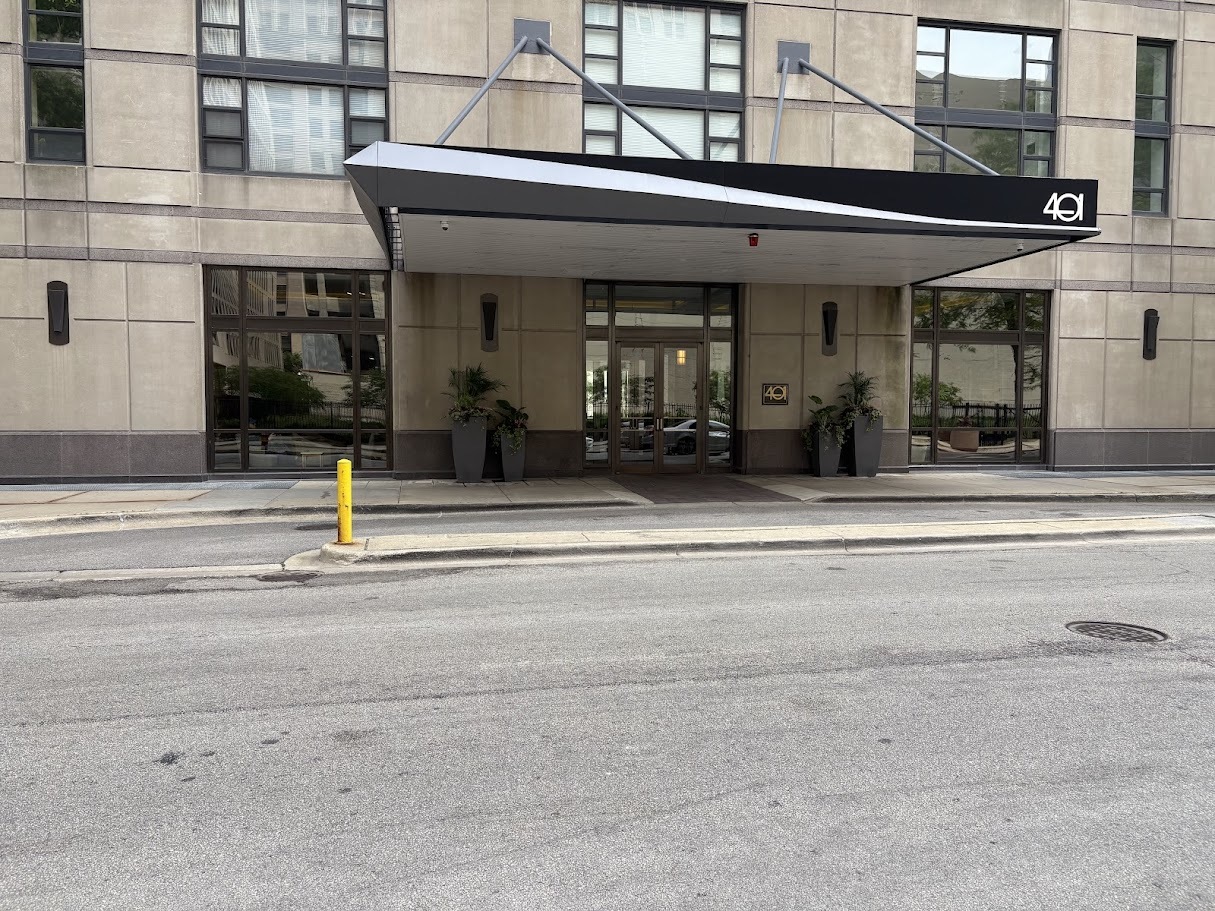
Active
$290,000
1
bds
|
1
ba
|
800
sqft
|
built
1989
401 E Ontario St, Chicago, IL 60611
$-1,013
Cash flow
-18.2%
Cash-on-Cash Return
2.1%
Cap rate
0.8%
Rent to Value Ratio
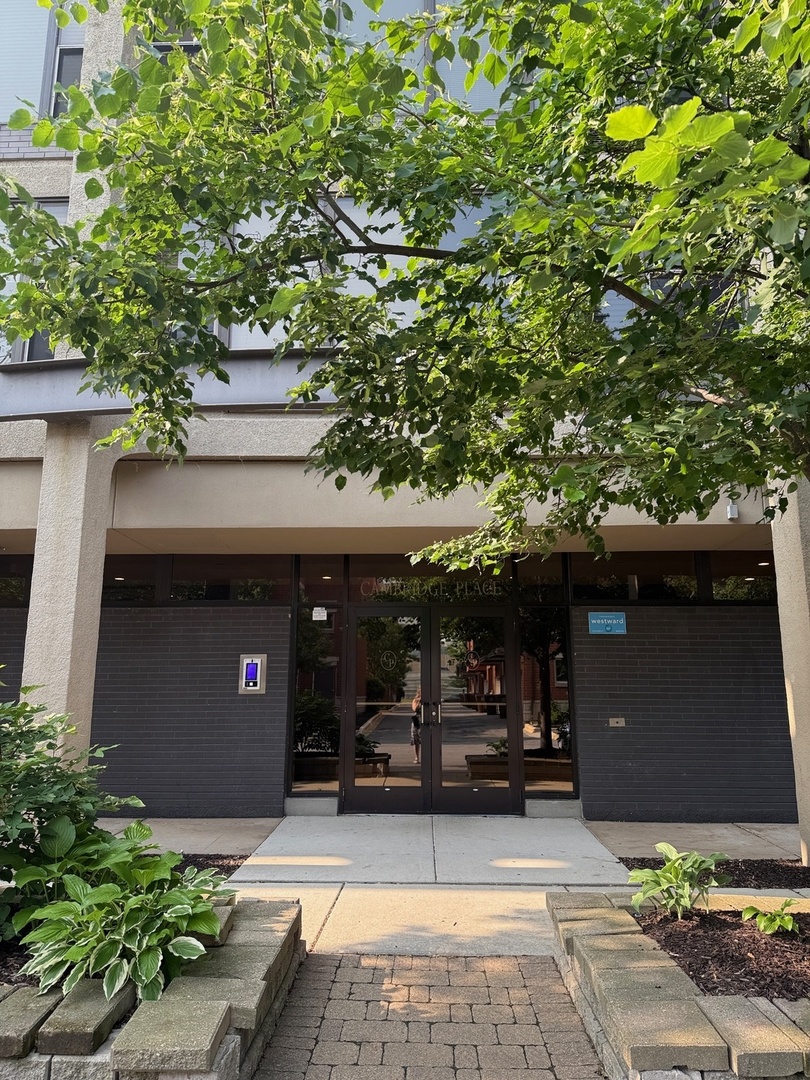
Active
$150,000
1
bds
|
1
ba
|
527
sqft
|
built
1968
345 E Eastgate Pl, Chicago, IL 60616
$58
Cash flow
2.0%
Cash-on-Cash Return
6.8%
Cap rate
1.5%
Rent to Value Ratio
Active
$209,000
4
bds
|
2
ba
|
0
sqft
|
built
1900
4514 S Honore St, Chicago, IL 60609
$-105
Cash flow
-2.6%
Cash-on-Cash Return
5.7%
Cap rate
0.8%
Rent to Value Ratio
Active
$345,000
1
bds
|
1
ba
|
0
sqft
|
built
2002
2 E Erie St, Chicago, IL 60611
$-1,154
Cash flow
-17.5%
Cash-on-Cash Return
2.3%
Cap rate
0.7%
Rent to Value Ratio
Active
$1,035,000
3
bds
|
4
ba
|
2,700
sqft
|
built
2019
3731 W Lyndale St, Chicago, IL 60647
$-1,932
Cash flow
-9.7%
Cash-on-Cash Return
4.0%
Cap rate
0.6%
Rent to Value Ratio
Active
$330,000
1
bds
|
1
ba
|
0
sqft
|
built
2003
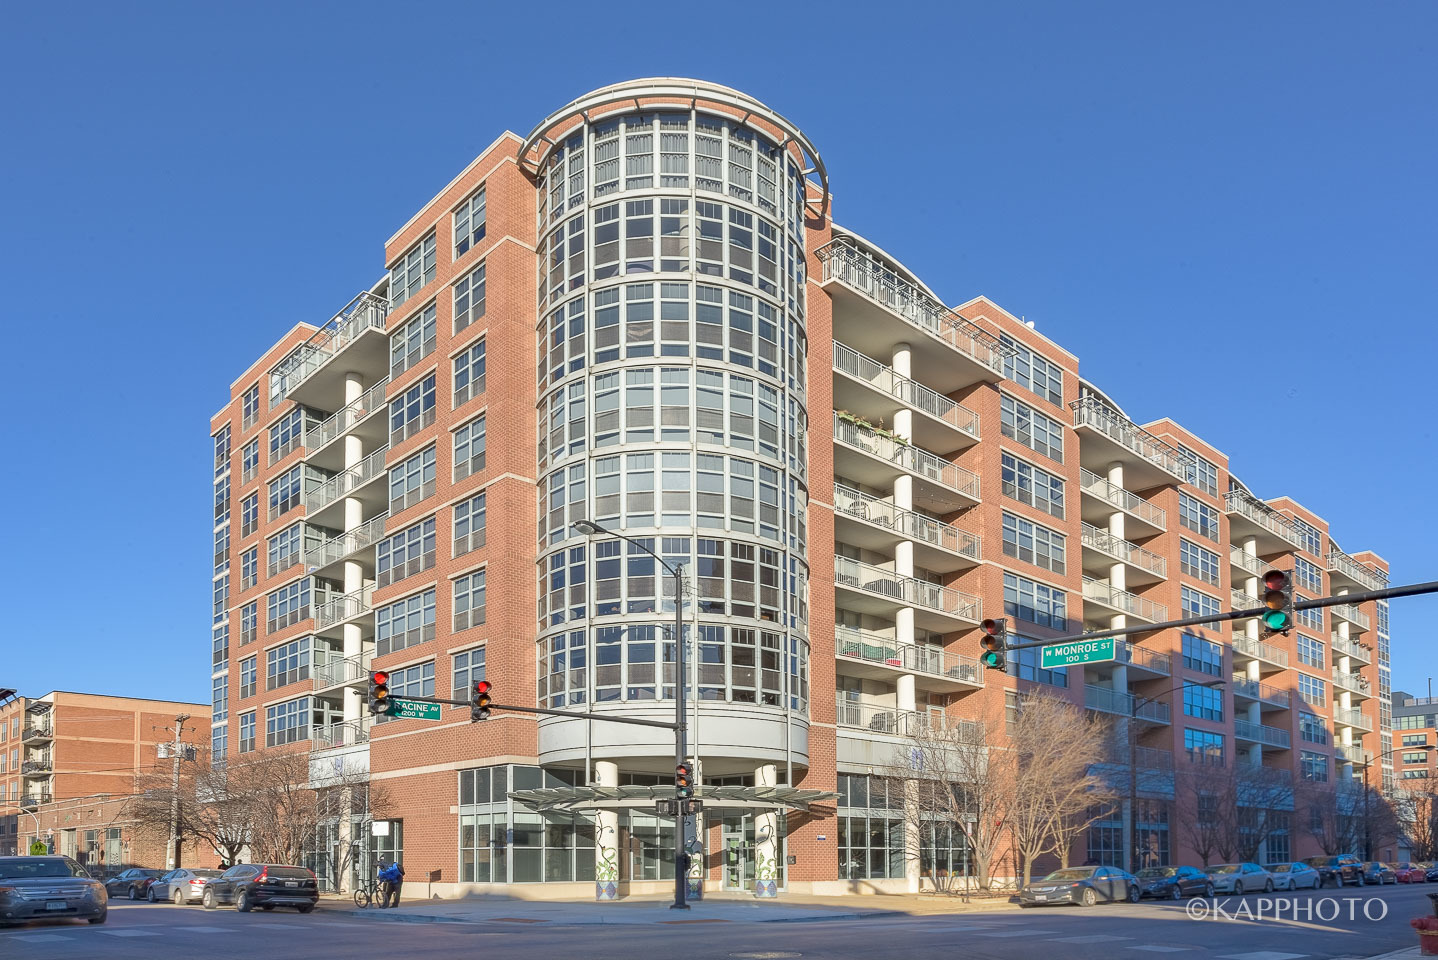
1200 W Monroe St, Chicago, IL 60607
$-1,022
Cash flow
-16.2%
Cash-on-Cash Return
2.6%
Cap rate
0.8%
Rent to Value Ratio
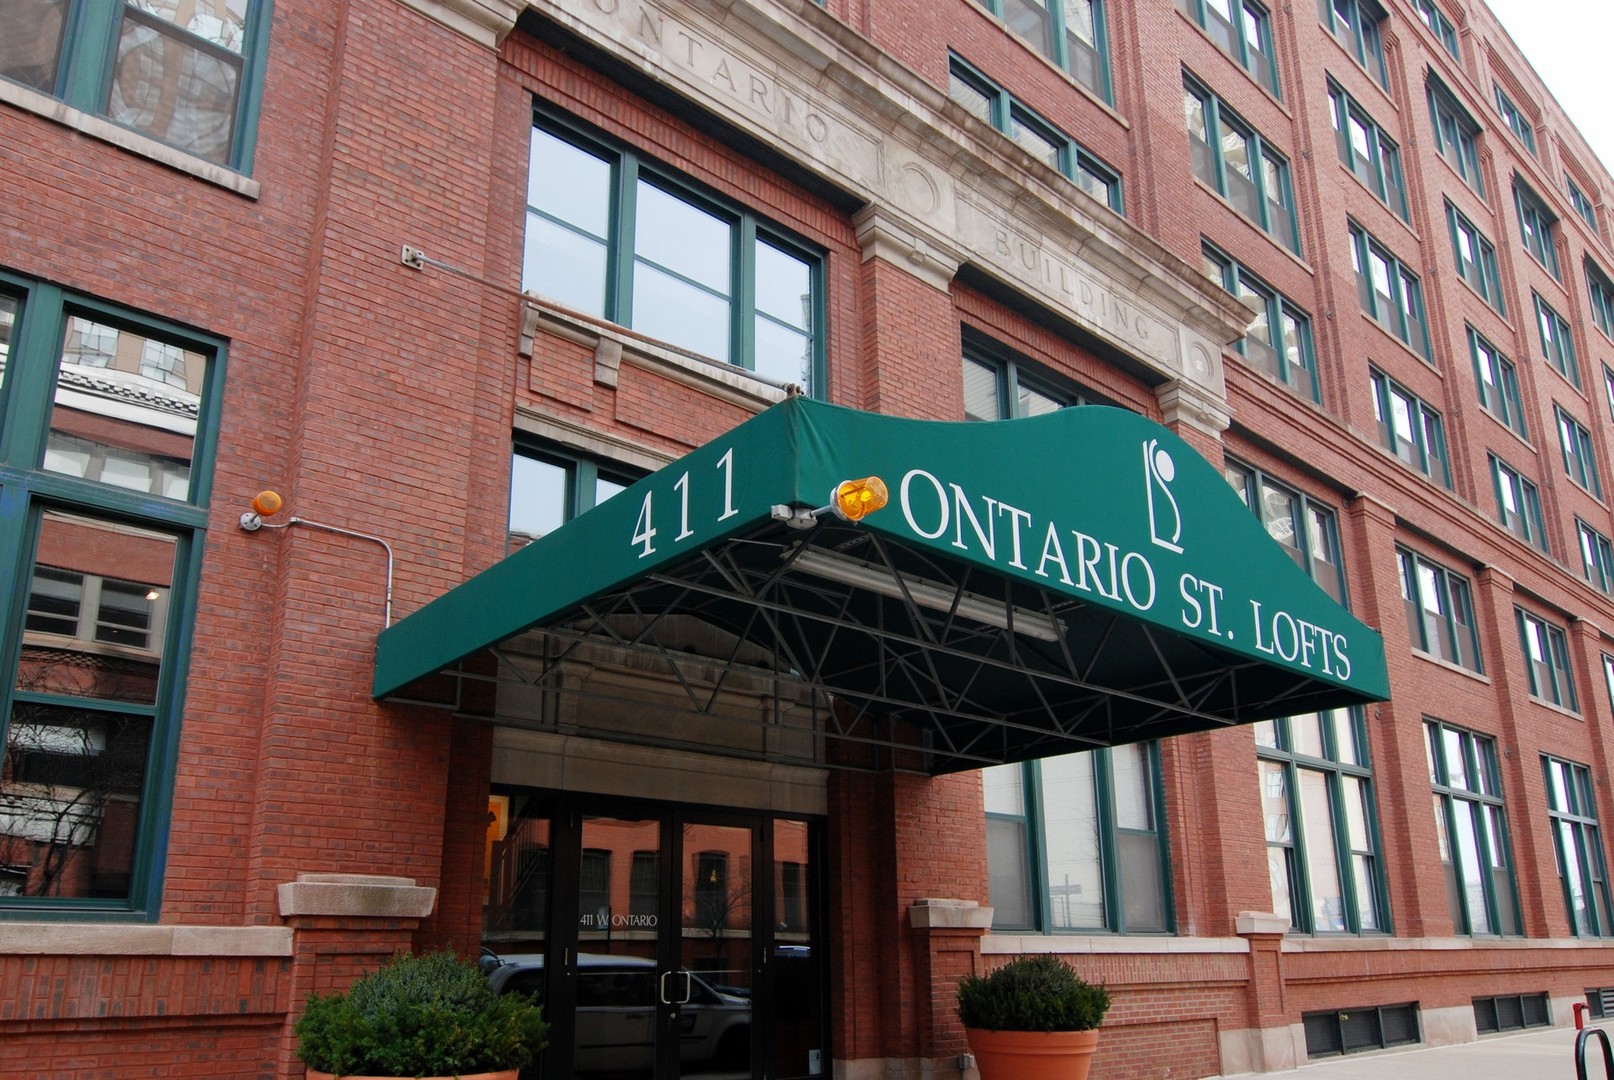
Active under contract
$439,000
2
bds
|
2
ba
|
0
sqft
|
built
1910
411 W Ontario St, Chicago, IL 60654
$-1,083
Cash flow
-12.9%
Cash-on-Cash Return
3.3%
Cap rate
0.9%
Rent to Value Ratio
Active
$349,900
2
bds
|
1
ba
|
950
sqft
|
built
1929
3150 N Sheffield Ave, Chicago, IL 60657
$-619
Cash flow
-9.2%
Cash-on-Cash Return
4.2%
Cap rate
0.8%
Rent to Value Ratio
Active
$625,000
3
bds
|
2
ba
|
0
sqft
|
built
1994
2801 N Wolcott Ave, Chicago, IL 60657
$-1,836
Cash flow
-15.3%
Cash-on-Cash Return
2.8%
Cap rate
0.6%
Rent to Value Ratio
Active under contract
$399,900
4
bds
|
3
ba
|
1,600
sqft
|
built
1948
5520 S Kildare Ave, Chicago, IL 60629
$-793
Cash flow
-10.3%
Cash-on-Cash Return
3.9%
Cap rate
0.6%
Rent to Value Ratio
Active
$479,000
2
bds
|
2
ba
|
1,200
sqft
|
built
1997
600 N Dearborn St, Chicago, IL 60654
$-1,679
Cash flow
-18.3%
Cash-on-Cash Return
2.1%
Cap rate
0.8%
Rent to Value Ratio
Active
$224,000
4
bds
|
2
ba
|
0
sqft
|
built
1914
7621 S Eberhart Ave, Chicago, IL 60619
$204
Cash flow
4.8%
Cash-on-Cash Return
7.4%
Cap rate
1.0%
Rent to Value Ratio
Active
$420,000
2
bds
|
2
ba
|
1,107
sqft
|
built
1923
3708 N Oketo Ave, Chicago, IL 60634
$-429
Cash flow
-5.3%
Cash-on-Cash Return
5.1%
Cap rate
0.7%
Rent to Value Ratio
Active under contract
$215,000
bds
|
1
ba
|
500
sqft
|
built
1962
300 N State St, Chicago, IL 60654
$-598
Cash flow
-14.5%
Cash-on-Cash Return
2.9%
Cap rate
0.9%
Rent to Value Ratio