Chicago, IL Investment Properties for Sale
Browse homes for sale and investment properties in Chicago, IL. Refine your search by price, property type, or more.
Best cash flowing properties in Chicago, IL
Active
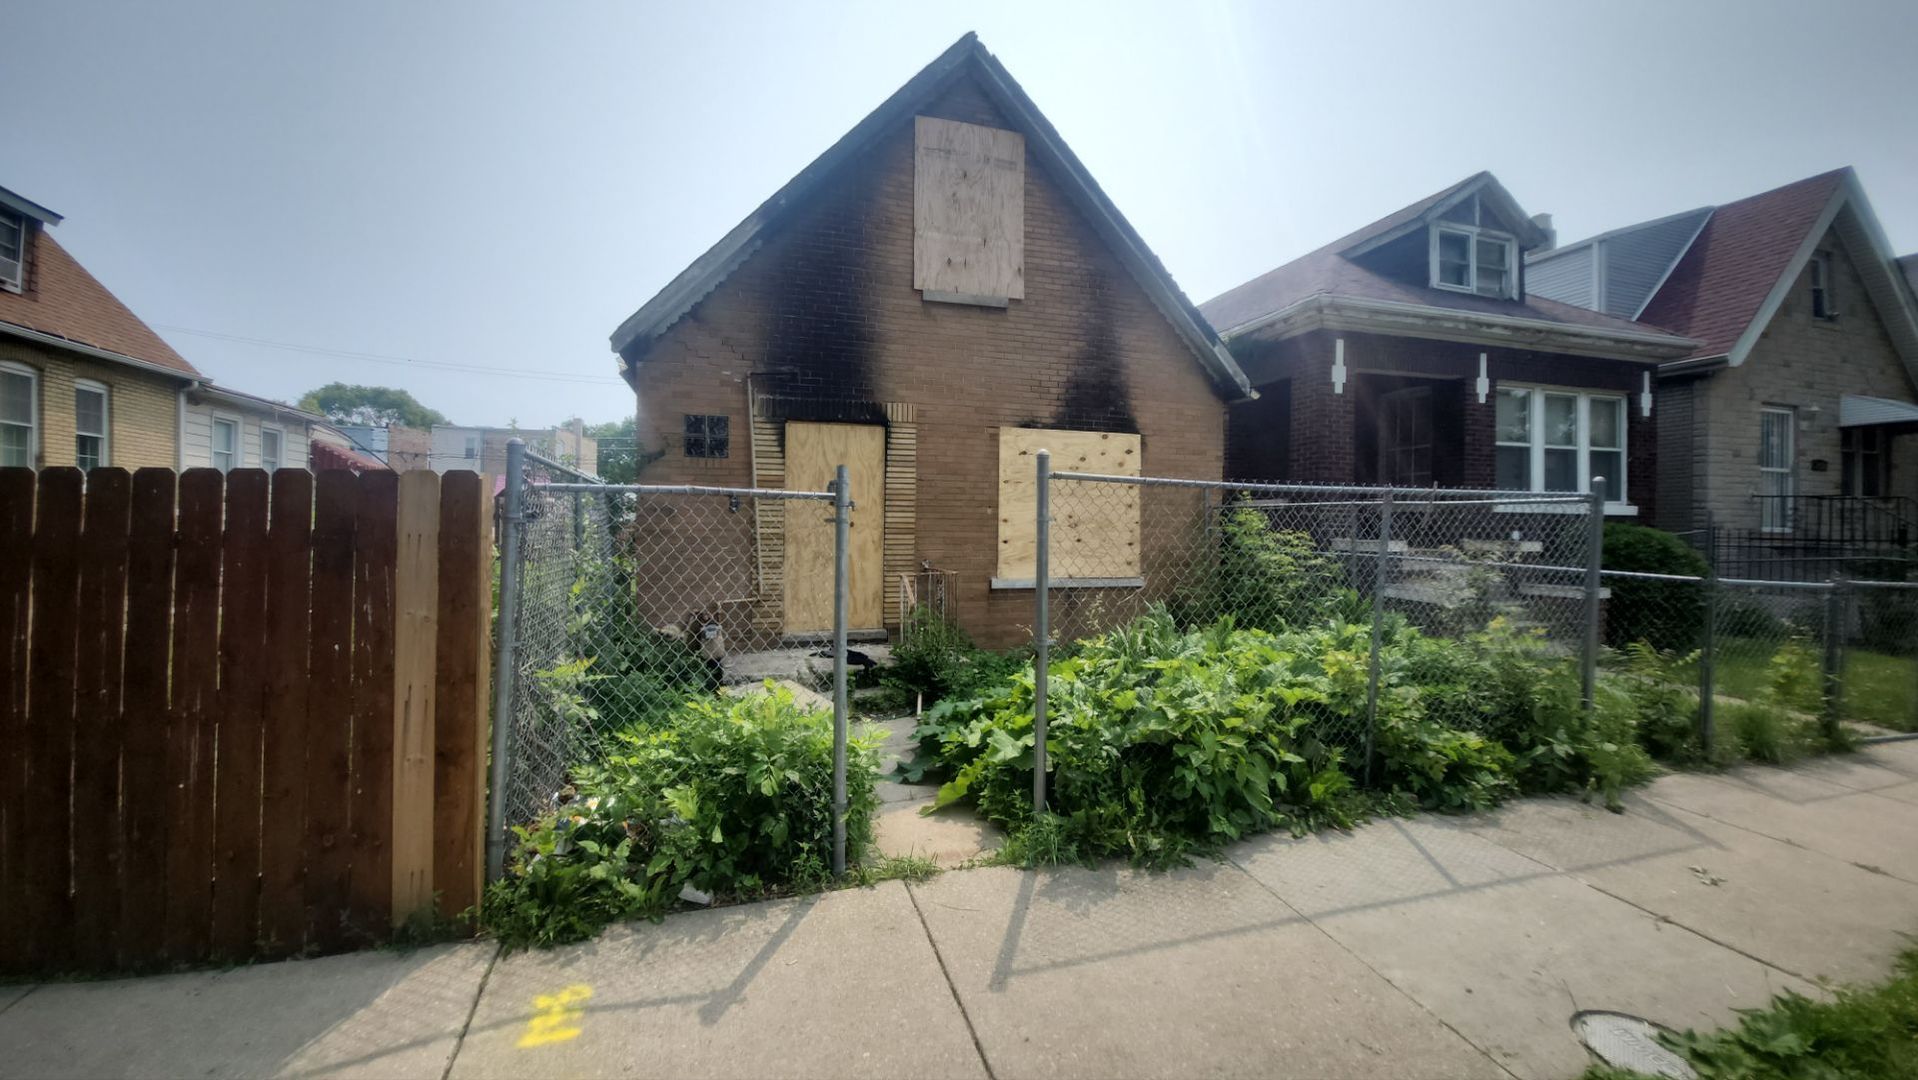
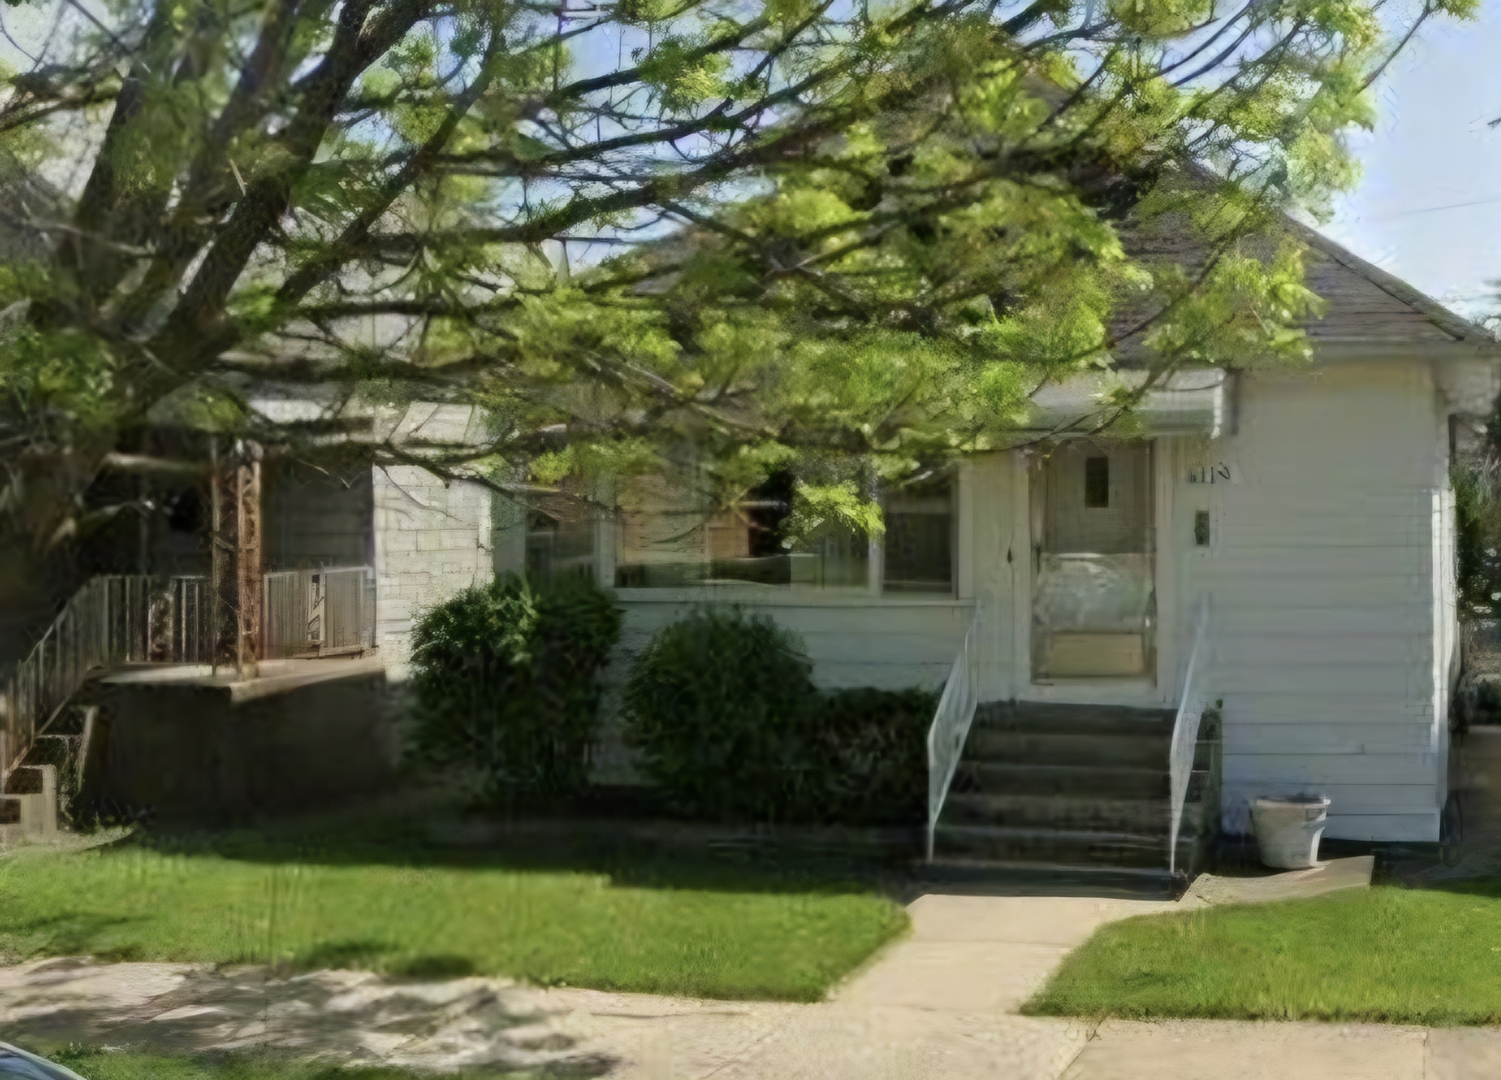
$74,700
3
bds
|
1
ba
|
1,008
sqft
|
built
1882
1017 N Avers Ave, Chicago, IL 60651
$1,312
Cash flow
20.5%
Cash-on-Cash Return
21.1%
Cap rate
2.9%
Rent to Value Ratio
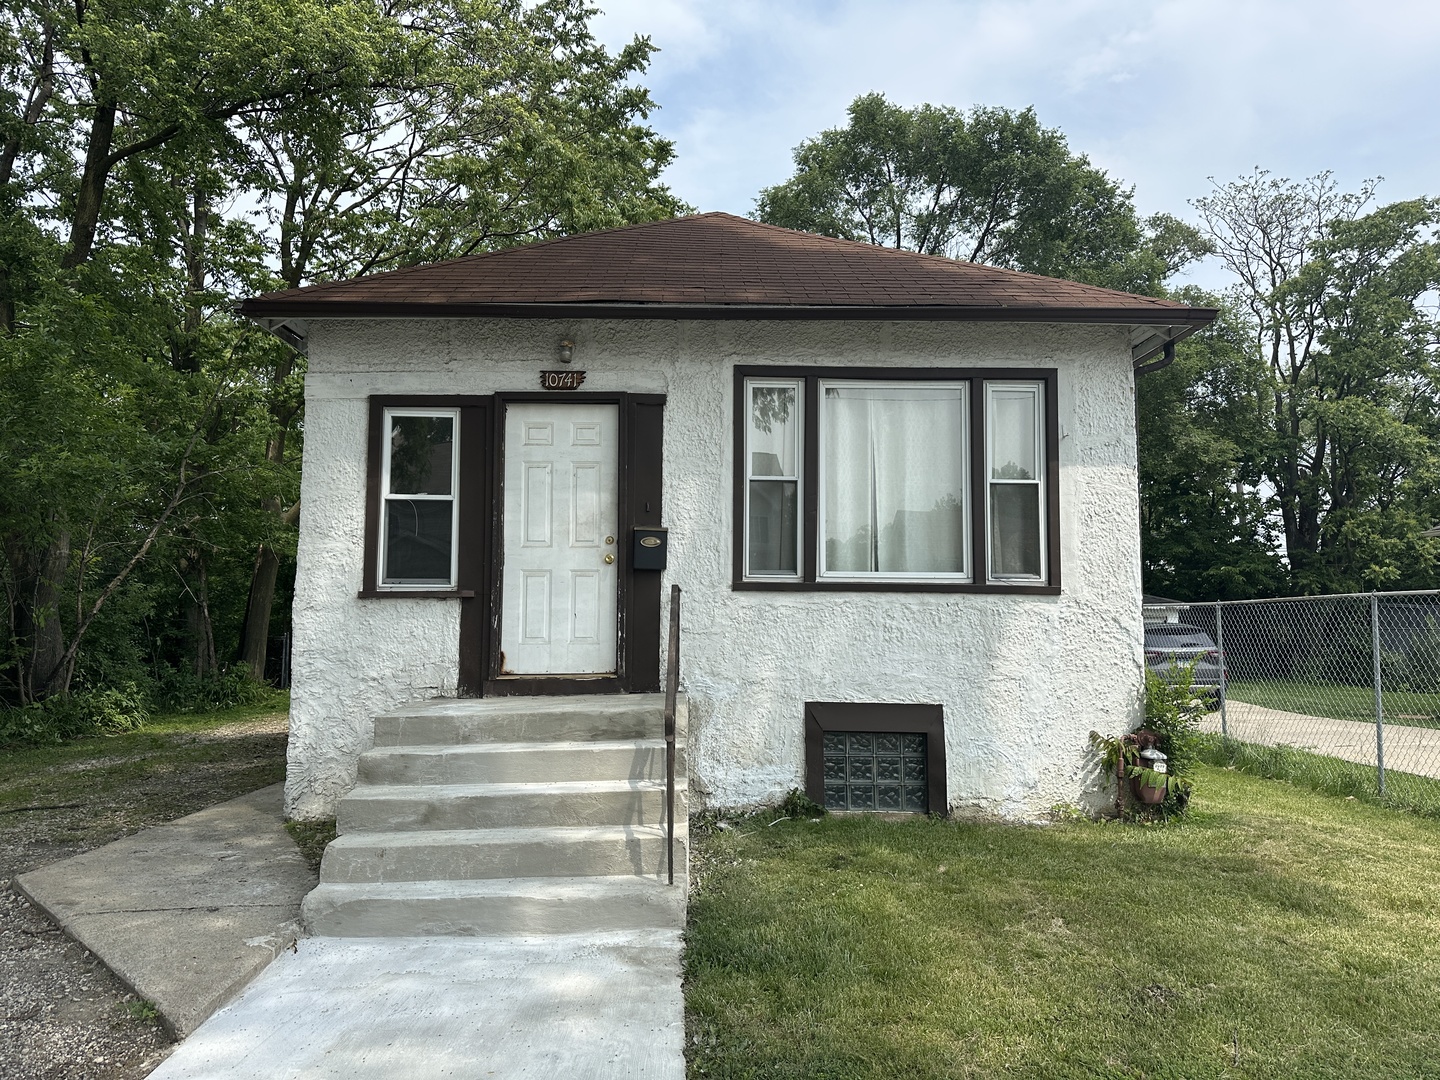
Active
$124,900
3
bds
|
1
ba
|
1,029
sqft
|
built
1917
10741 S Glenroy Ave, Chicago, IL 60643
$710
Cash flow
29.7%
Cash-on-Cash Return
12.5%
Cap rate
1.6%
Rent to Value Ratio
3,734 out of 4,286 properties for sale in Chicago, IL
Limited Results Shown
Create a free account, or log in to reveal all property listings and enjoy the complete experience.
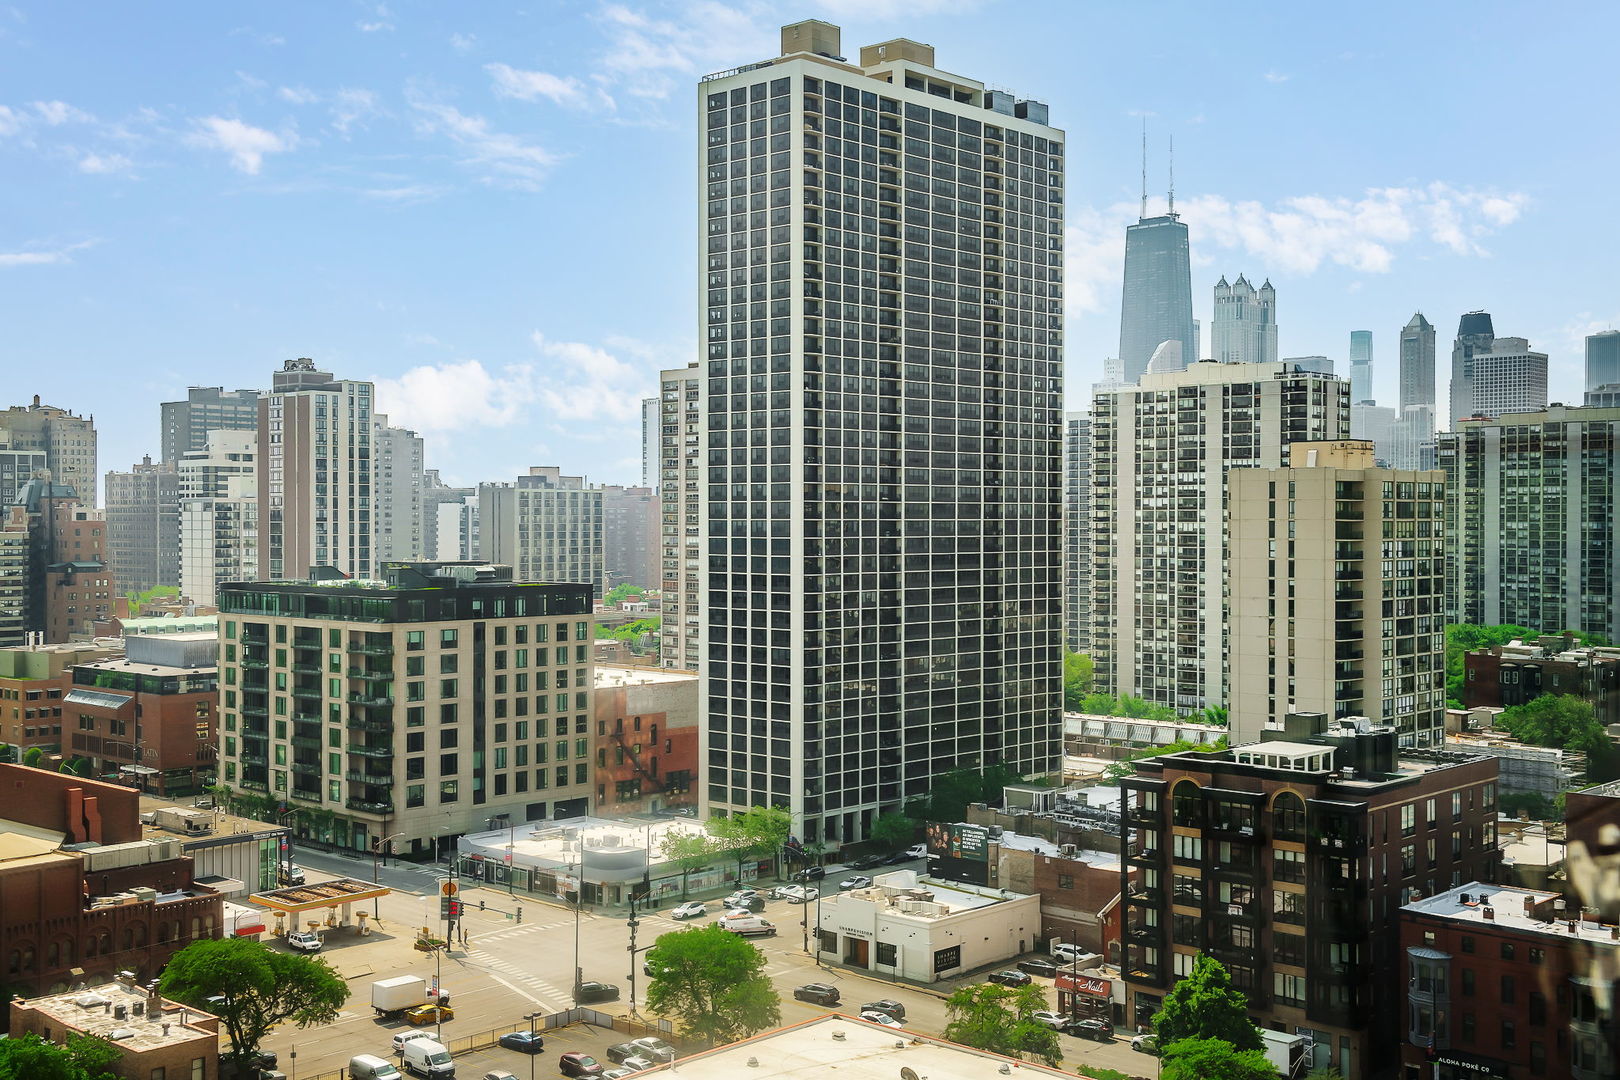
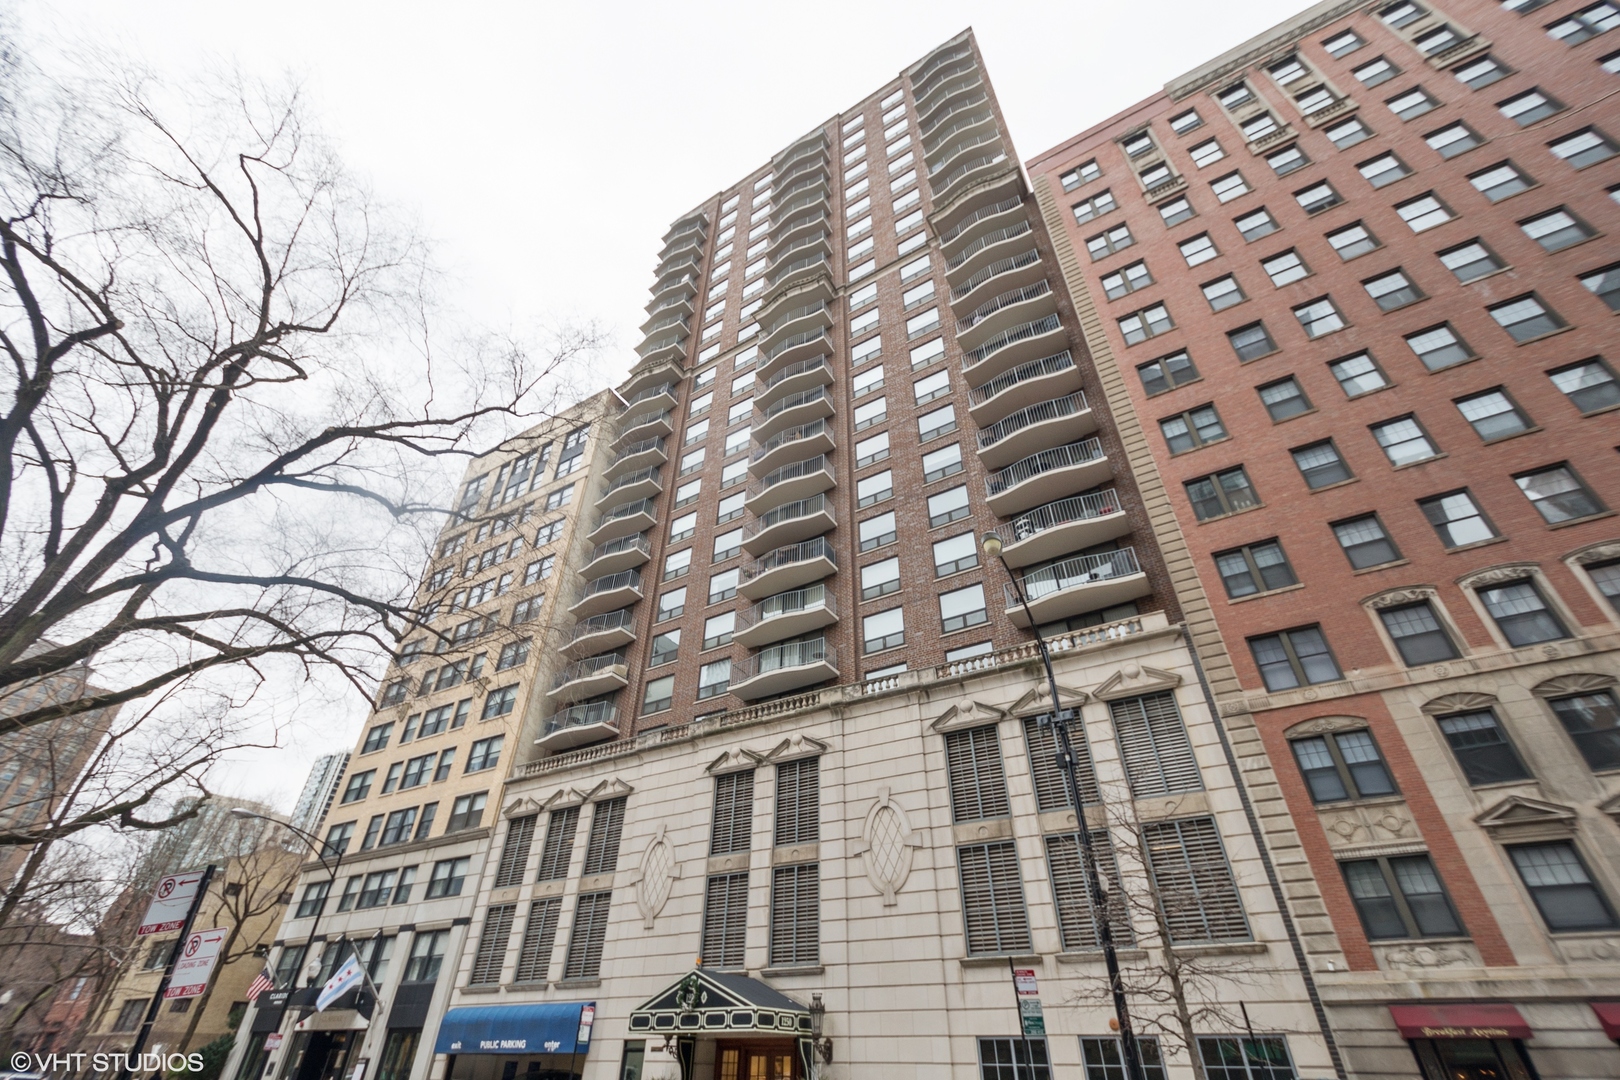
Active
$280,000
1
bds
|
1
ba
|
775
sqft
|
built
1971
1636 N Wells St, Chicago, IL 60614
$-850
Cash flow
-15.8%
Cash-on-Cash Return
2.0%
Cap rate
0.9%
Rent to Value Ratio
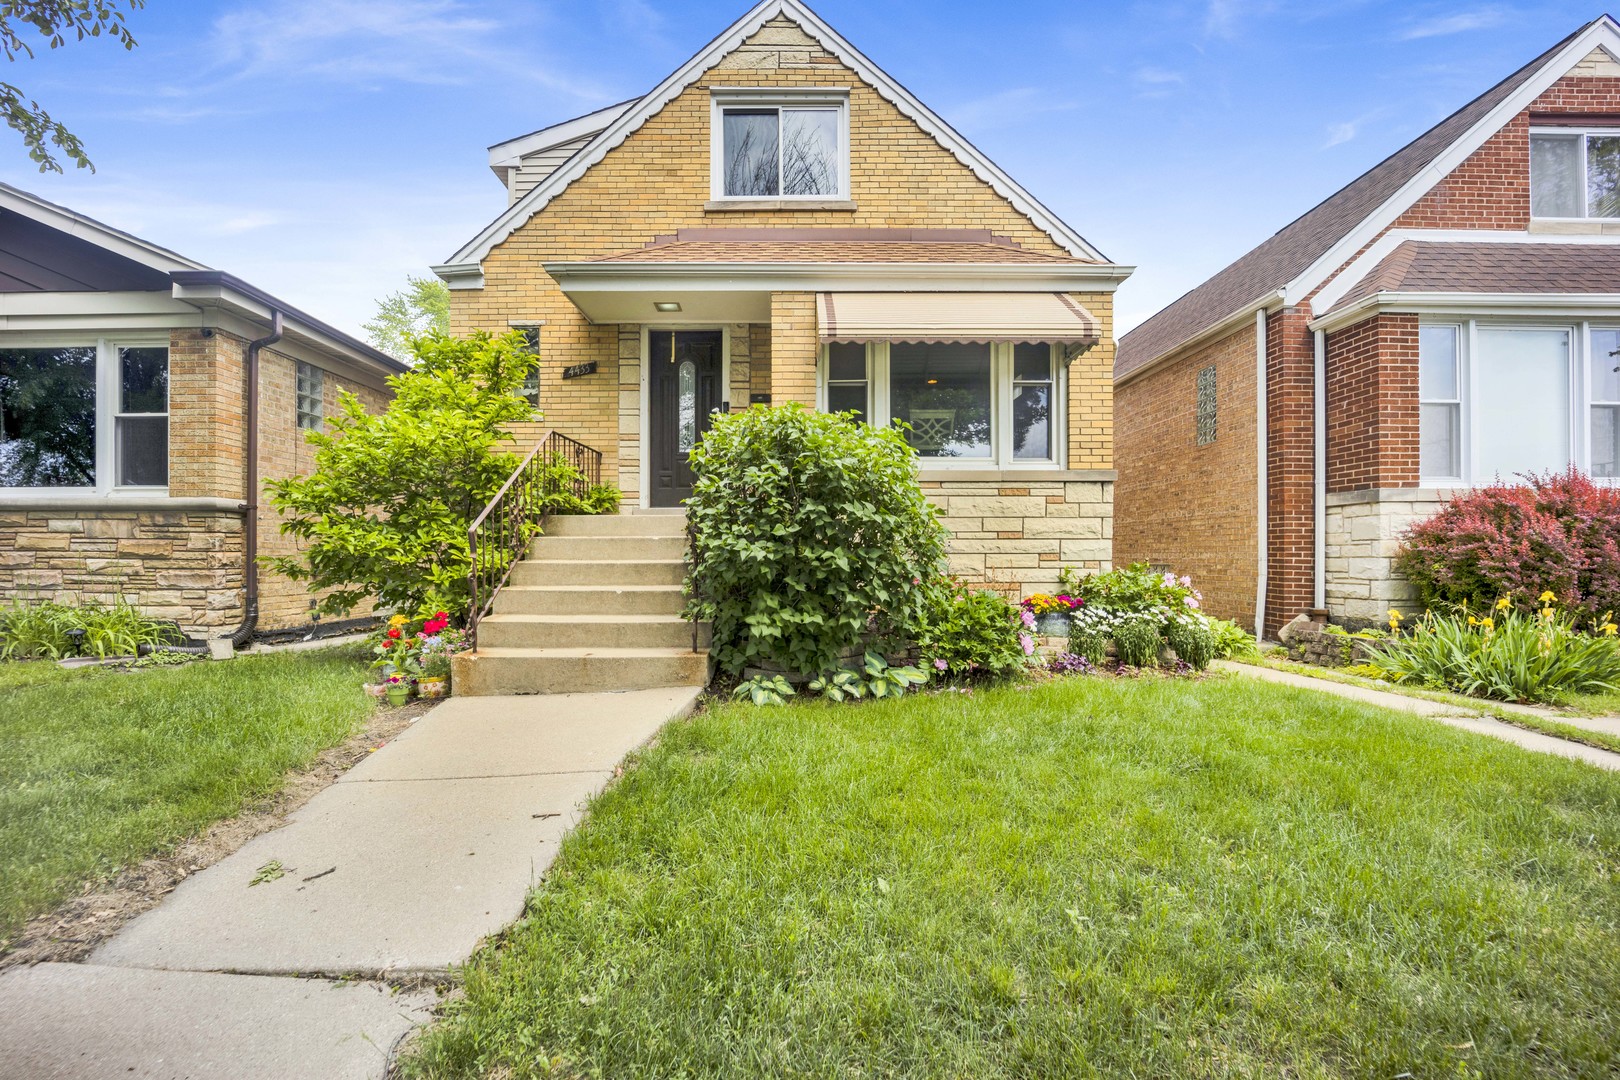
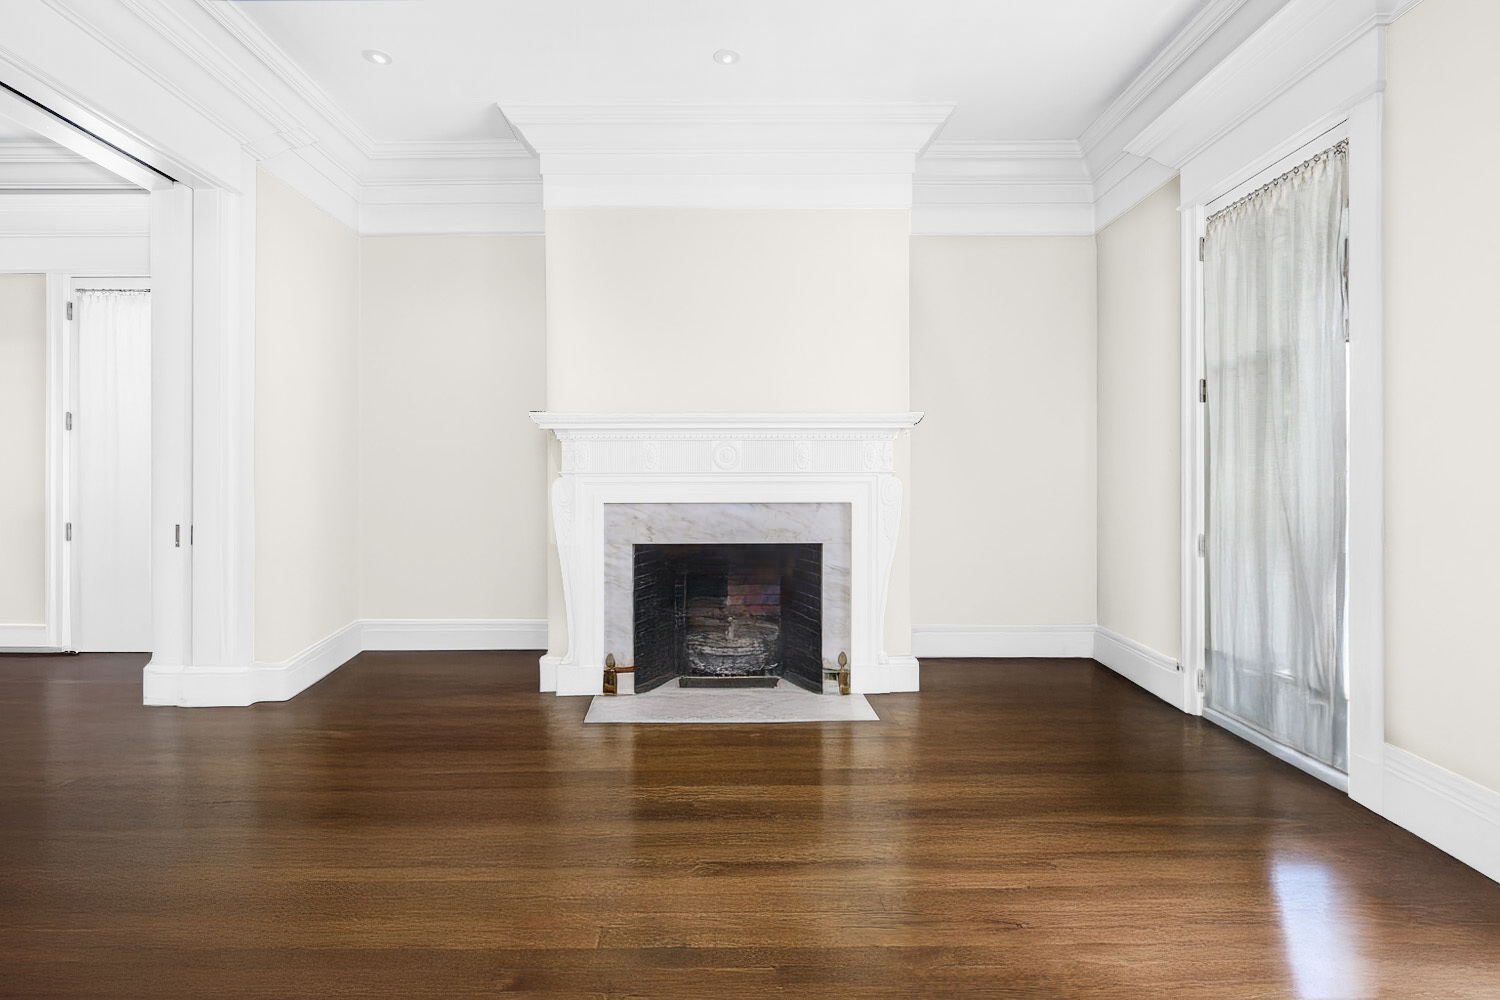
Active
$499,999
4
bds
|
3
ba
|
0
sqft
|
built
1953
4433 N Narragansett Ave, Chicago, IL 60630
$-619
Cash flow
-6.5%
Cash-on-Cash Return
4.2%
Cap rate
0.7%
Rent to Value Ratio
Active under contract
$329,000
2
bds
|
2
ba
|
1,095
sqft
|
built
1923
6119 W School St, Chicago, IL 60634
$10
Cash flow
0.2%
Cash-on-Cash Return
5.7%
Cap rate
0.9%
Rent to Value Ratio
Active
$499,900
2
bds
|
2
ba
|
1,250
sqft
|
built
1988
1250 N Dearborn St, Chicago, IL 60610
$-1,628
Cash flow
-17.0%
Cash-on-Cash Return
1.8%
Cap rate
0.8%
Rent to Value Ratio
Active
$5,300,000
4
bds
|
7
ba
|
7,252
sqft
|
built
1997
401 W Dickens Ave, Chicago, IL 60614
$-25,701
Cash flow
-25.3%
Cash-on-Cash Return
-0.1%
Cap rate
0.2%
Rent to Value Ratio
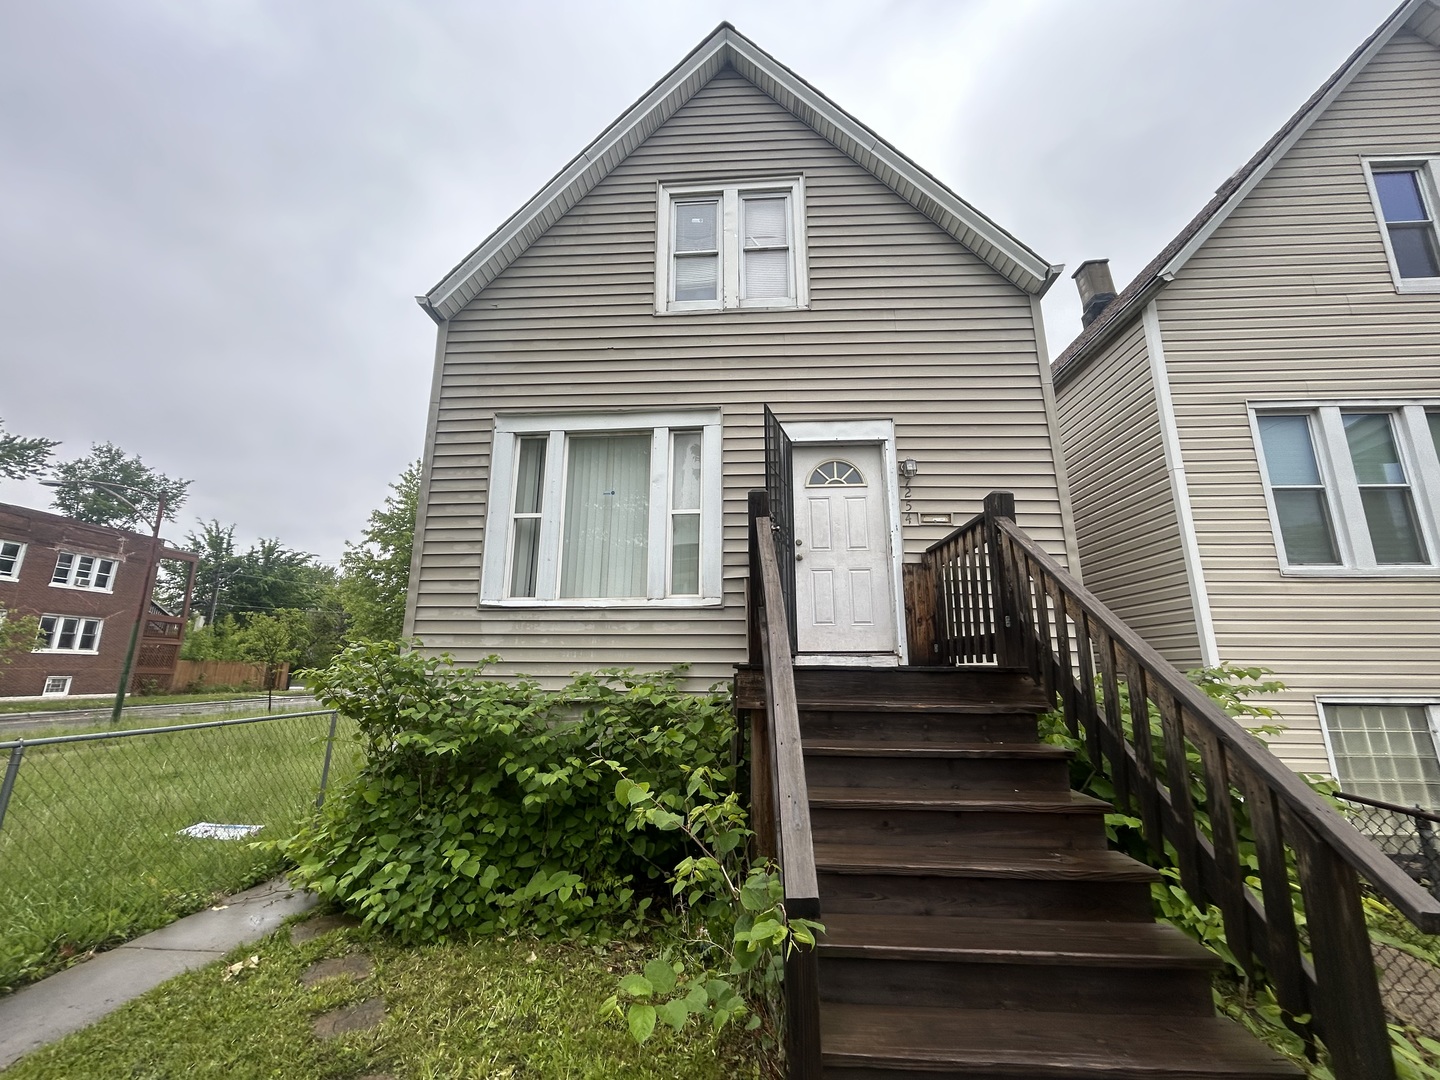
Active
$169,900
5
bds
|
2
ba
|
0
sqft
|
built
1899
7254 S Morgan St, Chicago, IL 60621
$509
Cash flow
15.6%
Cash-on-Cash Return
9.3%
Cap rate
1.2%
Rent to Value Ratio
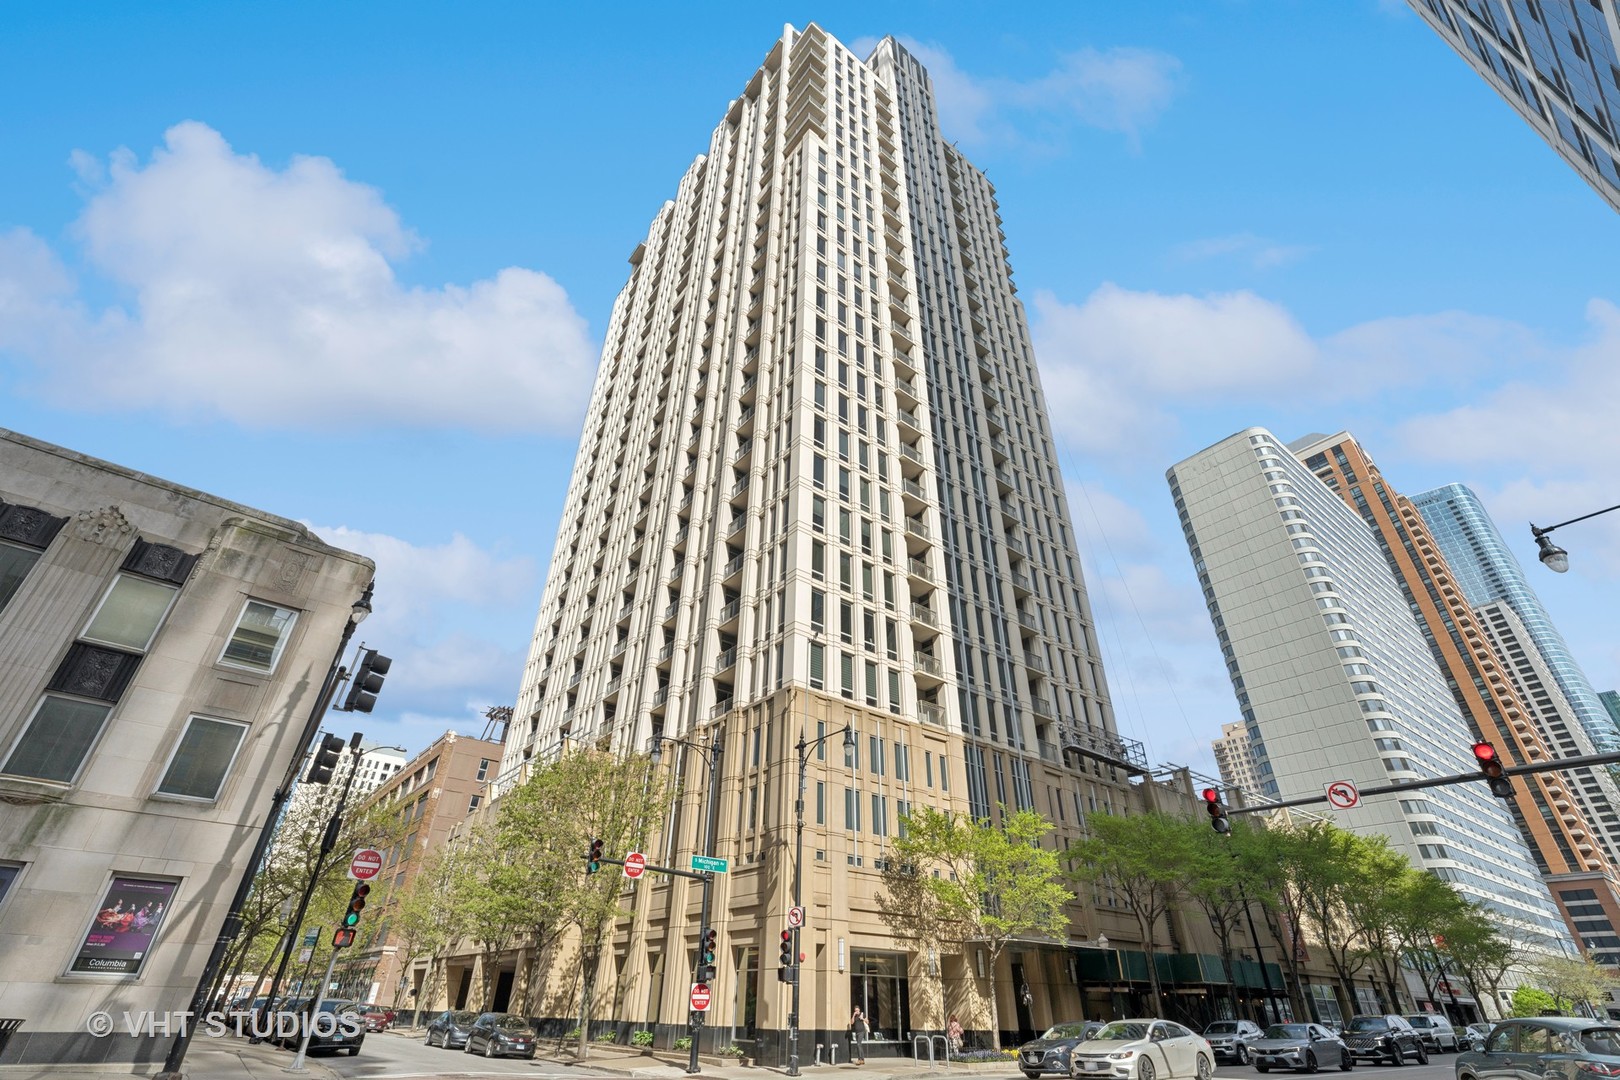
Active
$299,900
1
bds
|
1
ba
|
853
sqft
|
built
2005
1250 S Michigan Ave, Chicago, IL 60605
$-637
Cash flow
-11.1%
Cash-on-Cash Return
3.1%
Cap rate
0.8%
Rent to Value Ratio
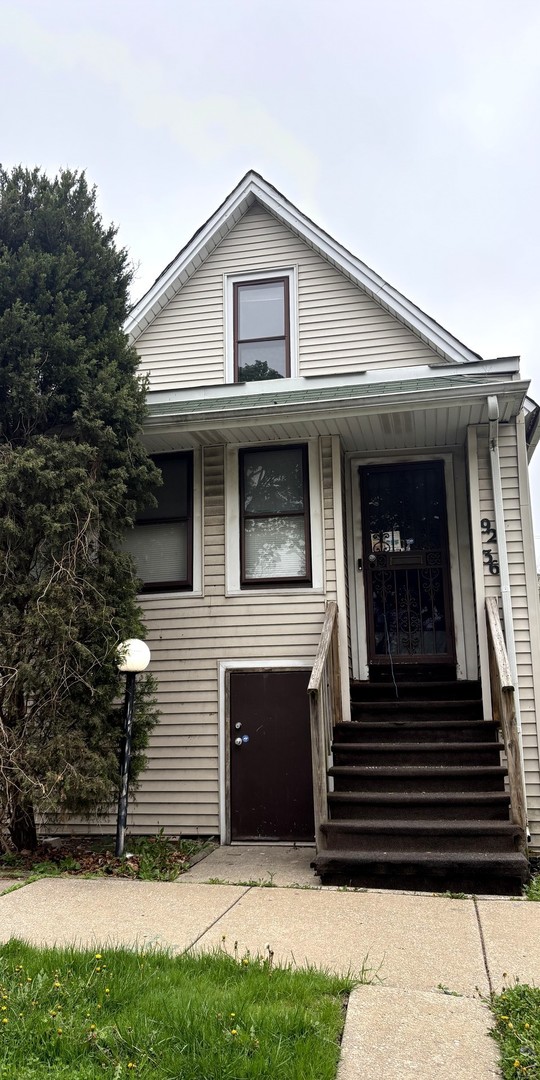
Active
$78,900
2
bds
|
1
ba
|
720
sqft
|
built
1898
9236 S Blackstone Ave, Chicago, IL 60619
$674
Cash flow
44.6%
Cash-on-Cash Return
15.9%
Cap rate
2.0%
Rent to Value Ratio
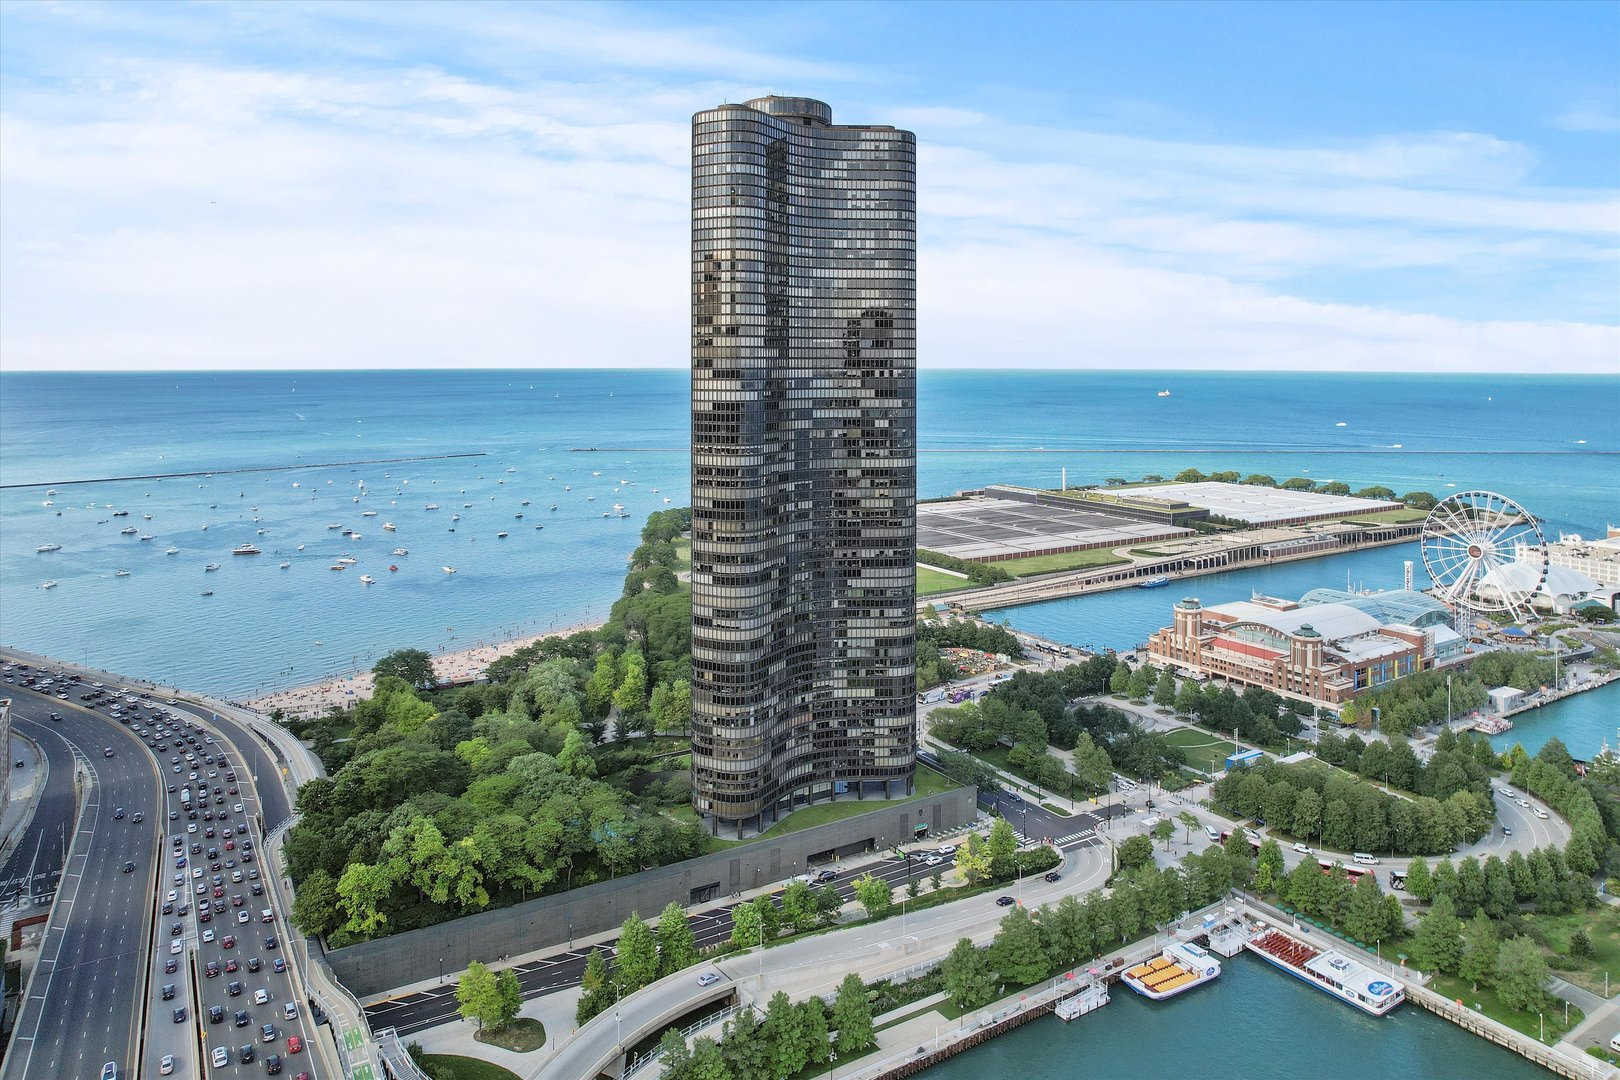
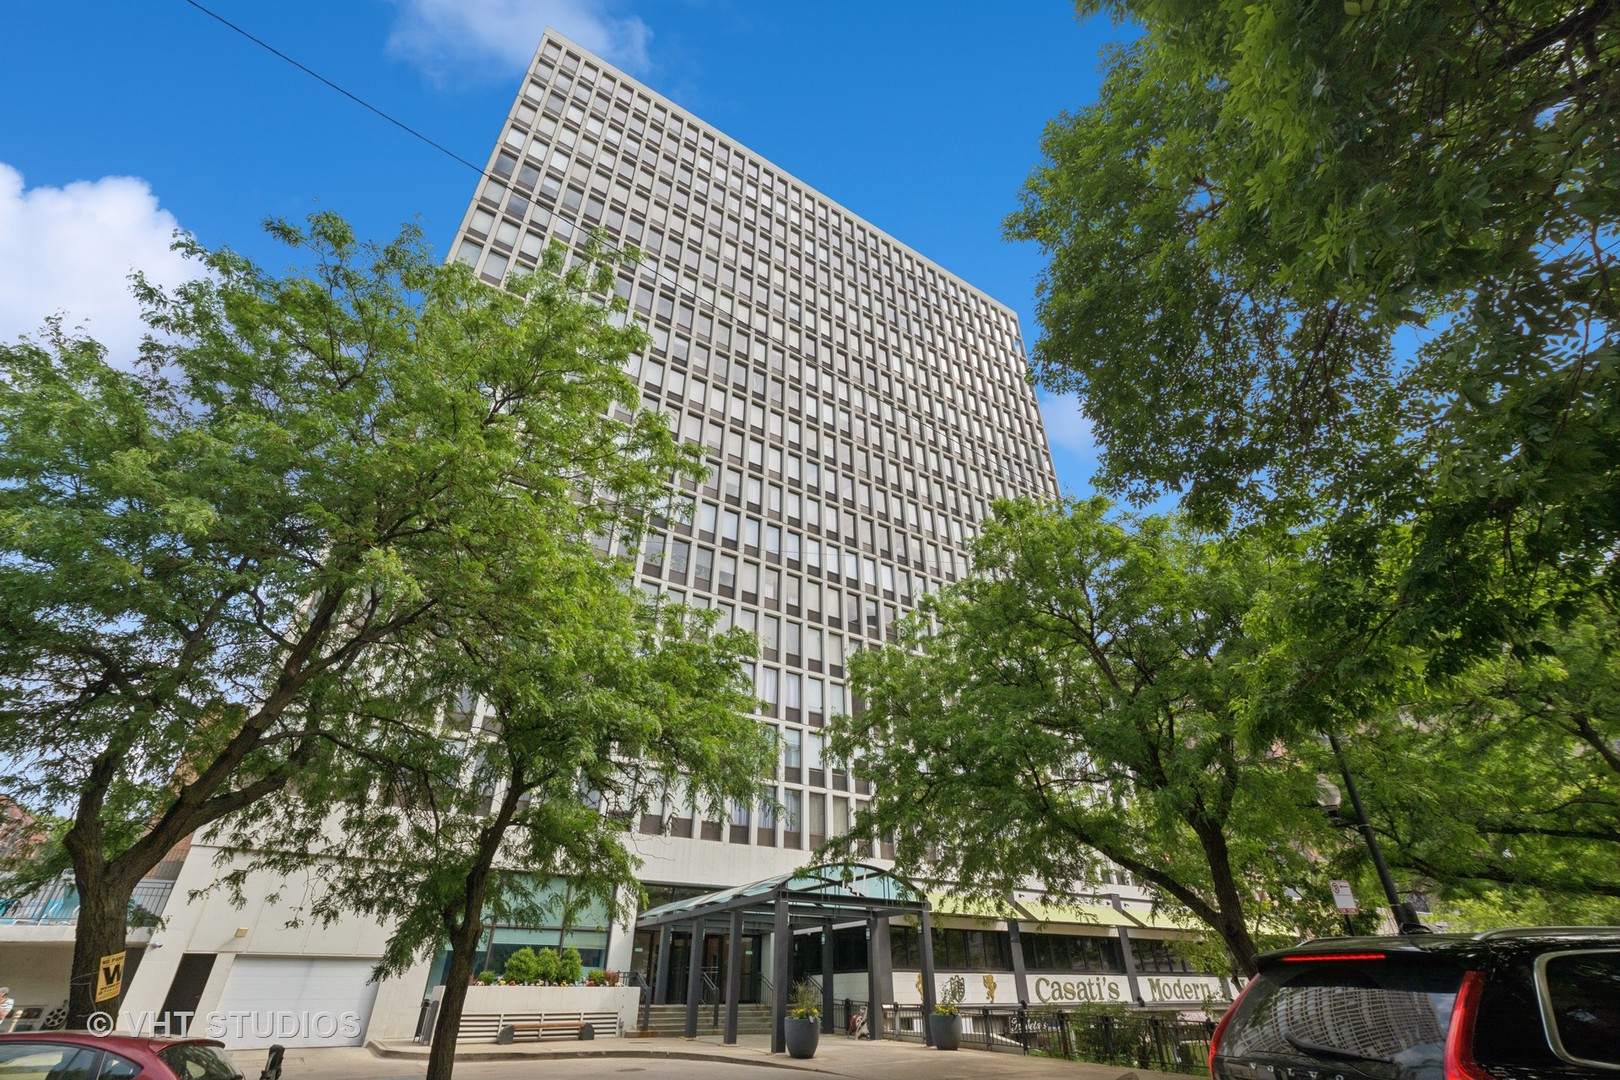
Active
$365,000
1
bds
|
1
ba
|
1,100
sqft
|
built
1968
505 N Lake Shore Dr, Chicago, IL 60611
$-1,250
Cash flow
-17.9%
Cash-on-Cash Return
1.6%
Cap rate
0.7%
Rent to Value Ratio
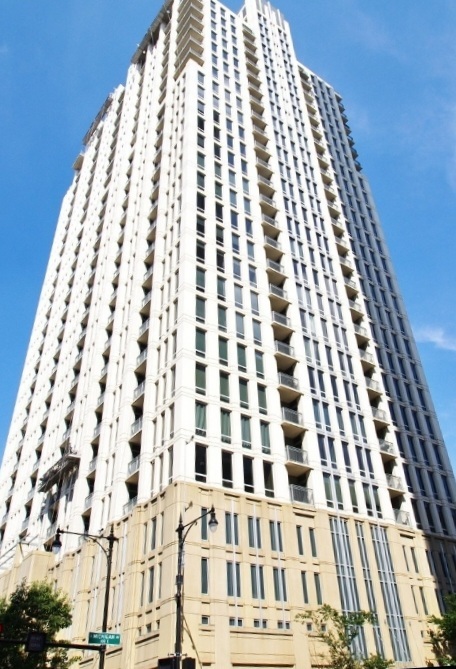
Active
$1,425,000
2
bds
|
3
ba
|
2,440
sqft
|
built
2012
118 E Erie St, Chicago, IL 60611
$-11,157
Cash flow
-40.8%
Cash-on-Cash Return
-3.7%
Cap rate
0.5%
Rent to Value Ratio
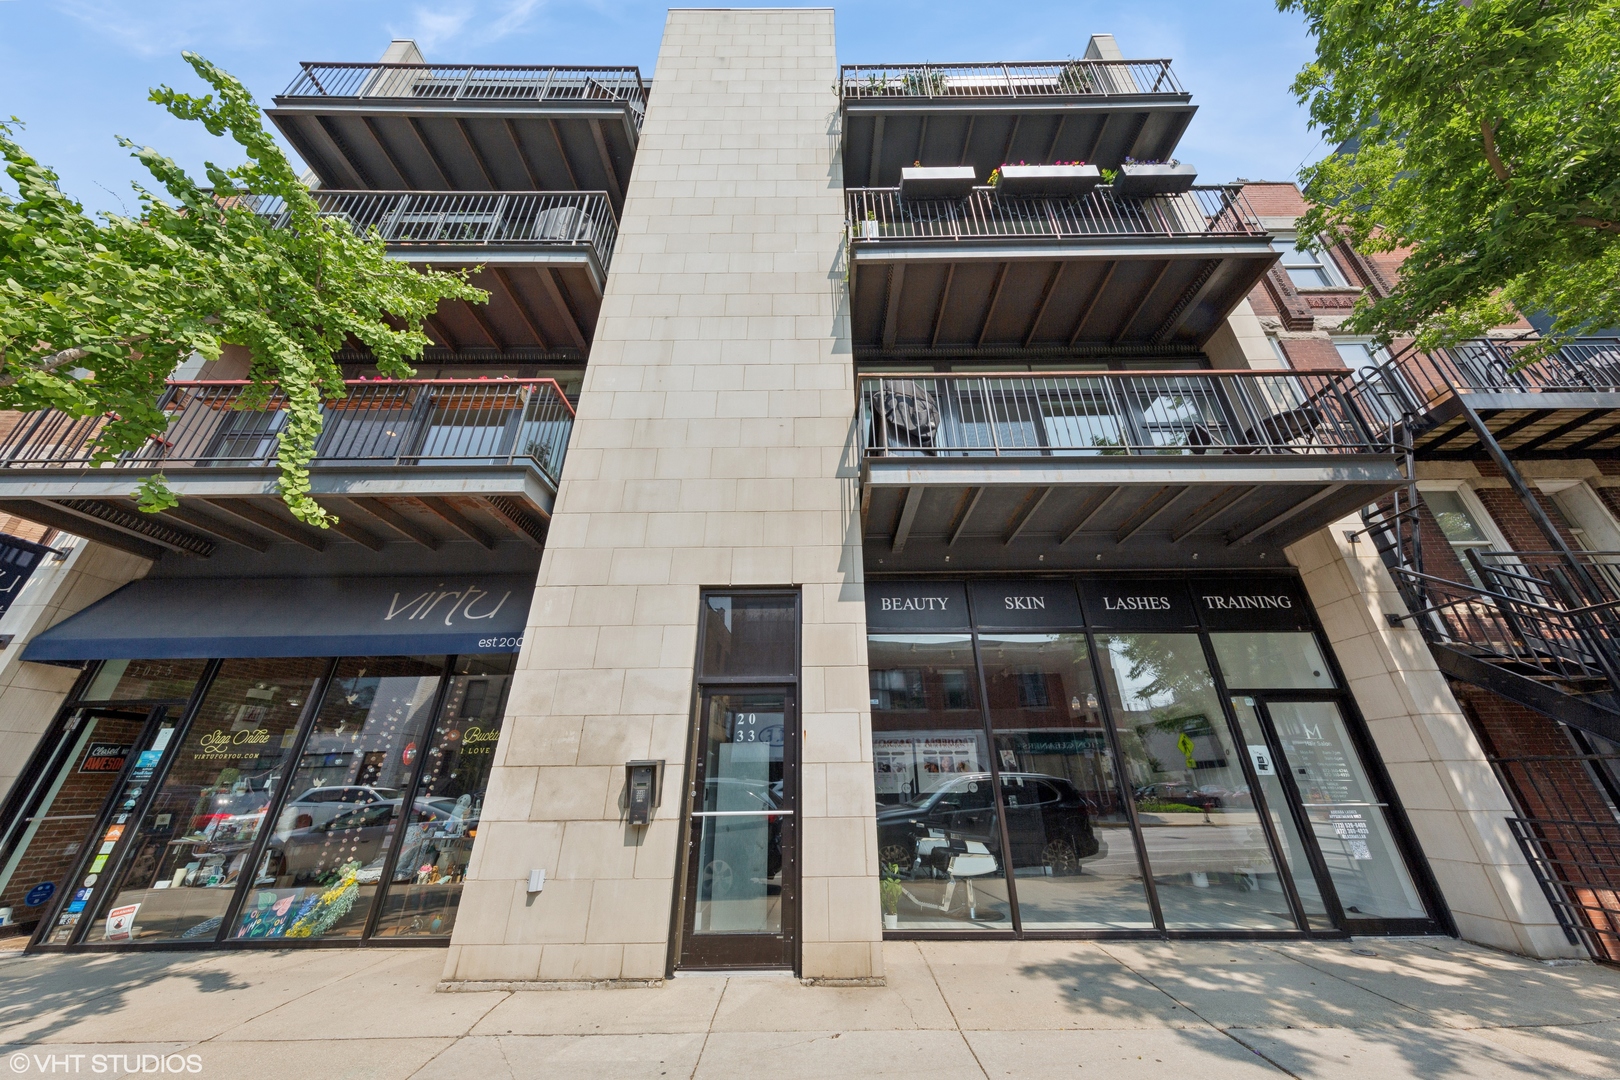
Active under contract
$625,000
3
bds
|
2
ba
|
1,600
sqft
|
built
2006
2033 N Damen Ave, Chicago, IL 60647
$-1,417
Cash flow
-11.8%
Cash-on-Cash Return
3.0%
Cap rate
0.6%
Rent to Value Ratio
Active
$74,700
3
bds
|
1
ba
|
1,008
sqft
|
built
1882
1017 N Avers Ave, Chicago, IL 60651
$1,312
Cash flow
20.5%
Cash-on-Cash Return
21.1%
Cap rate
2.9%
Rent to Value Ratio
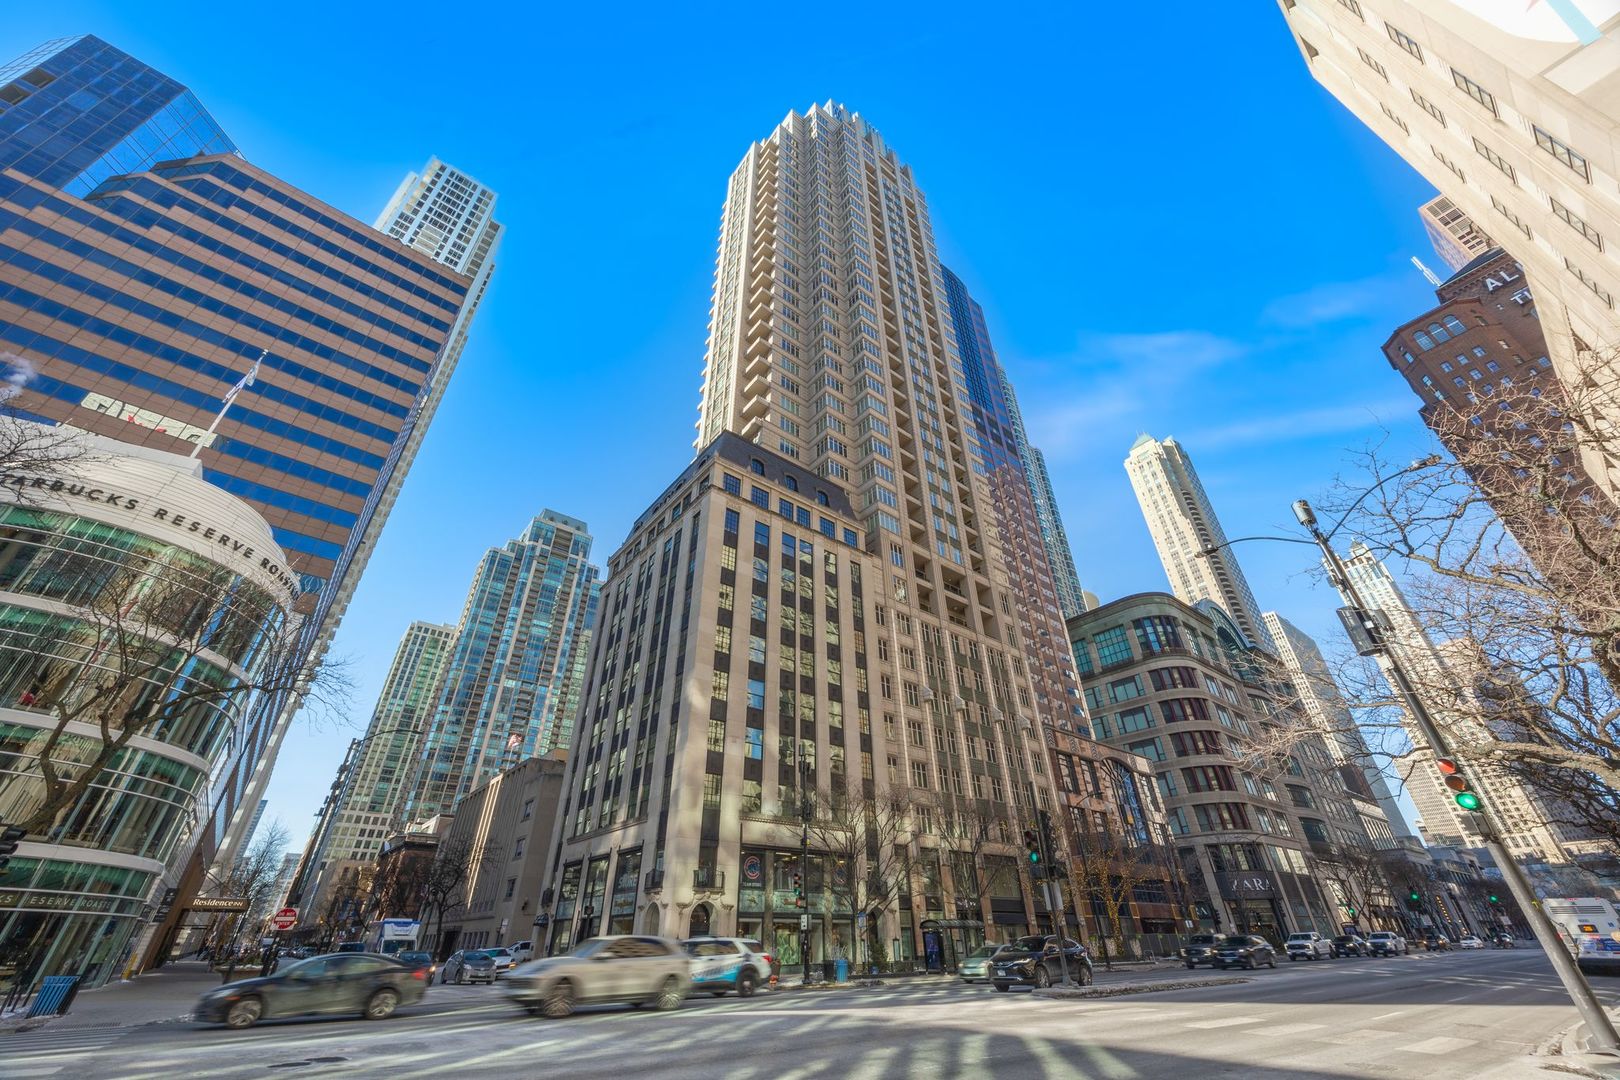
Active
$850,000
2
bds
|
3
ba
|
1,850
sqft
|
built
1985
161 E Chicago Ave, Chicago, IL 60611
$-3,729
Cash flow
-22.9%
Cash-on-Cash Return
0.4%
Cap rate
0.6%
Rent to Value Ratio
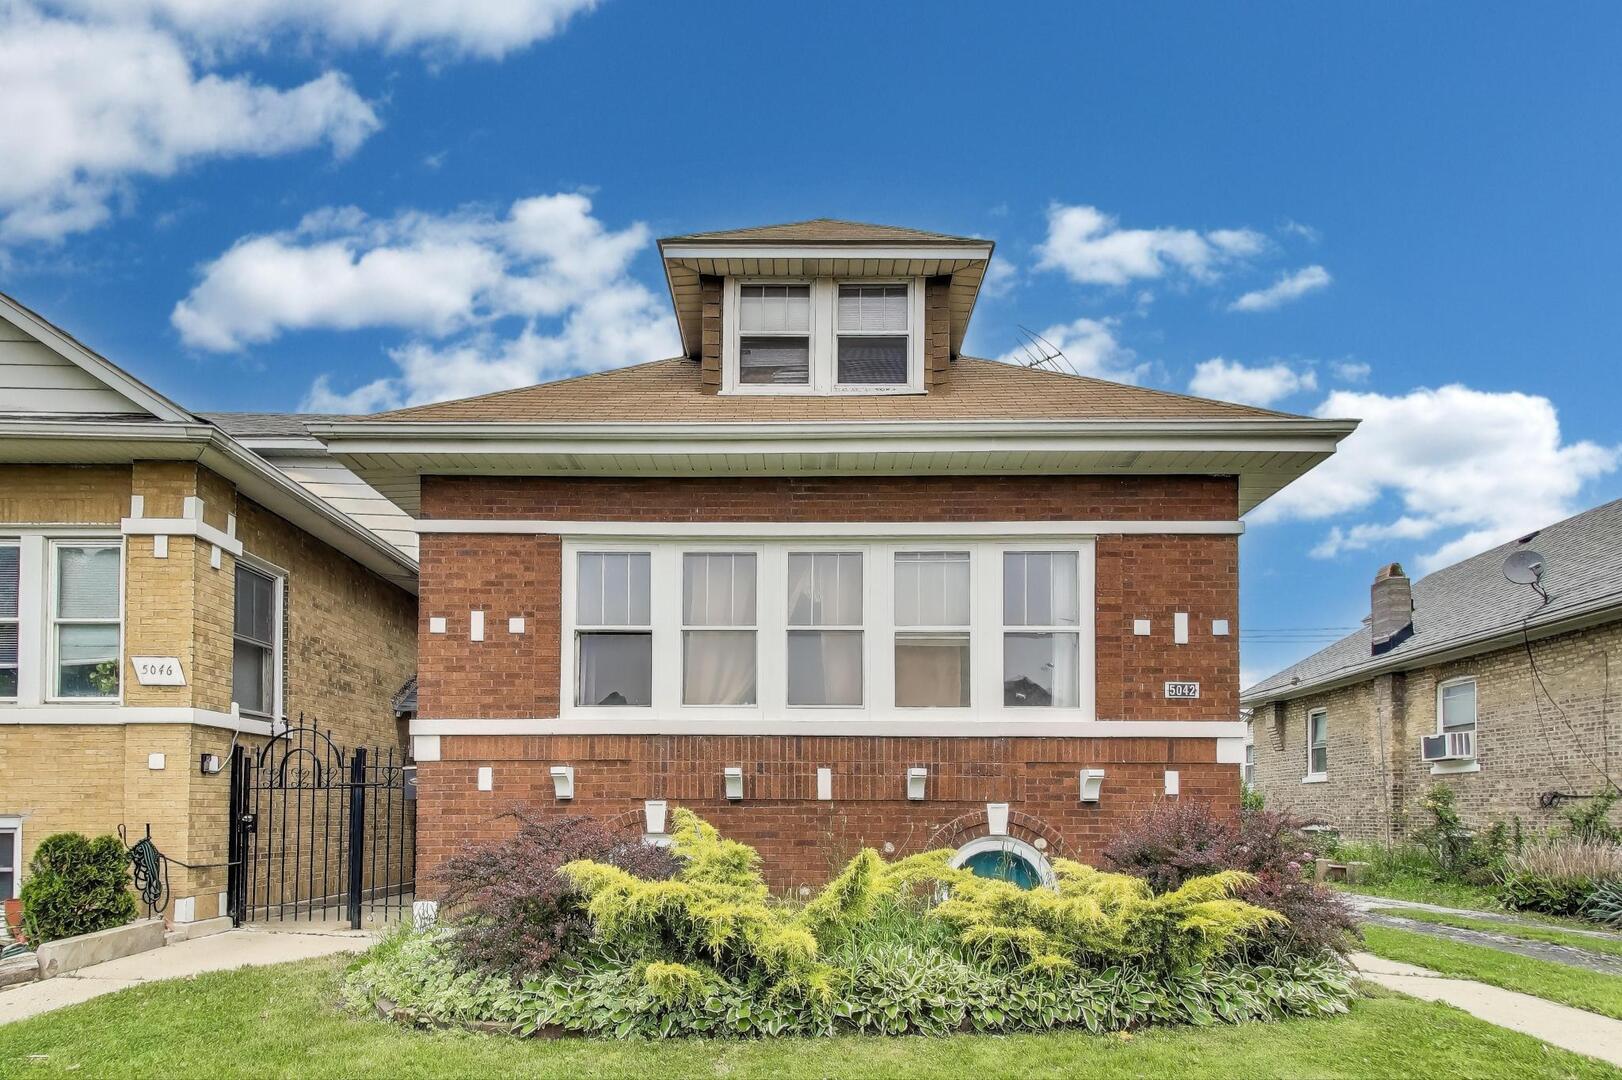
Active under contract
$399,900
5
bds
|
3
ba
|
2,300
sqft
|
built
1923
5042 W Wolfram St, Chicago, IL 60641
$34
Cash flow
0.4%
Cash-on-Cash Return
5.8%
Cap rate
0.8%
Rent to Value Ratio
Active under contract
$1,100,000
4
bds
|
5
ba
|
3,210
sqft
|
built
2007
6229 N Newark Ave, Chicago, IL 60631
$-1,956
Cash flow
-9.3%
Cash-on-Cash Return
3.5%
Cap rate
0.6%
Rent to Value Ratio
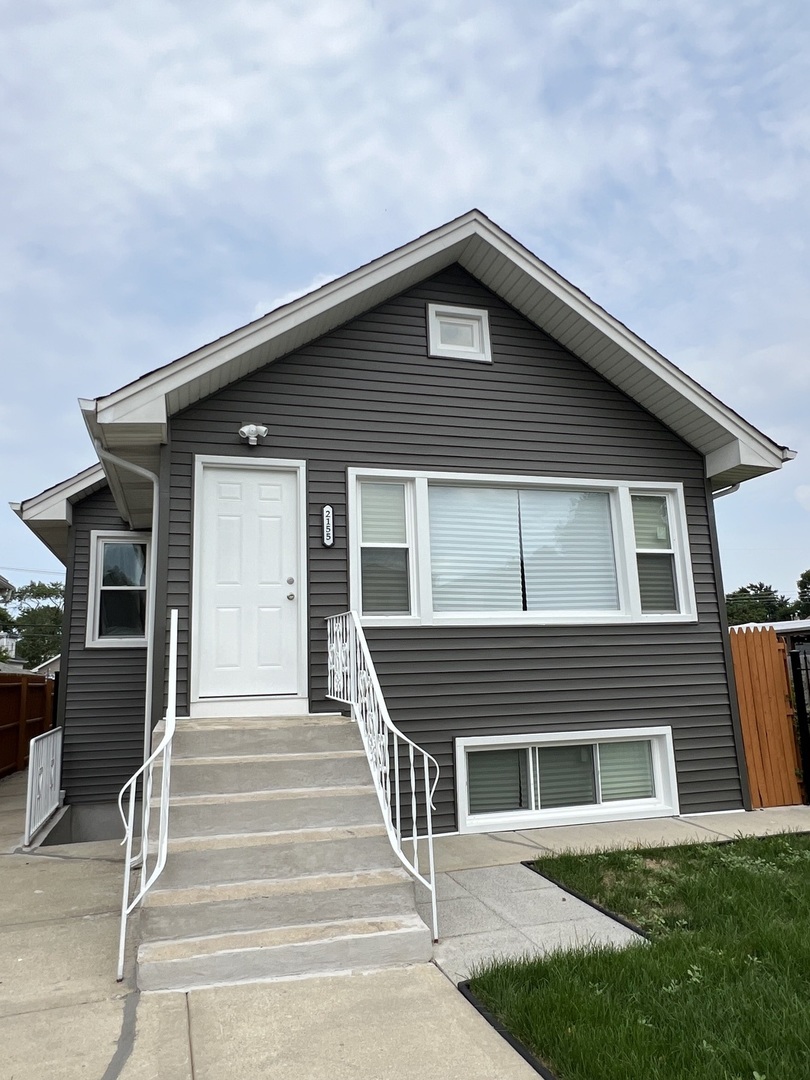
Active under contract
$549,000
6
bds
|
3
ba
|
0
sqft
|
built
1924
2155 N Mobile Ave, Chicago, IL 60639
$-1,568
Cash flow
-14.9%
Cash-on-Cash Return
2.3%
Cap rate
0.4%
Rent to Value Ratio
Active
$349,900
3
bds
|
2
ba
|
1,650
sqft
|
built
1930
5142 S Greenwood Ave, Chicago, IL 60615
$-438
Cash flow
-6.5%
Cash-on-Cash Return
4.2%
Cap rate
0.9%
Rent to Value Ratio
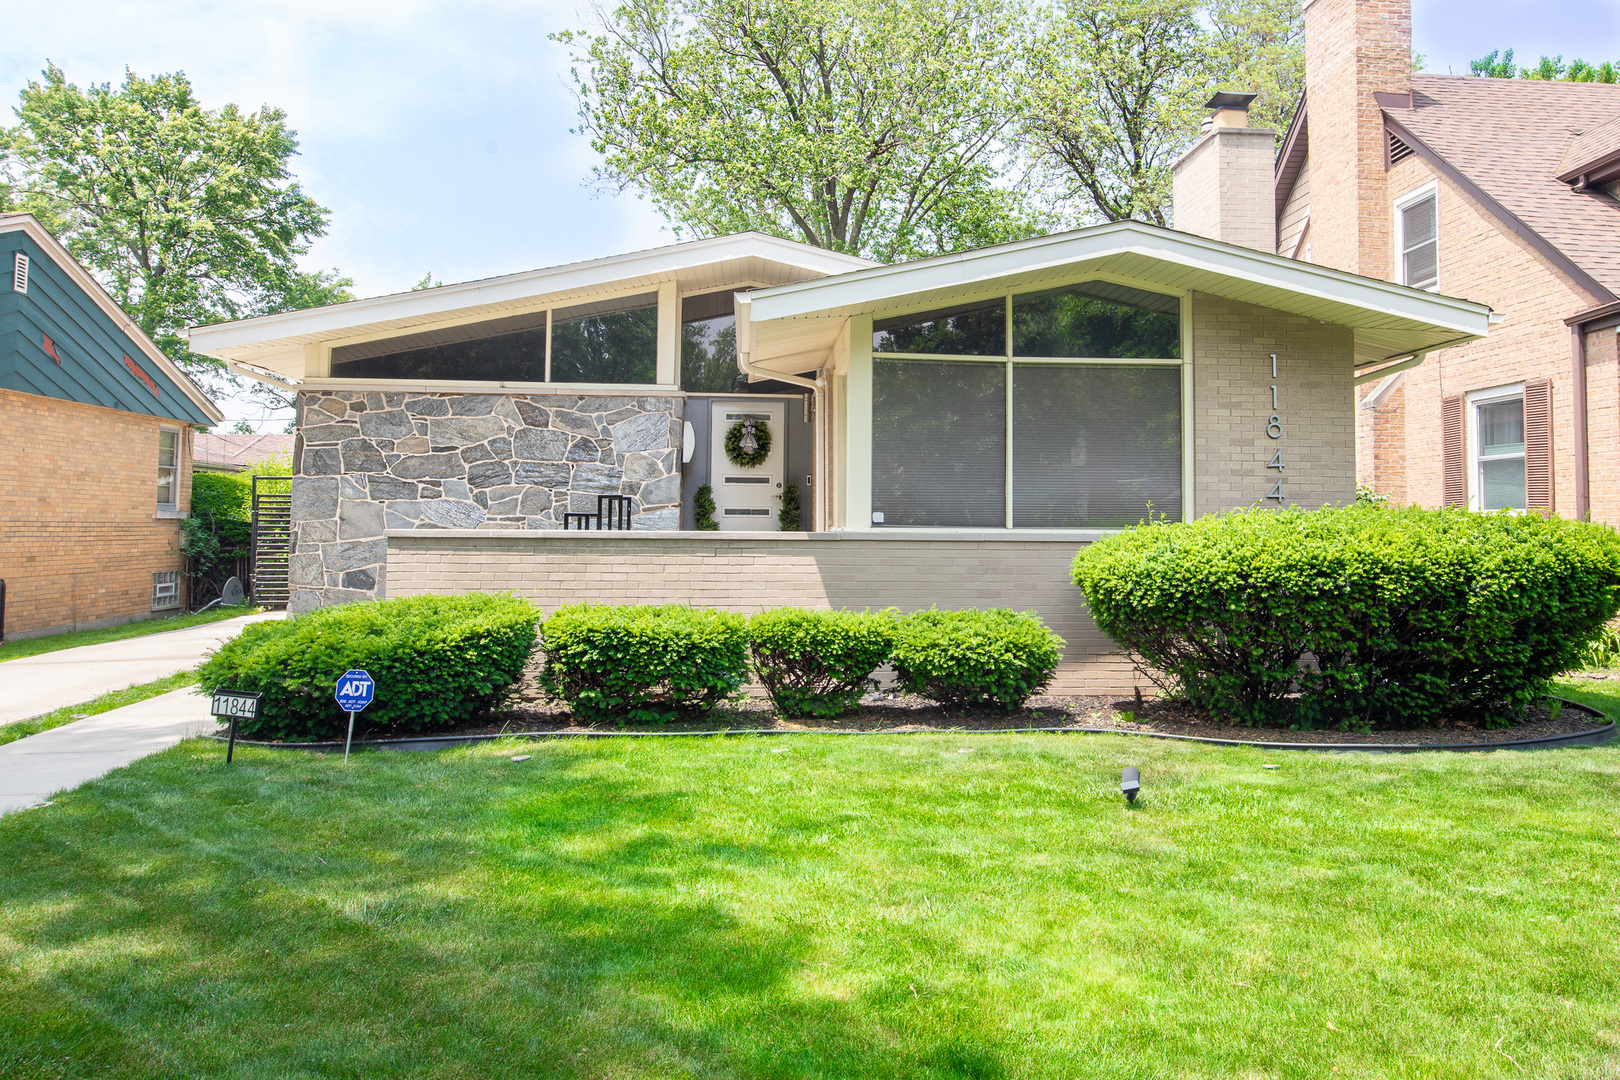
Active under contract
$499,900
2
bds
|
3
ba
|
3,585
sqft
|
built
1966
11844 S Oakley Ave, Chicago, IL 60643
$-668
Cash flow
-7.0%
Cash-on-Cash Return
4.1%
Cap rate
0.6%
Rent to Value Ratio
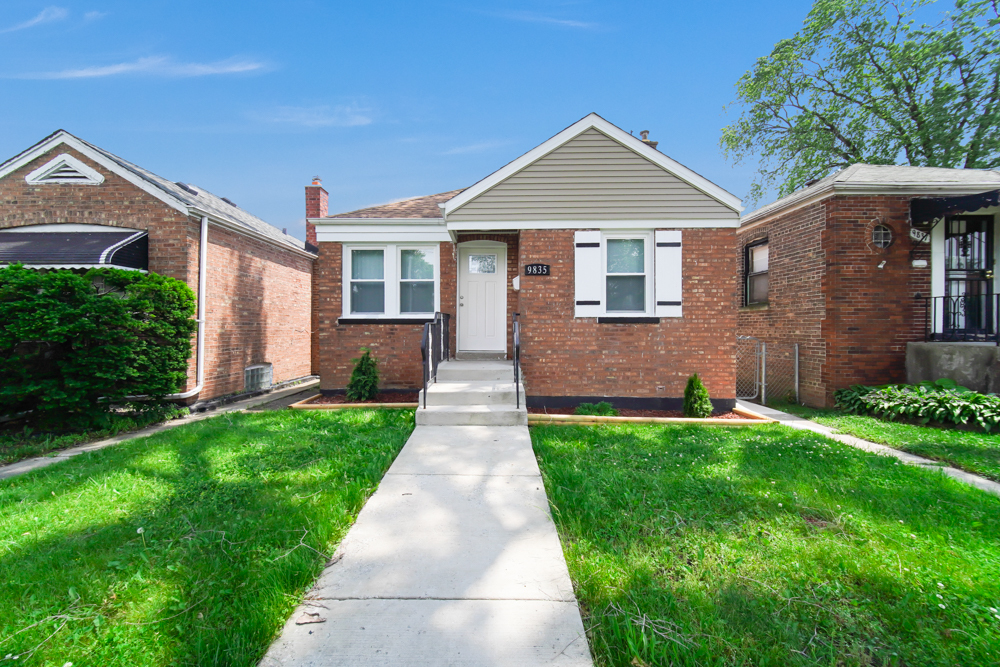
Active under contract
$269,900
2
bds
|
3
ba
|
1,750
sqft
|
built
1944
9835 S Drexel Ave, Chicago, IL 60628
$-124
Cash flow
-2.4%
Cash-on-Cash Return
5.1%
Cap rate
0.7%
Rent to Value Ratio
Active
$135,000
1
bds
|
1
ba
|
850
sqft
|
built
1968
6700 S South Shore Dr, Chicago, IL 60649
$-282
Cash flow
-10.9%
Cash-on-Cash Return
3.2%
Cap rate
1.0%
Rent to Value Ratio

Active
$199,900
3
bds
|
2
ba
|
1,525
sqft
|
built
1915
7736 S Oglesby Ave, Chicago, IL 60649
$379
Cash flow
9.9%
Cash-on-Cash Return
8.0%
Cap rate
1.1%
Rent to Value Ratio
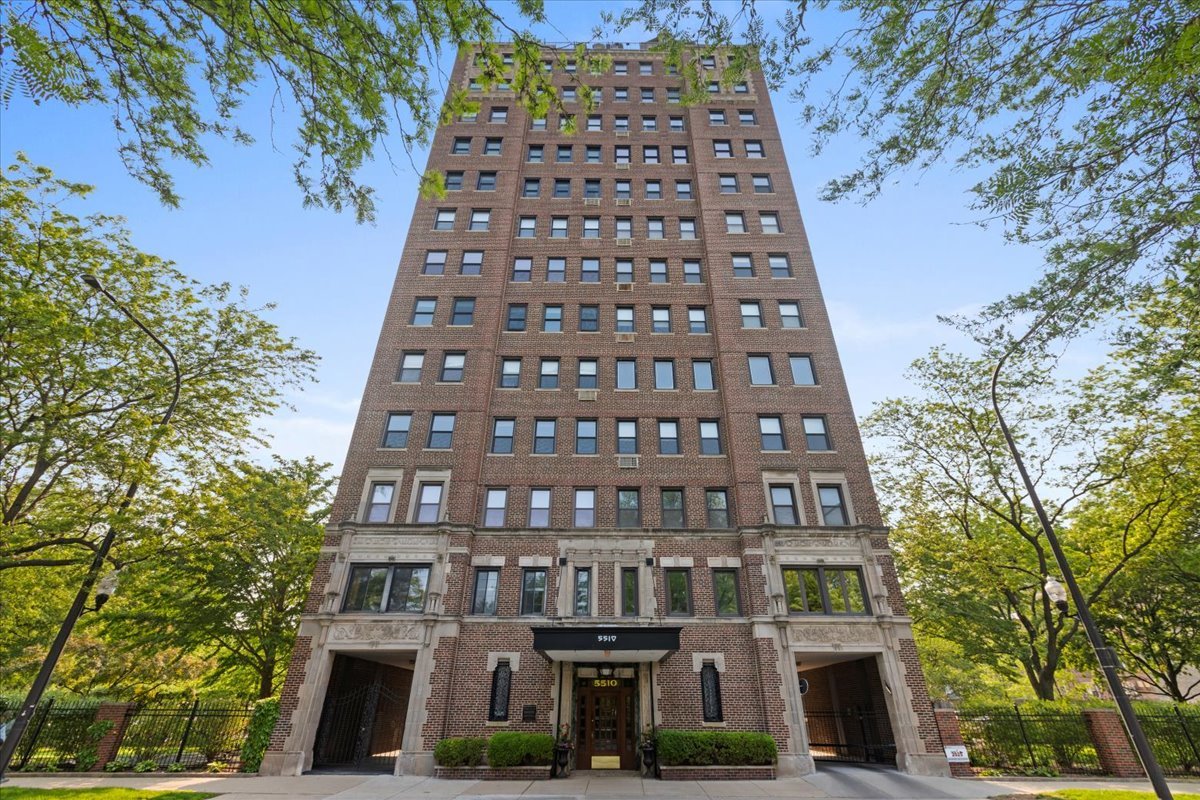
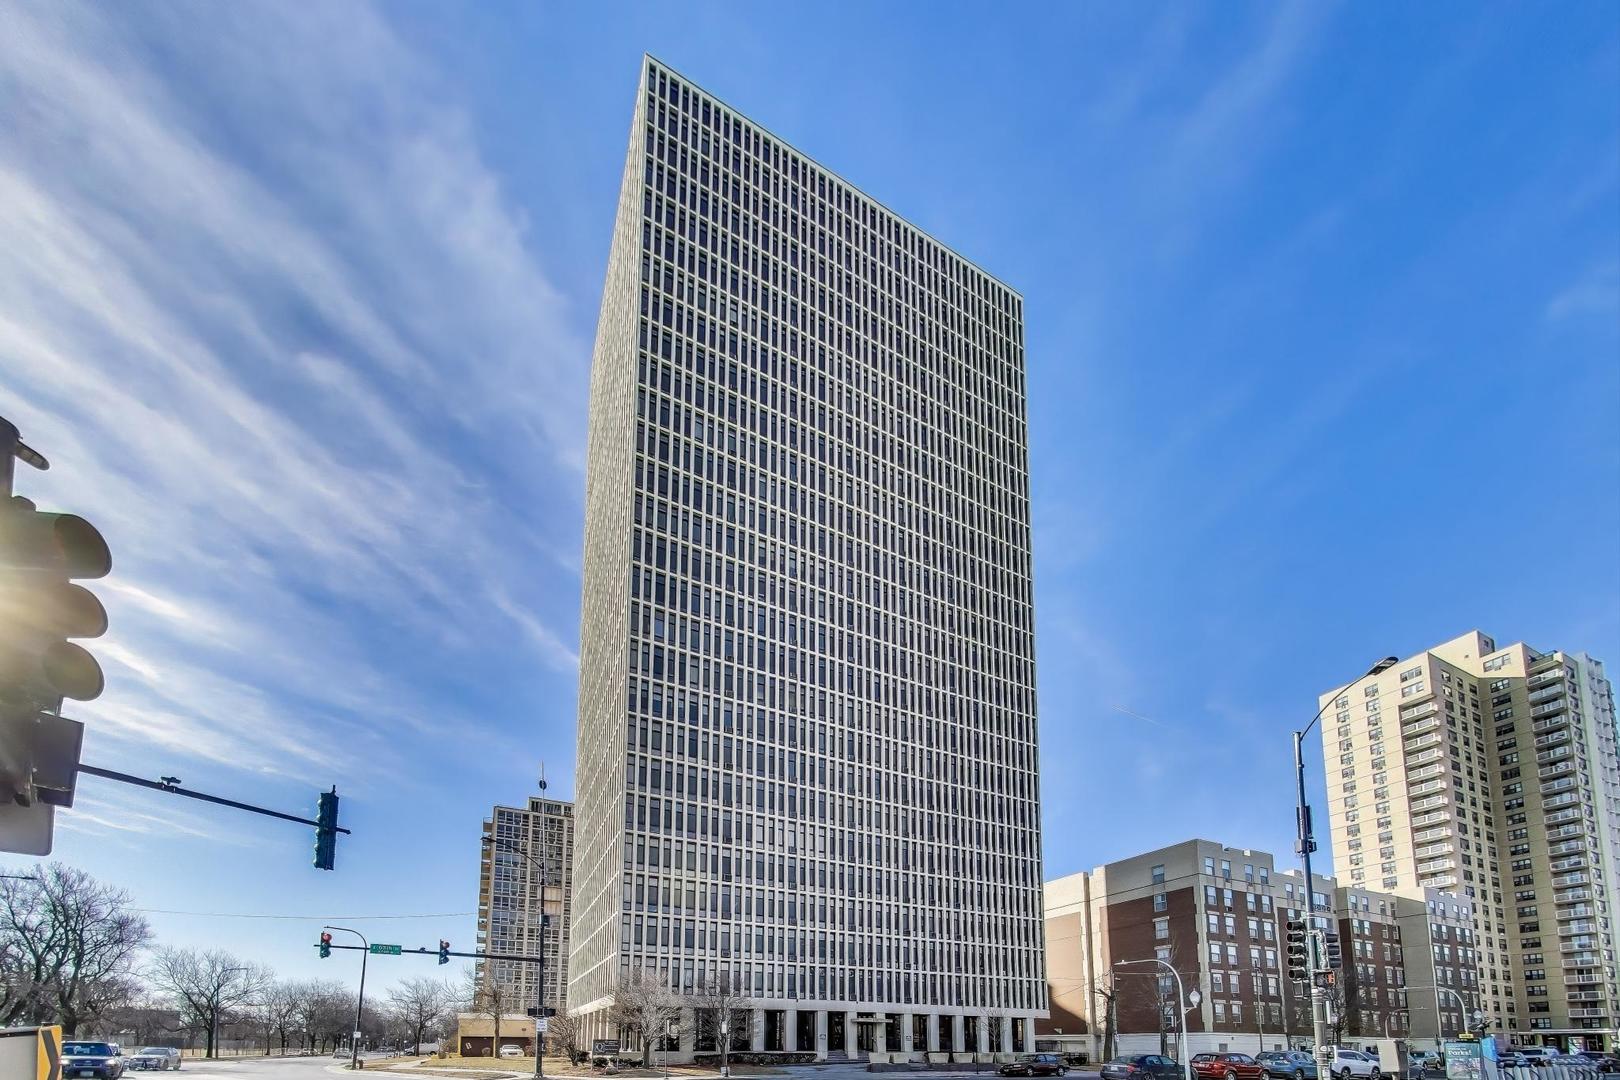
Active under contract
$715,000
2
bds
|
2
ba
|
0
sqft
|
built
1928
5510 N Sheridan Rd, Chicago, IL 60640
$-3,540
Cash flow
-25.8%
Cash-on-Cash Return
-0.3%
Cap rate
0.4%
Rent to Value Ratio
Active
$499,000
3
bds
|
2
ba
|
1,582
sqft
|
built
1946
7805 W Farragut Ave, Chicago, IL 60656
$-799
Cash flow
-8.4%
Cash-on-Cash Return
3.8%
Cap rate
0.6%
Rent to Value Ratio
Active
$124,900
3
bds
|
1
ba
|
1,029
sqft
|
built
1917
10741 S Glenroy Ave, Chicago, IL 60643
$710
Cash flow
29.7%
Cash-on-Cash Return
12.5%
Cap rate
1.6%
Rent to Value Ratio
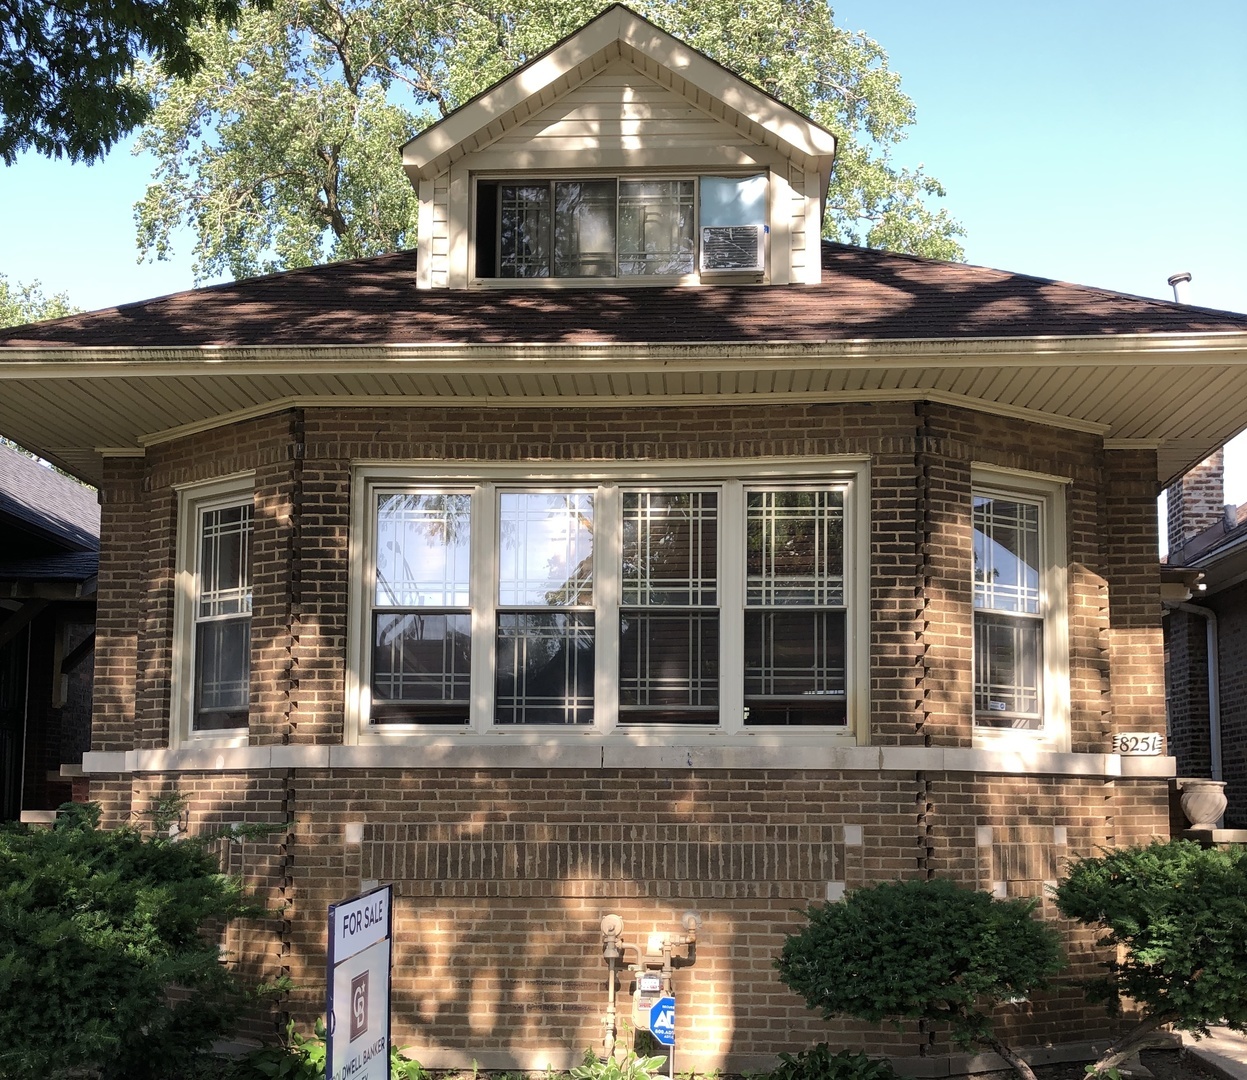
Active
$240,000
4
bds
|
2
ba
|
1,467
sqft
|
built
1926
8251 S Kenwood Ave, Chicago, IL 60619
$188
Cash flow
4.1%
Cash-on-Cash Return
6.6%
Cap rate
0.9%
Rent to Value Ratio
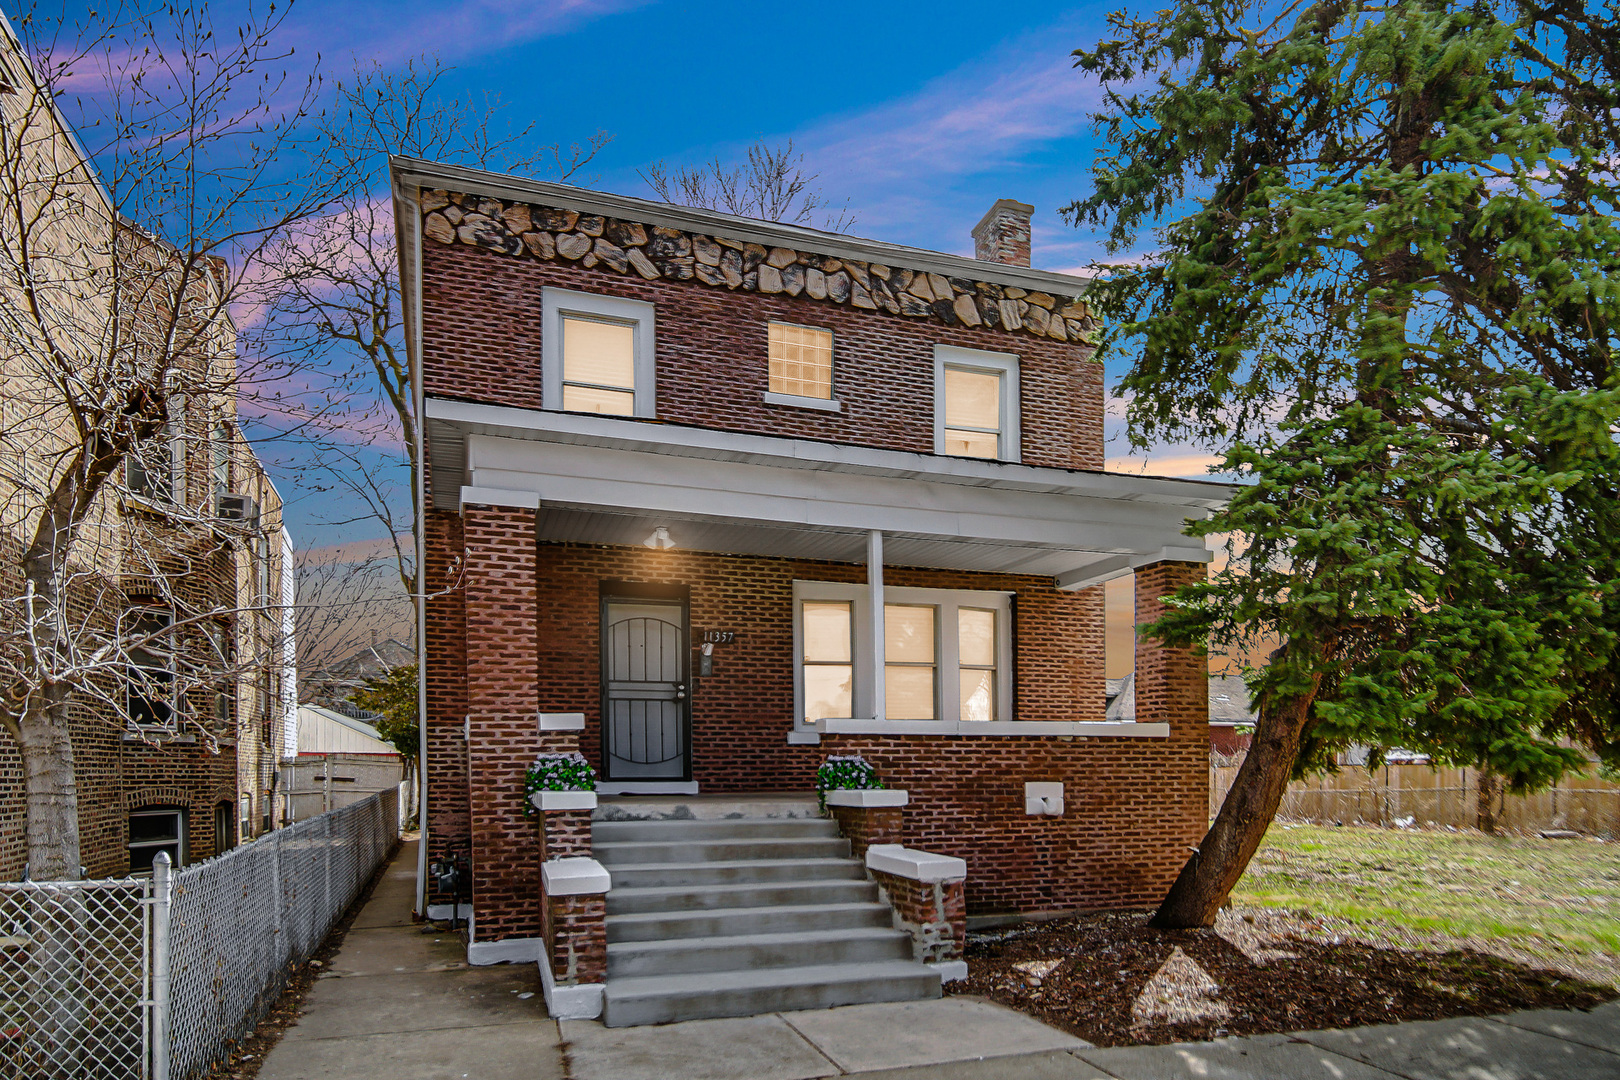
Active
$260,900
4
bds
|
2
ba
|
1,889
sqft
|
built
1911
11357 S Indiana Ave, Chicago, IL 60628
$128
Cash flow
2.6%
Cash-on-Cash Return
6.3%
Cap rate
0.9%
Rent to Value Ratio
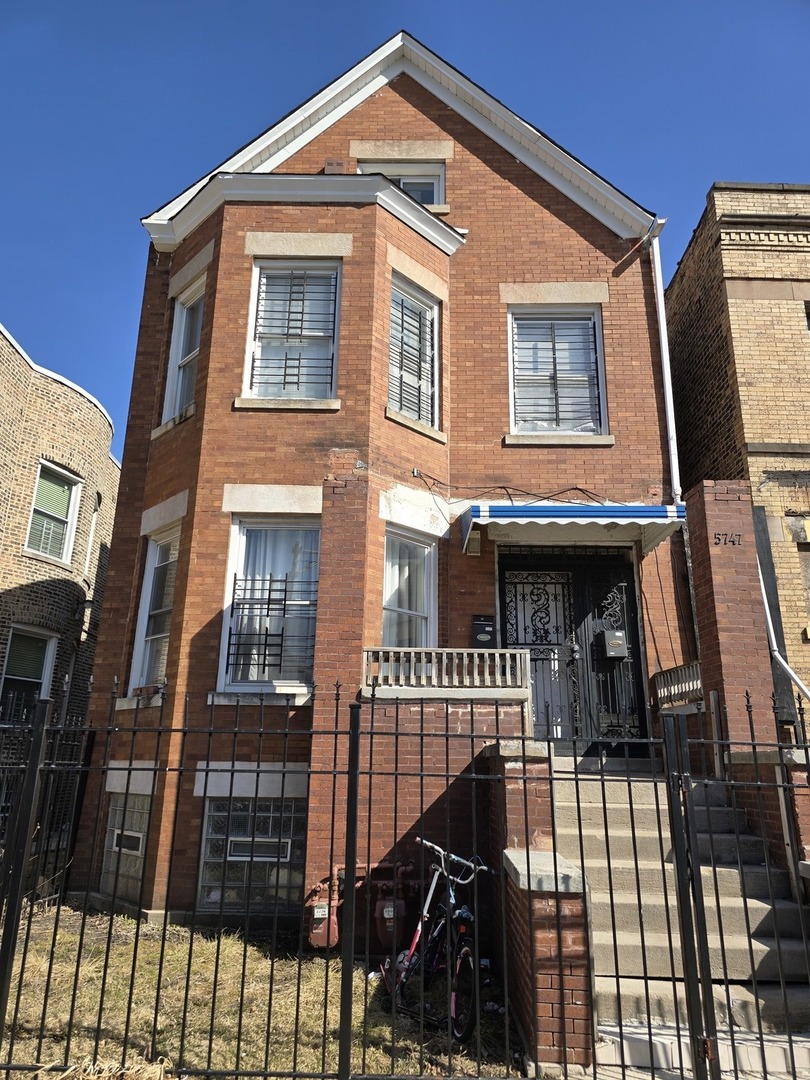
Active
$330,000
8
bds
|
4
ba
|
0
sqft
|
built
1904
5747 S Laflin St, Chicago, IL 60636
$-460
Cash flow
-7.3%
Cash-on-Cash Return
4.0%
Cap rate
0.5%
Rent to Value Ratio
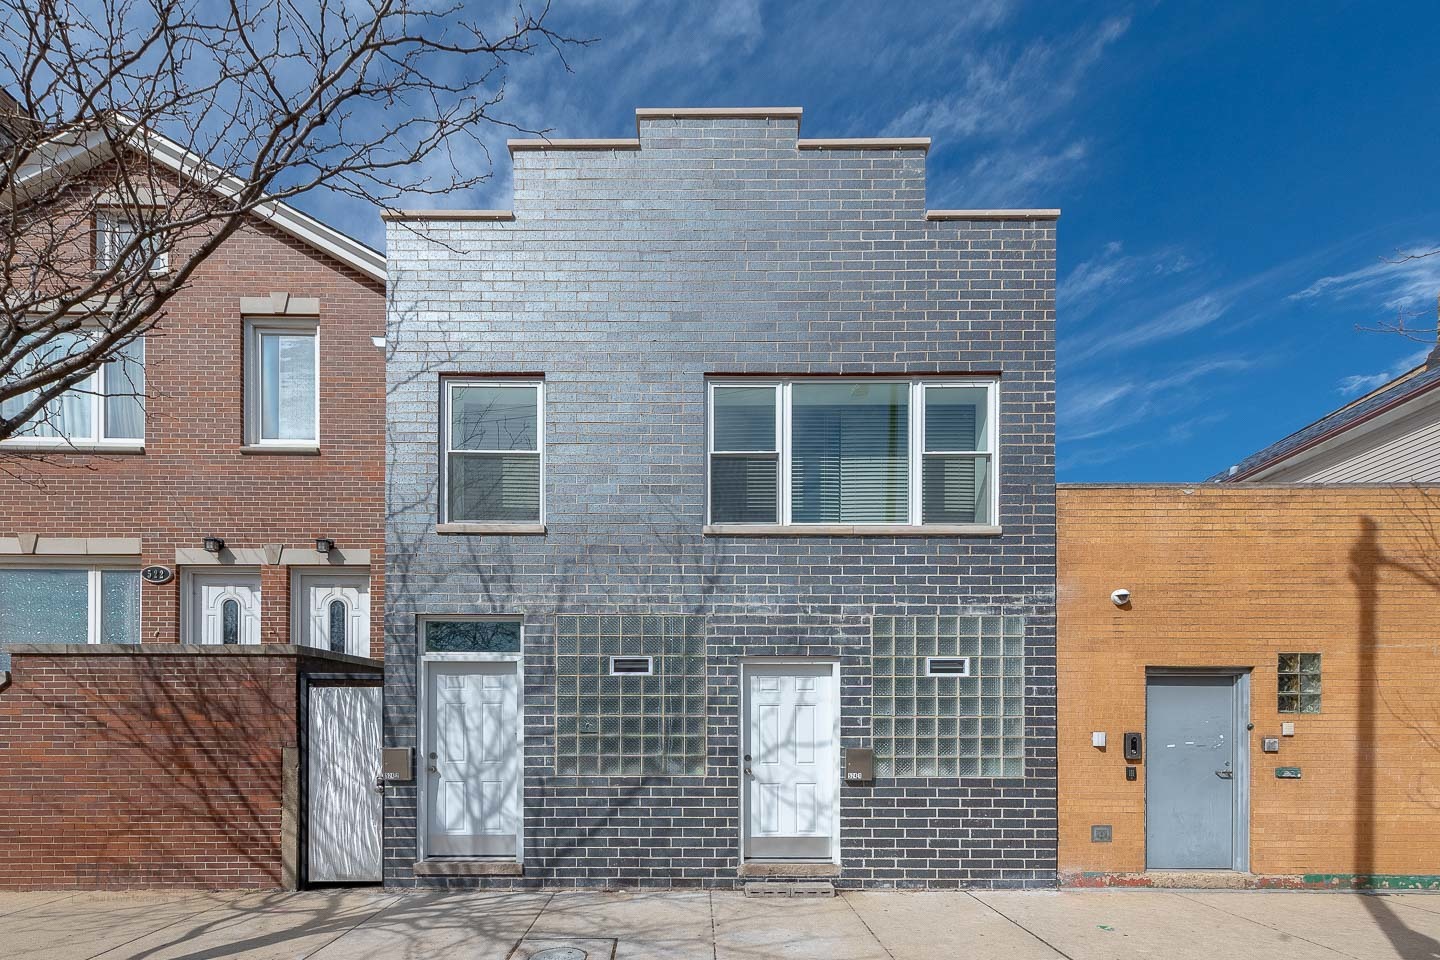
Active
$719,900
4
bds
|
2
ba
|
0
sqft
|
built
1900
524 N Ashland Ave, Chicago, IL 60622
$-2,169
Cash flow
-15.7%
Cash-on-Cash Return
2.1%
Cap rate
0.4%
Rent to Value Ratio
Active
$399,900
4
bds
|
3
ba
|
1,589
sqft
|
built
1893
2922 W Polk St, Chicago, IL 60612
$44
Cash flow
0.6%
Cash-on-Cash Return
5.8%
Cap rate
0.8%
Rent to Value Ratio
Active under contract
$389,999
2
bds
|
2
ba
|
1,200
sqft
|
built
2004
1250 S Michigan Ave, Chicago, IL 60605
$-1,477
Cash flow
-19.8%
Cash-on-Cash Return
1.1%
Cap rate
0.8%
Rent to Value Ratio
Active
$499,000
2
bds
|
2
ba
|
1,200
sqft
|
built
2005
500 W Superior St, Chicago, IL 60654
$-1,381
Cash flow
-14.4%
Cash-on-Cash Return
2.4%
Cap rate
0.9%
Rent to Value Ratio
Active
$315,000
4
bds
|
3
ba
|
2,000
sqft
|
built
1890
8807 S Lowe Ave, Chicago, IL 60620
$-42
Cash flow
-0.7%
Cash-on-Cash Return
5.5%
Cap rate
0.7%
Rent to Value Ratio
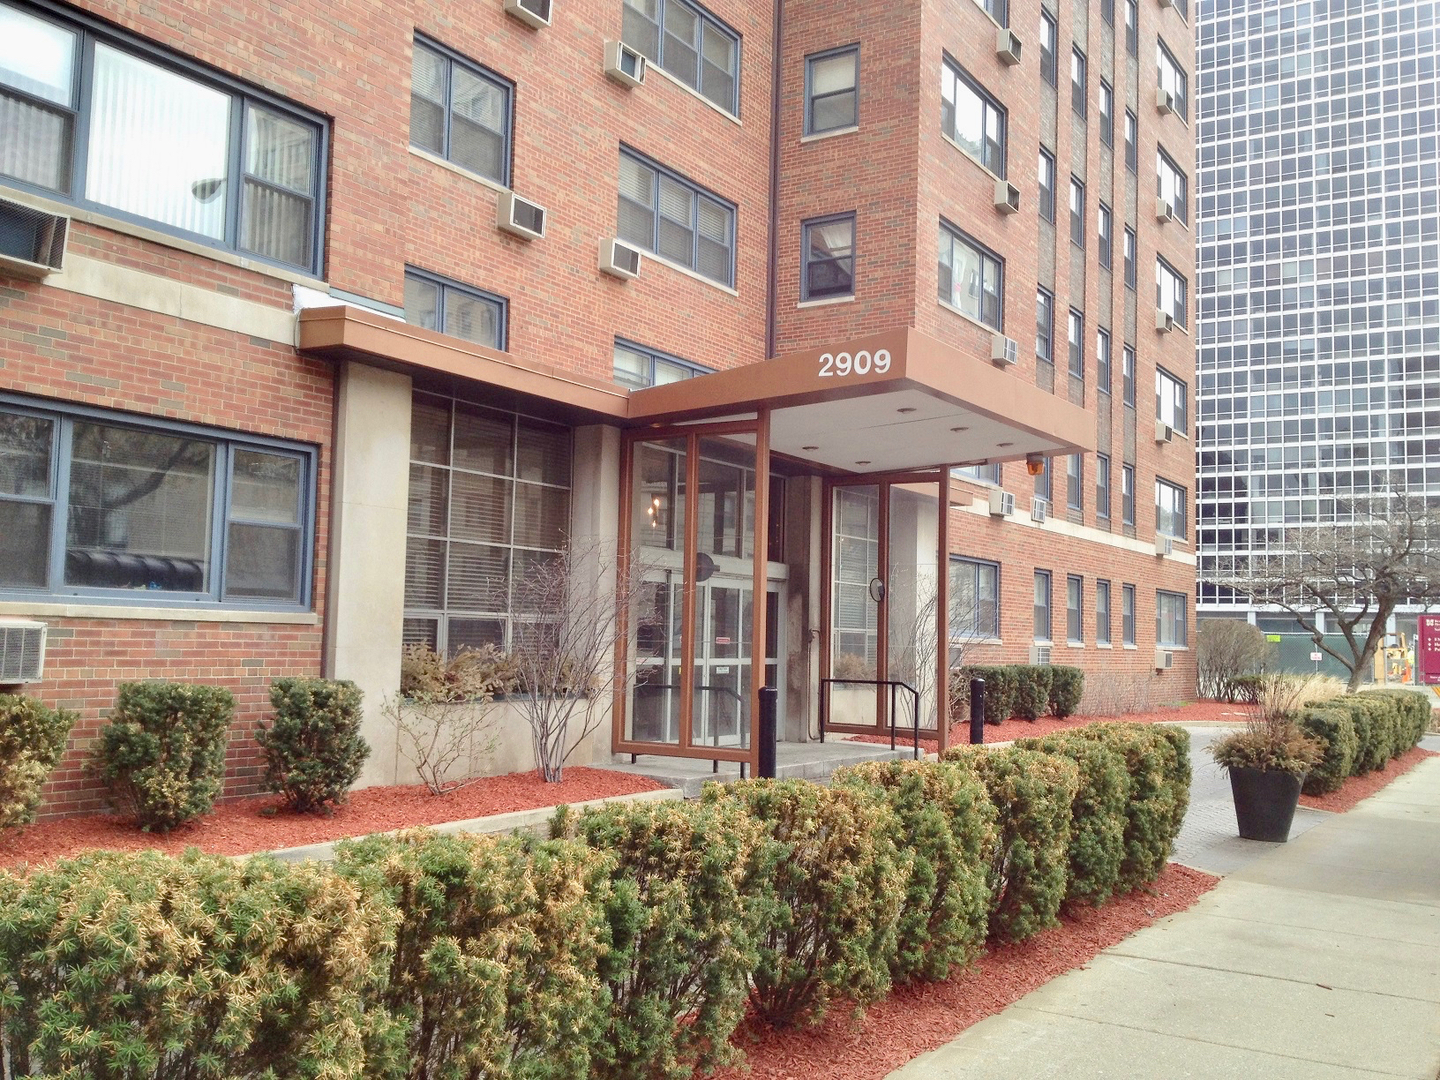
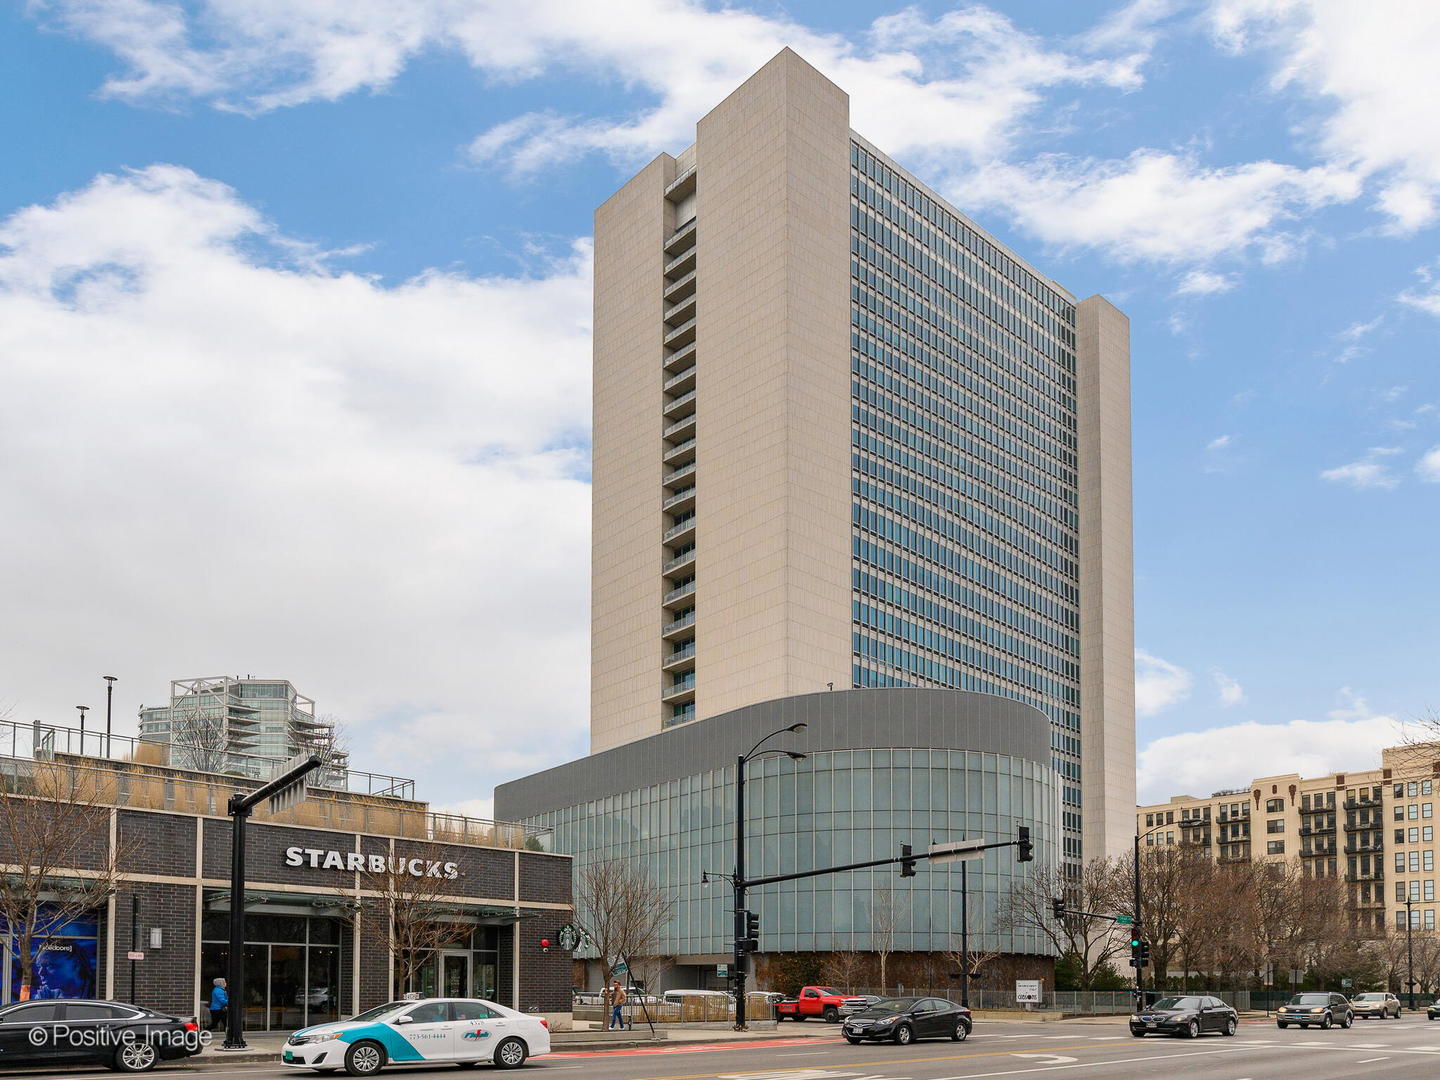
Active
$210,000
1
bds
|
1
ba
|
0
sqft
|
built
1957
2909 N Sheridan Rd, Chicago, IL 60657
$-613
Cash flow
-15.2%
Cash-on-Cash Return
2.2%
Cap rate
1.0%
Rent to Value Ratio
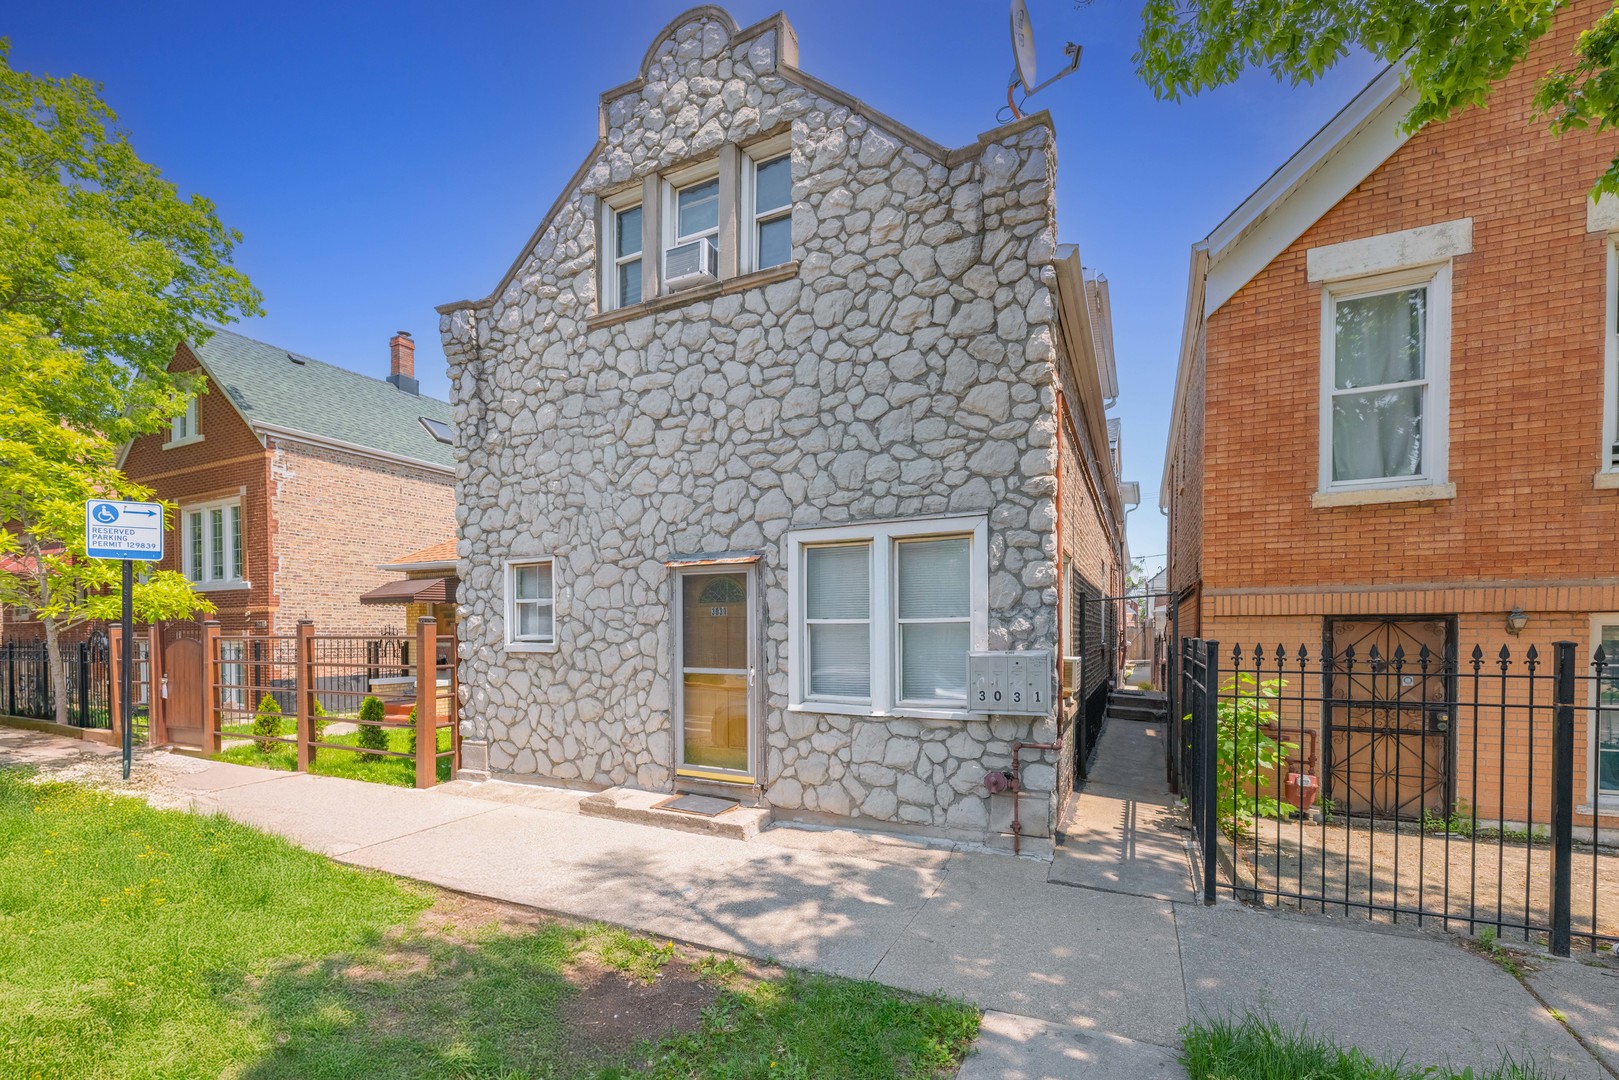
Active
$494,900
9
bds
|
4
ba
|
0
sqft
|
built
1908
3031 S Central Park Ave, Chicago, IL 60623
$-1,088
Cash flow
-11.5%
Cash-on-Cash Return
3.0%
Cap rate
0.4%
Rent to Value Ratio
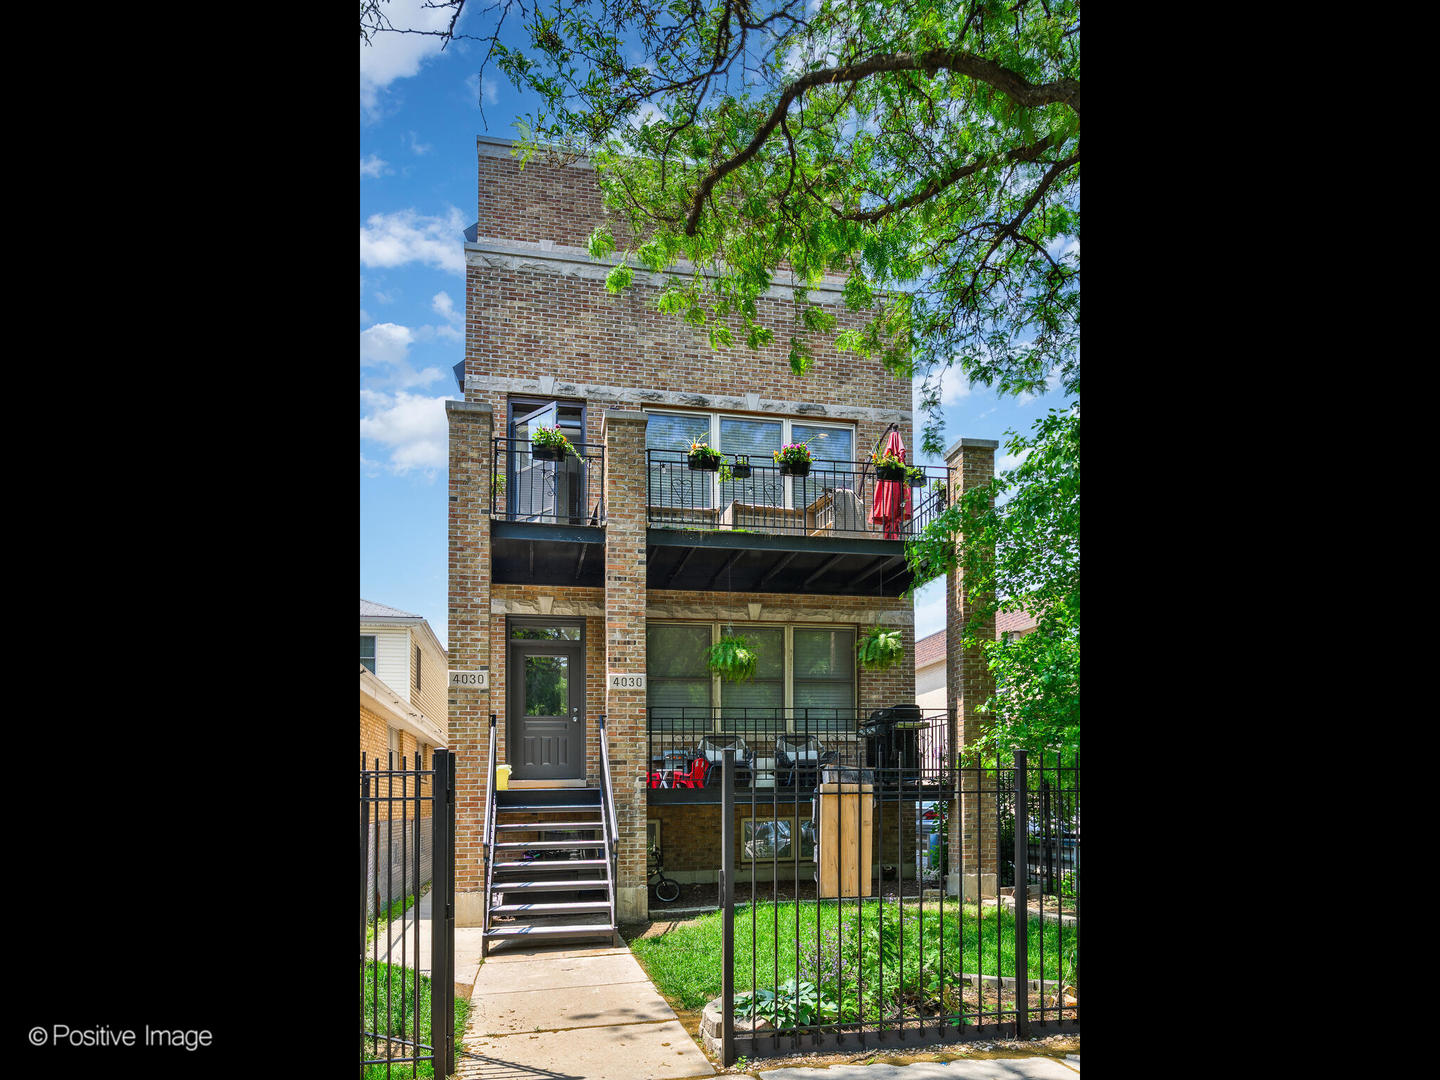
Active under contract
$649,900
3
bds
|
2
ba
|
2,000
sqft
|
built
1997
4030 N California Ave, Chicago, IL 60618
$-2,048
Cash flow
-16.4%
Cash-on-Cash Return
1.9%
Cap rate
0.4%
Rent to Value Ratio
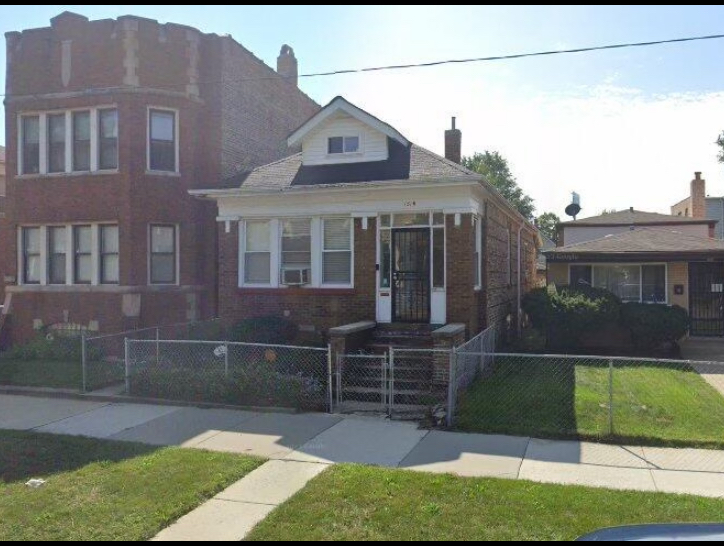
Active
$135,000
3
bds
|
2
ba
|
968
sqft
|
built
1920
1519 E 76th Pl, Chicago, IL 60619
$332
Cash flow
12.8%
Cash-on-Cash Return
8.6%
Cap rate
1.2%
Rent to Value Ratio
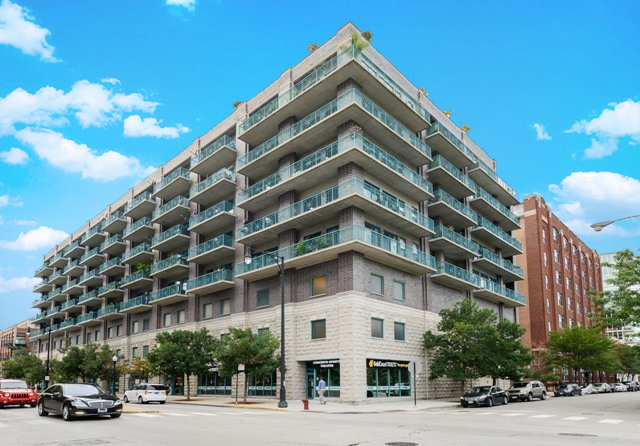
Active
$325,000
1
bds
|
1
ba
|
0
sqft
|
built
2001
910 W Madison St, Chicago, IL 60607
$-596
Cash flow
-9.6%
Cash-on-Cash Return
3.5%
Cap rate
0.8%
Rent to Value Ratio
Active
$650,000
3
bds
|
3
ba
|
0
sqft
|
built
1953
5665 N Northcott Ave, Chicago, IL 60631
$-1,417
Cash flow
-11.4%
Cash-on-Cash Return
3.1%
Cap rate
0.5%
Rent to Value Ratio
Active under contract
$179,000
1
bds
|
1
ba
|
0
sqft
|
built
1972
444 W Fullerton Pkwy, Chicago, IL 60614
$-164
Cash flow
-4.8%
Cash-on-Cash Return
4.6%
Cap rate
1.1%
Rent to Value Ratio
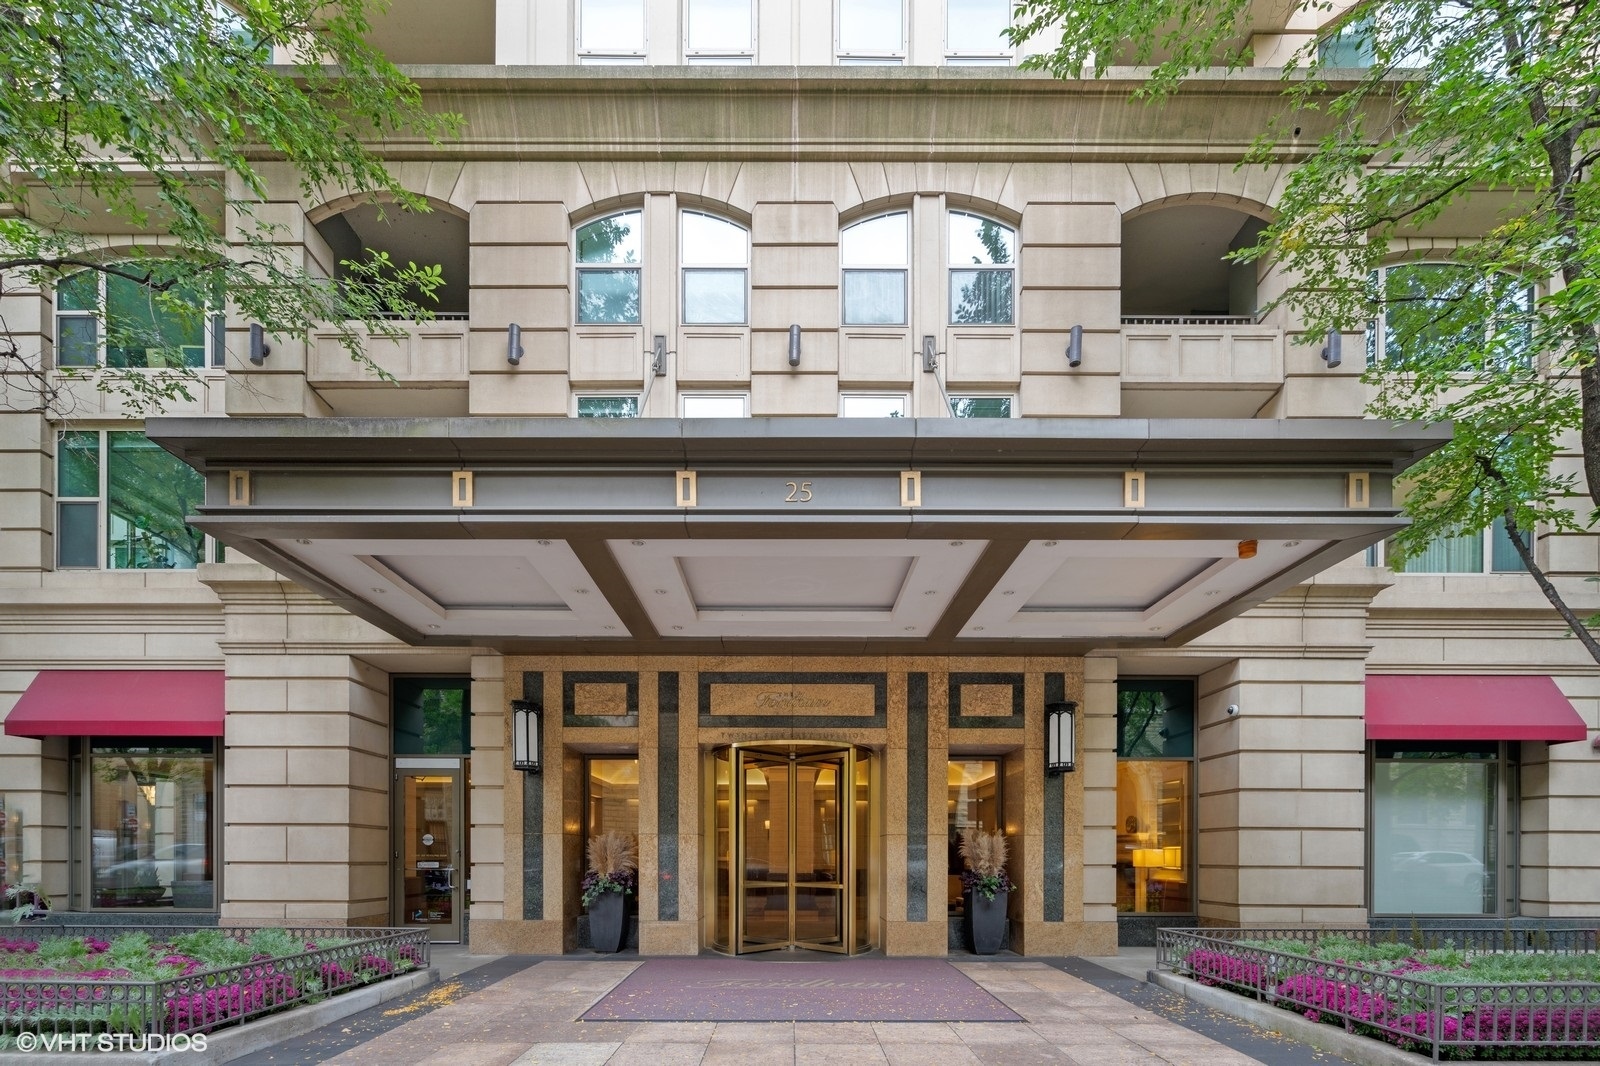
Active
$759,000
2
bds
|
2
ba
|
1,559
sqft
|
built
2003
25 E Superior St, Chicago, IL 60611
$-2,914
Cash flow
-20.0%
Cash-on-Cash Return
1.1%
Cap rate
0.6%
Rent to Value Ratio