Boulder County Investment Properties for Sale
Browse homes for sale and investment properties in Boulder County. Refine your search by price, property type, or more.
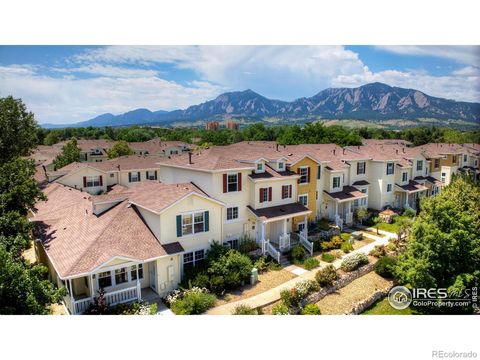
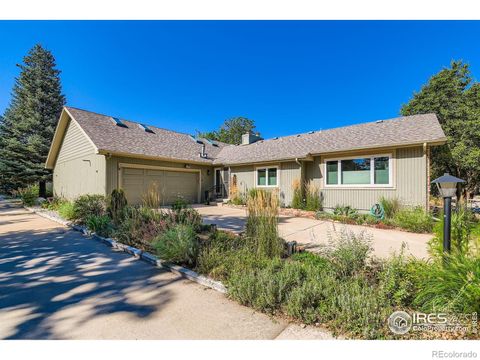
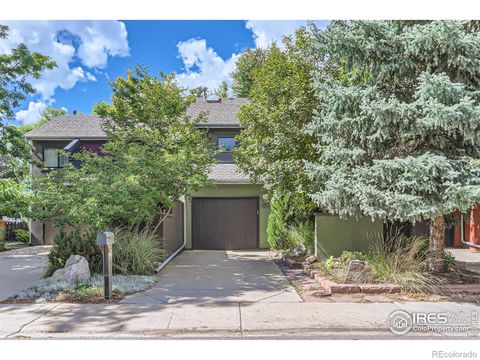
Best cash flowing properties in Boulder County
Active
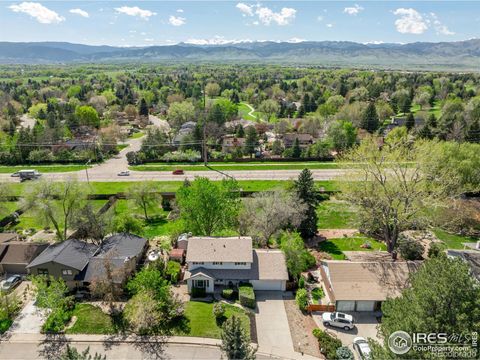
$250,000
1
bds
|
1
ba
|
423
sqft
|
built
1971
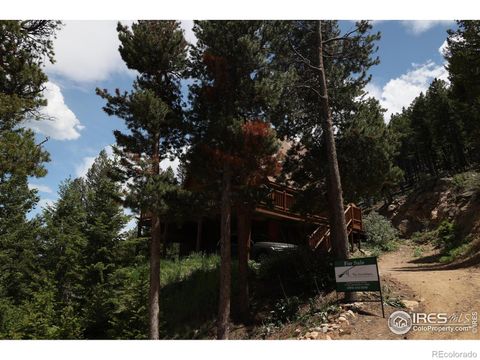
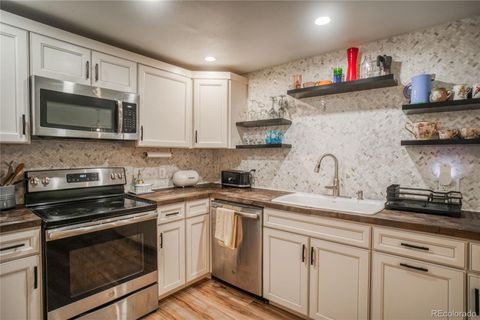
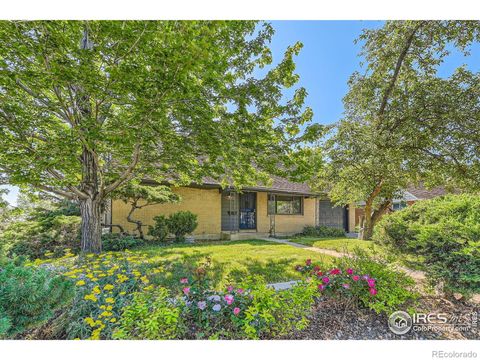
8050 Niwot Rd, Niwot, CO 80503
$-381
Cash flow
-8.0%
Cash-on-Cash Return
3.8%
Cap rate
0.6%
Rent to Value Ratio
Active
$399,900
2
bds
|
1
ba
|
740
sqft
|
built
1920
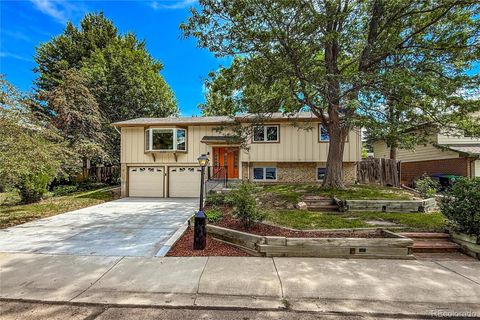
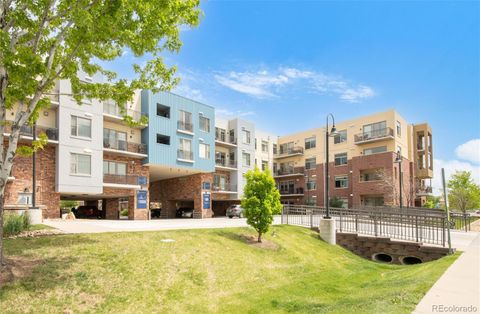
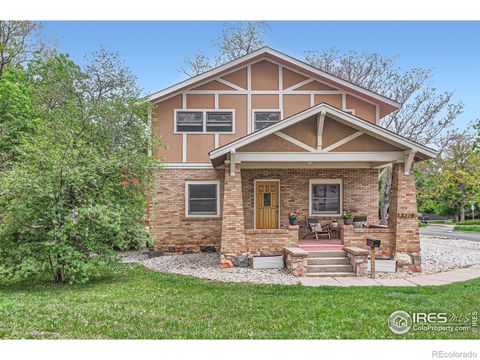
1129 2nd Ave, Longmont, CO 80501
$-554
Cash flow
-7.2%
Cash-on-Cash Return
4.0%
Cap rate
0.6%
Rent to Value Ratio
788 out of 869 properties for sale in Boulder County
Limited Results Shown
Create a free account, or log in to reveal all property listings and enjoy the complete experience.
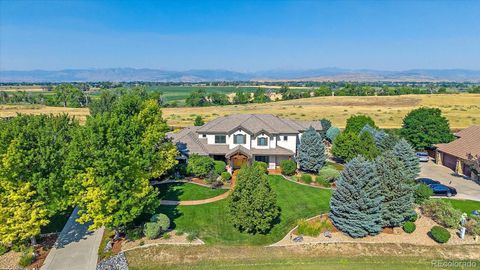
Active
$2,950,000
3
bds
|
3
ba
|
2,450
sqft
|
built
1969
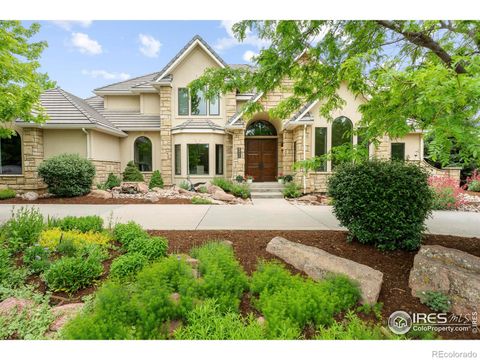
1006 6th St, Boulder, CO 80302
$-10,449
Cash flow
-18.5%
Cash-on-Cash Return
1.4%
Cap rate
0.2%
Rent to Value Ratio
Active
$2,695,000
3
bds
|
3
ba
|
2,655
sqft
|
built
1950
580 Pleasant St, Boulder, CO 80302
$-8,220
Cash flow
-15.9%
Cash-on-Cash Return
2.0%
Cap rate
0.3%
Rent to Value Ratio
Active
$1,349,000
4
bds
|
3
ba
|
3,383
sqft
|
built
1989
4521 Northfield Ct, Boulder, CO 80301
$-3,999
Cash flow
-15.5%
Cash-on-Cash Return
2.1%
Cap rate
0.3%
Rent to Value Ratio
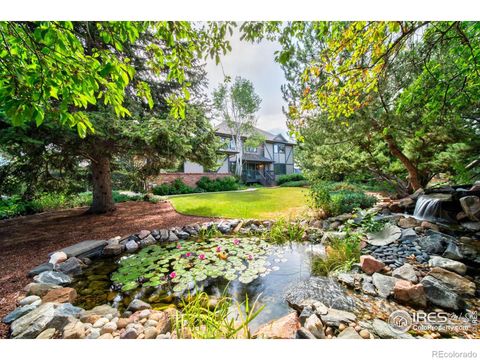
Active
$5,850,000
5
bds
|
6
ba
|
8,222
sqft
|
built
2008
1285 Meadow Pl, Boulder, CO 80304
$-26,169
Cash flow
-23.3%
Cash-on-Cash Return
0.3%
Cap rate
0.1%
Rent to Value Ratio
Active
$1,100,000
4
bds
|
2
ba
|
1,820
sqft
|
built
1978
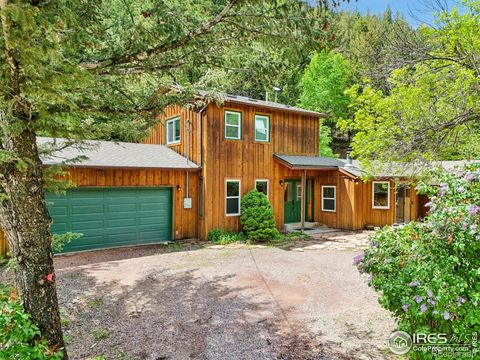
4814 W Moorhead Cir, Boulder, CO 80305
$-3,330
Cash flow
-15.8%
Cash-on-Cash Return
2.0%
Cap rate
0.3%
Rent to Value Ratio
Active
$3,950,000
4
bds
|
4
ba
|
4,131
sqft
|
built
1991
10077 N 75th St, Longmont, CO 80503
$-13,445
Cash flow
-17.8%
Cash-on-Cash Return
1.6%
Cap rate
0.2%
Rent to Value Ratio
Active
$2,200,000
6
bds
|
6
ba
|
5,684
sqft
|
built
2006
13147 Woodridge Dr, Longmont, CO 80504
$-6,794
Cash flow
-16.1%
Cash-on-Cash Return
2.0%
Cap rate
0.3%
Rent to Value Ratio
Active
$600,000
4
bds
|
2
ba
|
1,366
sqft
|
built
1972
4466 Driftwood Pl, Boulder, CO 80301
$-1,014
Cash flow
-8.8%
Cash-on-Cash Return
3.7%
Cap rate
0.5%
Rent to Value Ratio
Active
$380,000
3
bds
|
4
ba
|
1,798
sqft
|
built
2000
1601 Great Western Dr, Longmont, CO 80501
$-859
Cash flow
-11.8%
Cash-on-Cash Return
3.0%
Cap rate
0.6%
Rent to Value Ratio
Active
$1,279,950
5
bds
|
4
ba
|
3,312
sqft
|
built
1989
9020 Rogers Rd, Longmont, CO 80503
$-3,877
Cash flow
-15.8%
Cash-on-Cash Return
2.0%
Cap rate
0.3%
Rent to Value Ratio
Active
$859,000
4
bds
|
2
ba
|
1,860
sqft
|
built
1988
254 Arrowood Dr, Lyons, CO 80540
$-2,243
Cash flow
-13.6%
Cash-on-Cash Return
2.5%
Cap rate
0.3%
Rent to Value Ratio
Active
$599,000
4
bds
|
3
ba
|
1,868
sqft
|
built
1971
1536 S Terry St, Longmont, CO 80501
$-1,330
Cash flow
-11.6%
Cash-on-Cash Return
3.0%
Cap rate
0.4%
Rent to Value Ratio
Active
$2,500,000
6
bds
|
3
ba
|
4,590
sqft
|
built
1973
11131 Lookout Rd, Longmont, CO 80504
$-10,014
Cash flow
-20.9%
Cash-on-Cash Return
0.9%
Cap rate
0.1%
Rent to Value Ratio
Active
$560,000
5
bds
|
4
ba
|
2,442
sqft
|
built
2001
1208 Monarch Dr, Longmont, CO 80504
$-1,019
Cash flow
-9.5%
Cash-on-Cash Return
3.5%
Cap rate
0.5%
Rent to Value Ratio
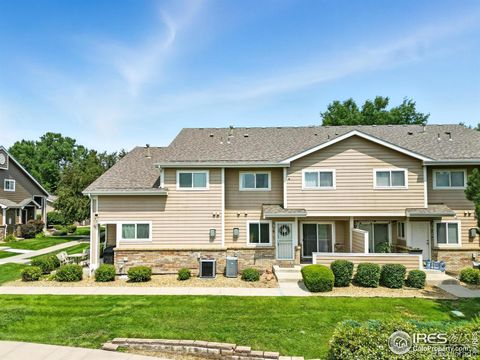
Active
$460,000
2
bds
|
2
ba
|
1,276
sqft
|
built
2002
4501 Nelson Rd, Longmont, CO 80503
$-992
Cash flow
-11.3%
Cash-on-Cash Return
3.1%
Cap rate
0.5%
Rent to Value Ratio
Active
$550,000
3
bds
|
4
ba
|
2,210
sqft
|
built
1985
884 Elliott St, Longmont, CO 80504
$-905
Cash flow
-8.6%
Cash-on-Cash Return
3.7%
Cap rate
0.5%
Rent to Value Ratio
Active
$595,000
3
bds
|
2
ba
|
1,387
sqft
|
built
2004
4500 Baseline Rd, Boulder, CO 80303
$-2,108
Cash flow
-18.5%
Cash-on-Cash Return
1.4%
Cap rate
0.5%
Rent to Value Ratio
Active
$579,000
3
bds
|
3
ba
|
2,150
sqft
|
built
1958
1211 16th Ave, Longmont, CO 80501
$-994
Cash flow
-9.0%
Cash-on-Cash Return
3.6%
Cap rate
0.5%
Rent to Value Ratio
Active
$724,900
2
bds
|
2
ba
|
1,392
sqft
|
built
1997
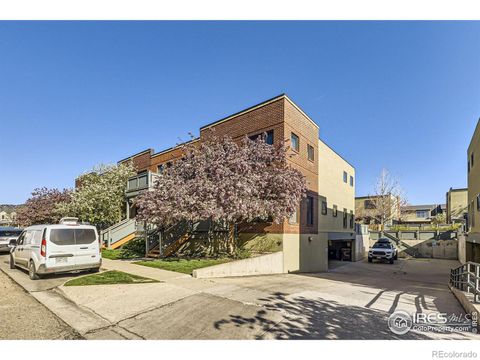
3970 Colorado Ave, Boulder, CO 80303
$-1,994
Cash flow
-14.4%
Cash-on-Cash Return
2.4%
Cap rate
0.4%
Rent to Value Ratio
Active
$849,000
3
bds
|
2
ba
|
1,914
sqft
|
built
1978
5472 White Pl, Boulder, CO 80303
$-2,403
Cash flow
-14.8%
Cash-on-Cash Return
2.3%
Cap rate
0.4%
Rent to Value Ratio
Active
$950,000
4
bds
|
4
ba
|
2,000
sqft
|
built
1980
3673 Hazelwood Ct, Boulder, CO 80304
$-2,906
Cash flow
-16.0%
Cash-on-Cash Return
2.0%
Cap rate
0.3%
Rent to Value Ratio
Active
$465,000
3
bds
|
3
ba
|
1,476
sqft
|
built
1993
5190 Buckingham Rd, Boulder, CO 80301
$-1,162
Cash flow
-13.0%
Cash-on-Cash Return
2.7%
Cap rate
0.6%
Rent to Value Ratio
Active
$510,000
2
bds
|
2
ba
|
1,056
sqft
|
built
1966
1842 Canyon Blvd, Boulder, CO 80302
$-1,636
Cash flow
-16.7%
Cash-on-Cash Return
1.8%
Cap rate
0.4%
Rent to Value Ratio
Active
$2,995,000
6
bds
|
6
ba
|
6,046
sqft
|
built
2004
8911 Little Raven Trl, Niwot, CO 80503
$-8,875
Cash flow
-15.5%
Cash-on-Cash Return
2.1%
Cap rate
0.3%
Rent to Value Ratio
Active
$560,000
1
bds
|
1
ba
|
883
sqft
|
built
2006
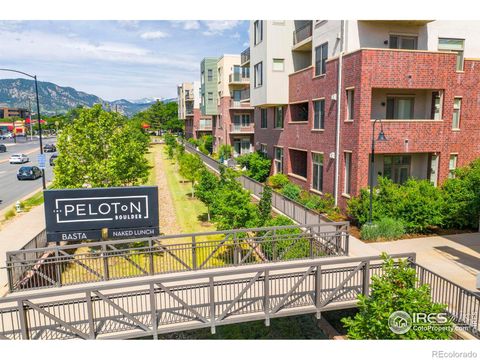
3401 Arapahoe Ave, Boulder, CO 80303
$-1,429
Cash flow
-13.3%
Cash-on-Cash Return
2.6%
Cap rate
0.5%
Rent to Value Ratio
Active
$650,000
3
bds
|
2
ba
|
2,327
sqft
|
built
1899
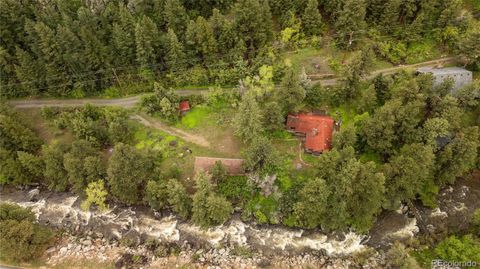
8493 Lefthand Canyon Dr, Jamestown, CO 80455
$-923
Cash flow
-7.4%
Cash-on-Cash Return
4.0%
Cap rate
0.5%
Rent to Value Ratio
Active
$949,000
4
bds
|
3
ba
|
2,657
sqft
|
built
1967
4667 Ashfield Dr, Boulder, CO 80301
$-2,215
Cash flow
-12.2%
Cash-on-Cash Return
2.9%
Cap rate
0.4%
Rent to Value Ratio
Active
$570,000
1
bds
|
1
ba
|
894
sqft
|
built
2006
3301 Arapahoe Ave, Boulder, CO 80303
$-1,422
Cash flow
-13.0%
Cash-on-Cash Return
2.7%
Cap rate
0.5%
Rent to Value Ratio
Active
$1,675,000
4
bds
|
4
ba
|
3,598
sqft
|
built
1990
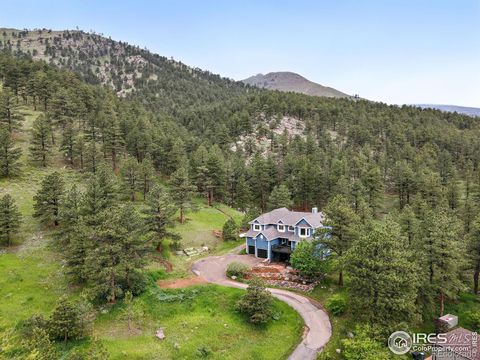
1946 Lefthand Canyon Dr, Boulder, CO 80302
$-5,423
Cash flow
-16.9%
Cash-on-Cash Return
1.8%
Cap rate
0.3%
Rent to Value Ratio
Active
$750,000
3
bds
|
2
ba
|
1,590
sqft
|
built
1983
291 W Sycamore Ln, Louisville, CO 80027
$-1,910
Cash flow
-13.3%
Cash-on-Cash Return
2.6%
Cap rate
0.4%
Rent to Value Ratio
Active
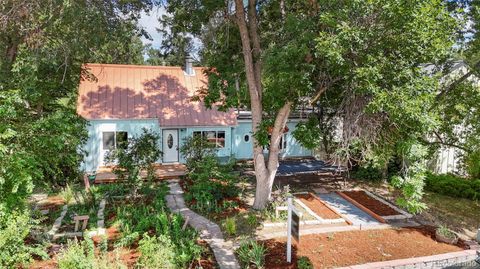
$2,425,000
5
bds
|
5
ba
|
3,048
sqft
|
built
1925
1727 Mapleton Ave, Boulder, CO 80304
$-9,238
Cash flow
-19.9%
Cash-on-Cash Return
1.1%
Cap rate
0.2%
Rent to Value Ratio
Active
$1,250,000
3
bds
|
3
ba
|
2,848
sqft
|
built
1988
8654 Thunderhead Dr, Boulder, CO 80302
$-3,161
Cash flow
-13.2%
Cash-on-Cash Return
2.6%
Cap rate
0.4%
Rent to Value Ratio
Active
$610,000
2
bds
|
1
ba
|
800
sqft
|
built
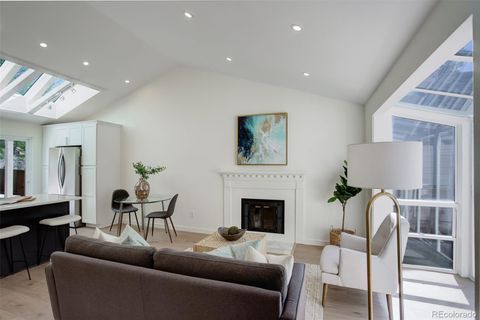
2014
1707 Walnut St, Boulder, CO 80302
$-1,501
Cash flow
-12.8%
Cash-on-Cash Return
2.7%
Cap rate
0.5%
Rent to Value Ratio
Active
$799,000
1
bds
|
2
ba
|
800
sqft
|
built
2014
1707 Walnut St, Boulder, CO 80302
$-2,464
Cash flow
-16.1%
Cash-on-Cash Return
2.0%
Cap rate
0.3%
Rent to Value Ratio
Active
$825,000
6
bds
|
3
ba
|
2,315
sqft
|
built
1958
510 S 46th St, Boulder, CO 80305
$-2,103
Cash flow
-13.3%
Cash-on-Cash Return
2.6%
Cap rate
0.4%
Rent to Value Ratio
Active
$849,000
4
bds
|
2
ba
|
2,214
sqft
|
built
1923
3116 47th St, Boulder, CO 80301
$-1,974
Cash flow
-12.1%
Cash-on-Cash Return
2.9%
Cap rate
0.4%
Rent to Value Ratio
Active
$499,000
1
bds
|
1
ba
|
858
sqft
|
built
2004
3215 Foundry Pl, Boulder, CO 80301
$-1,518
Cash flow
-15.9%
Cash-on-Cash Return
2.0%
Cap rate
0.4%
Rent to Value Ratio
Active
$550,000
2
bds
|
1
ba
|
944
sqft
|
built
1909
35106 Boulder Canyon Dr, Boulder, CO 80302
$-887
Cash flow
-8.4%
Cash-on-Cash Return
3.7%
Cap rate
0.5%
Rent to Value Ratio