Boulder County Investment Properties for Sale
Browse homes for sale and investment properties in Boulder County. Refine your search by price, property type, or more.
Best cash flowing properties in Boulder County
Active
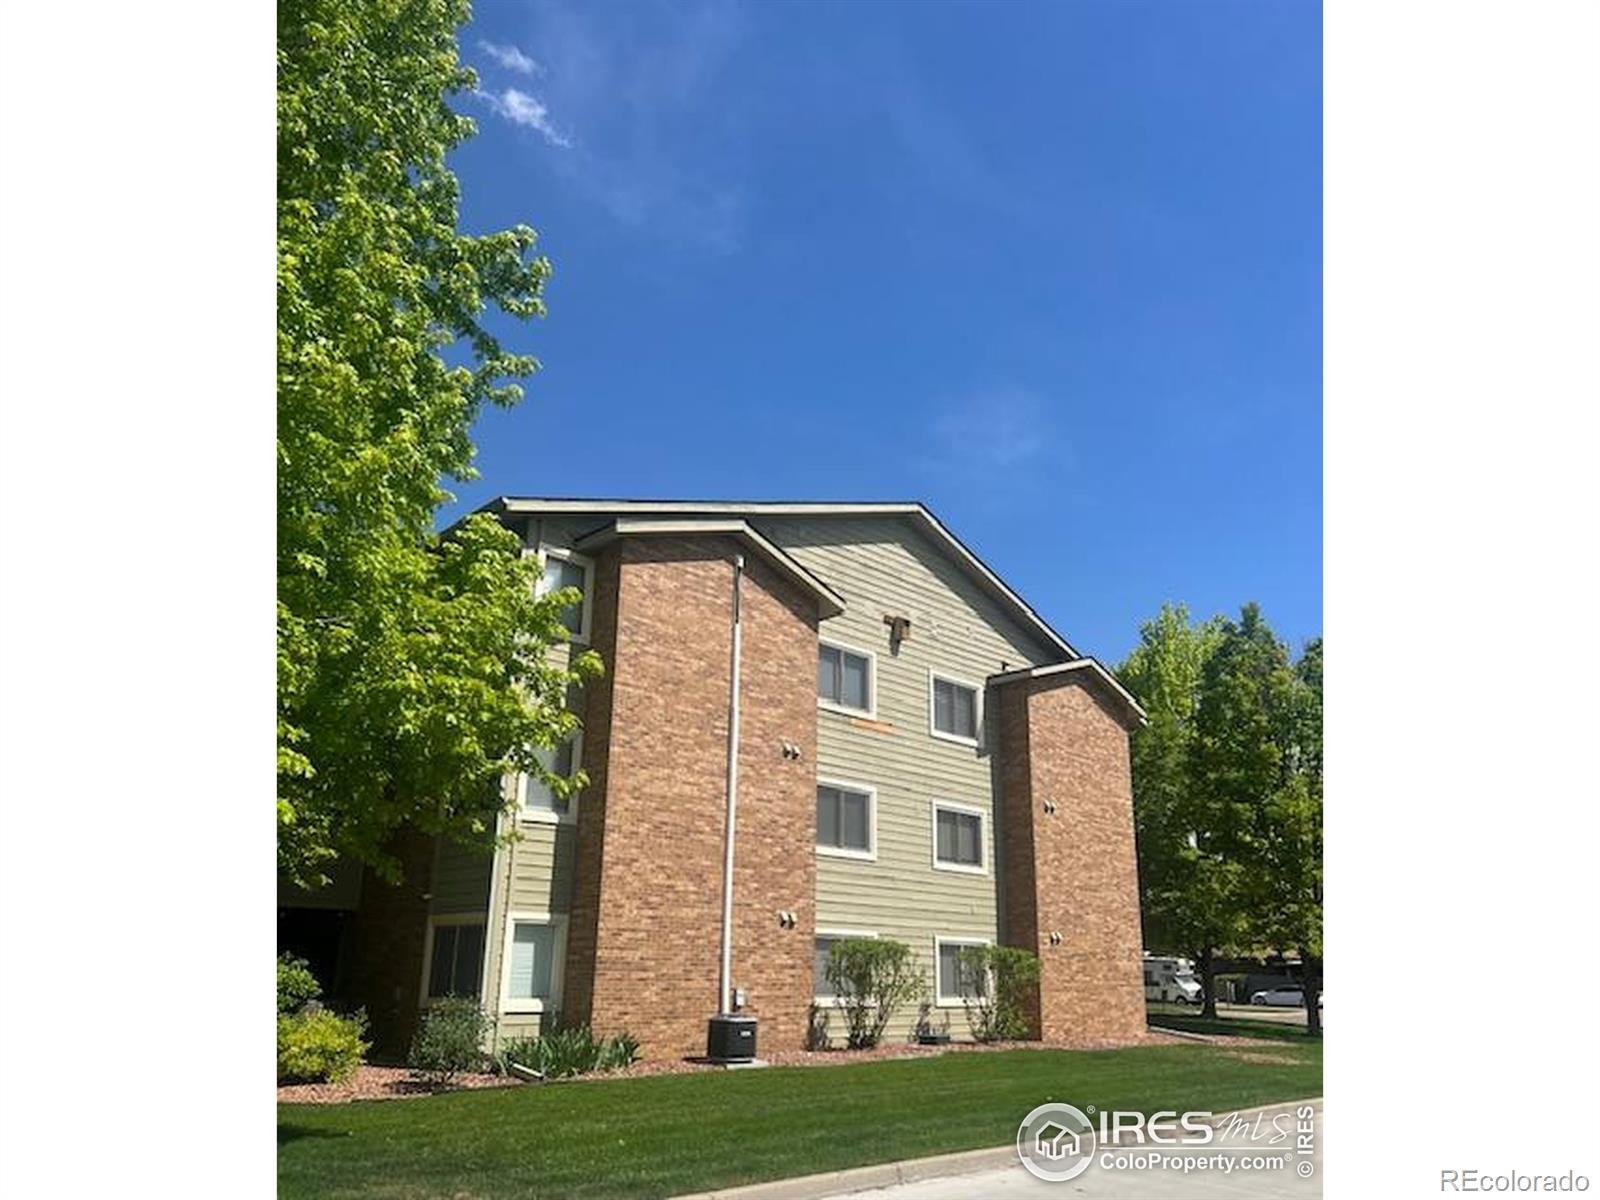
$230,000
2
bds
|
2
ba
|
1,043
sqft
|
built
1983
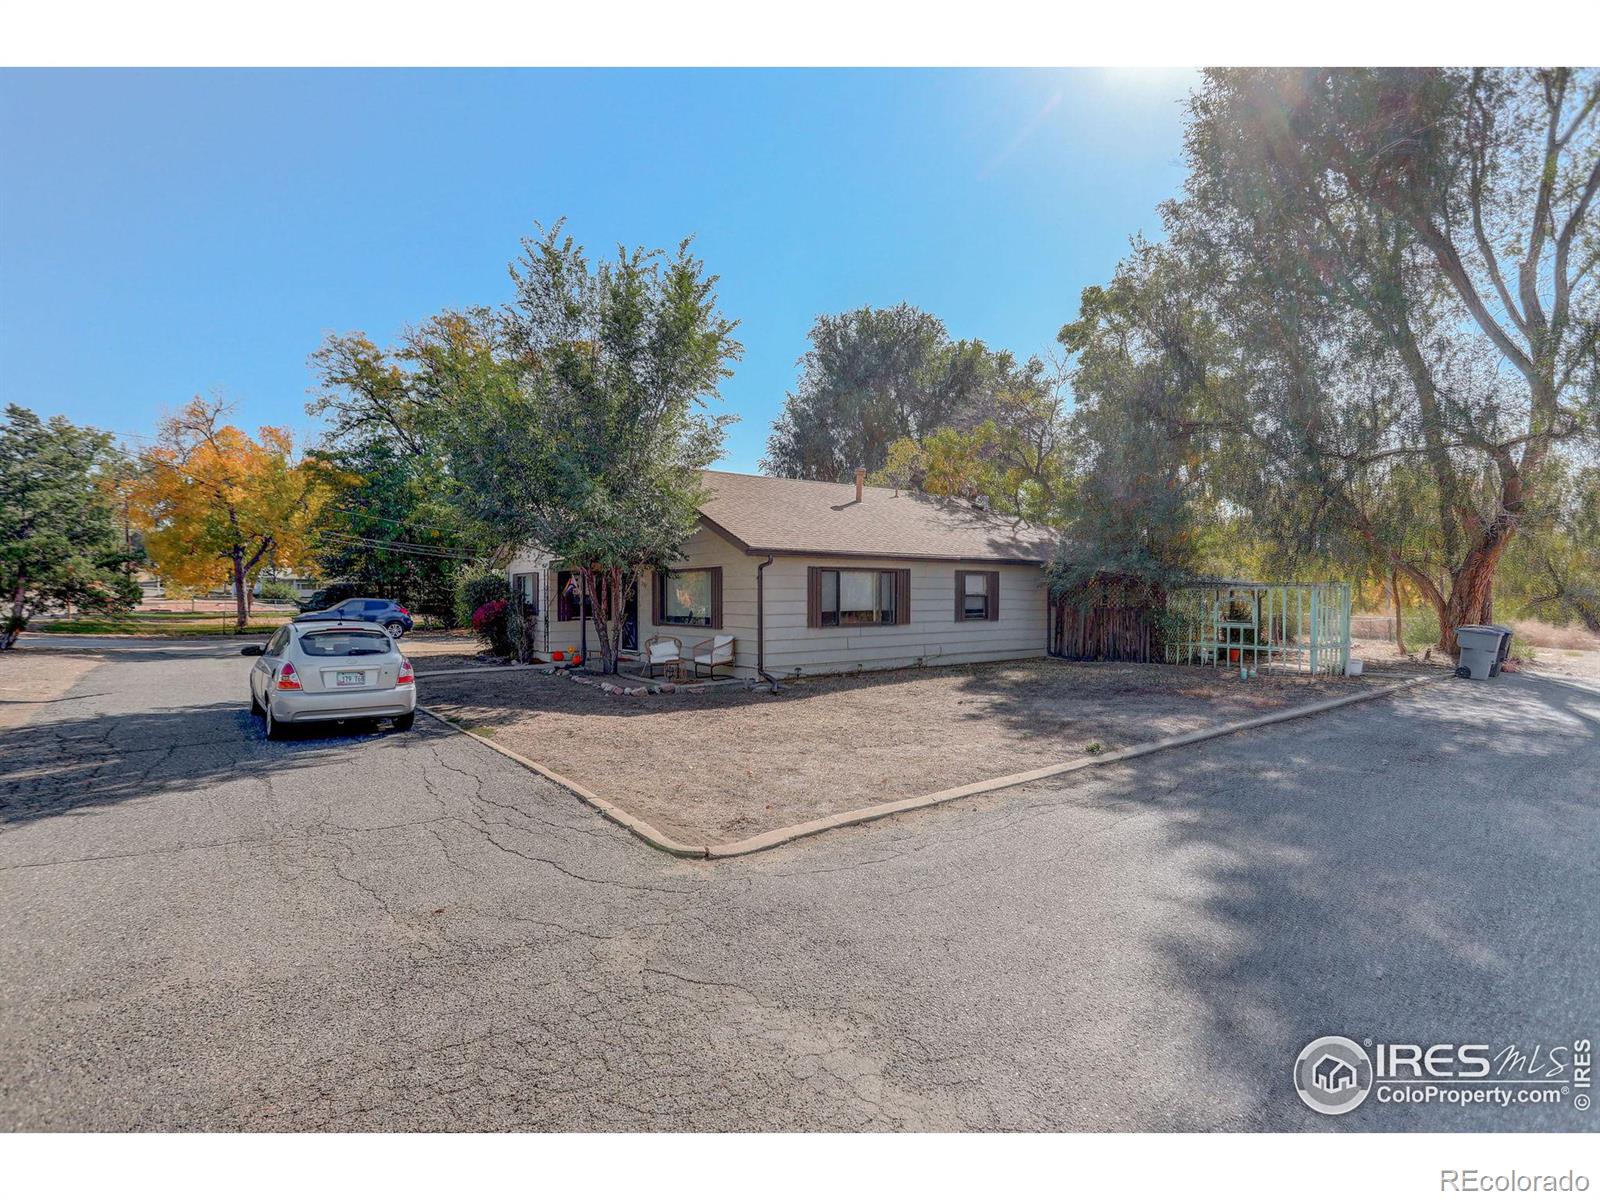
50 19th Ave, Longmont, CO 80501
$-308
Cash flow
-7.0%
Cash-on-Cash Return
4.1%
Cap rate
0.8%
Rent to Value Ratio
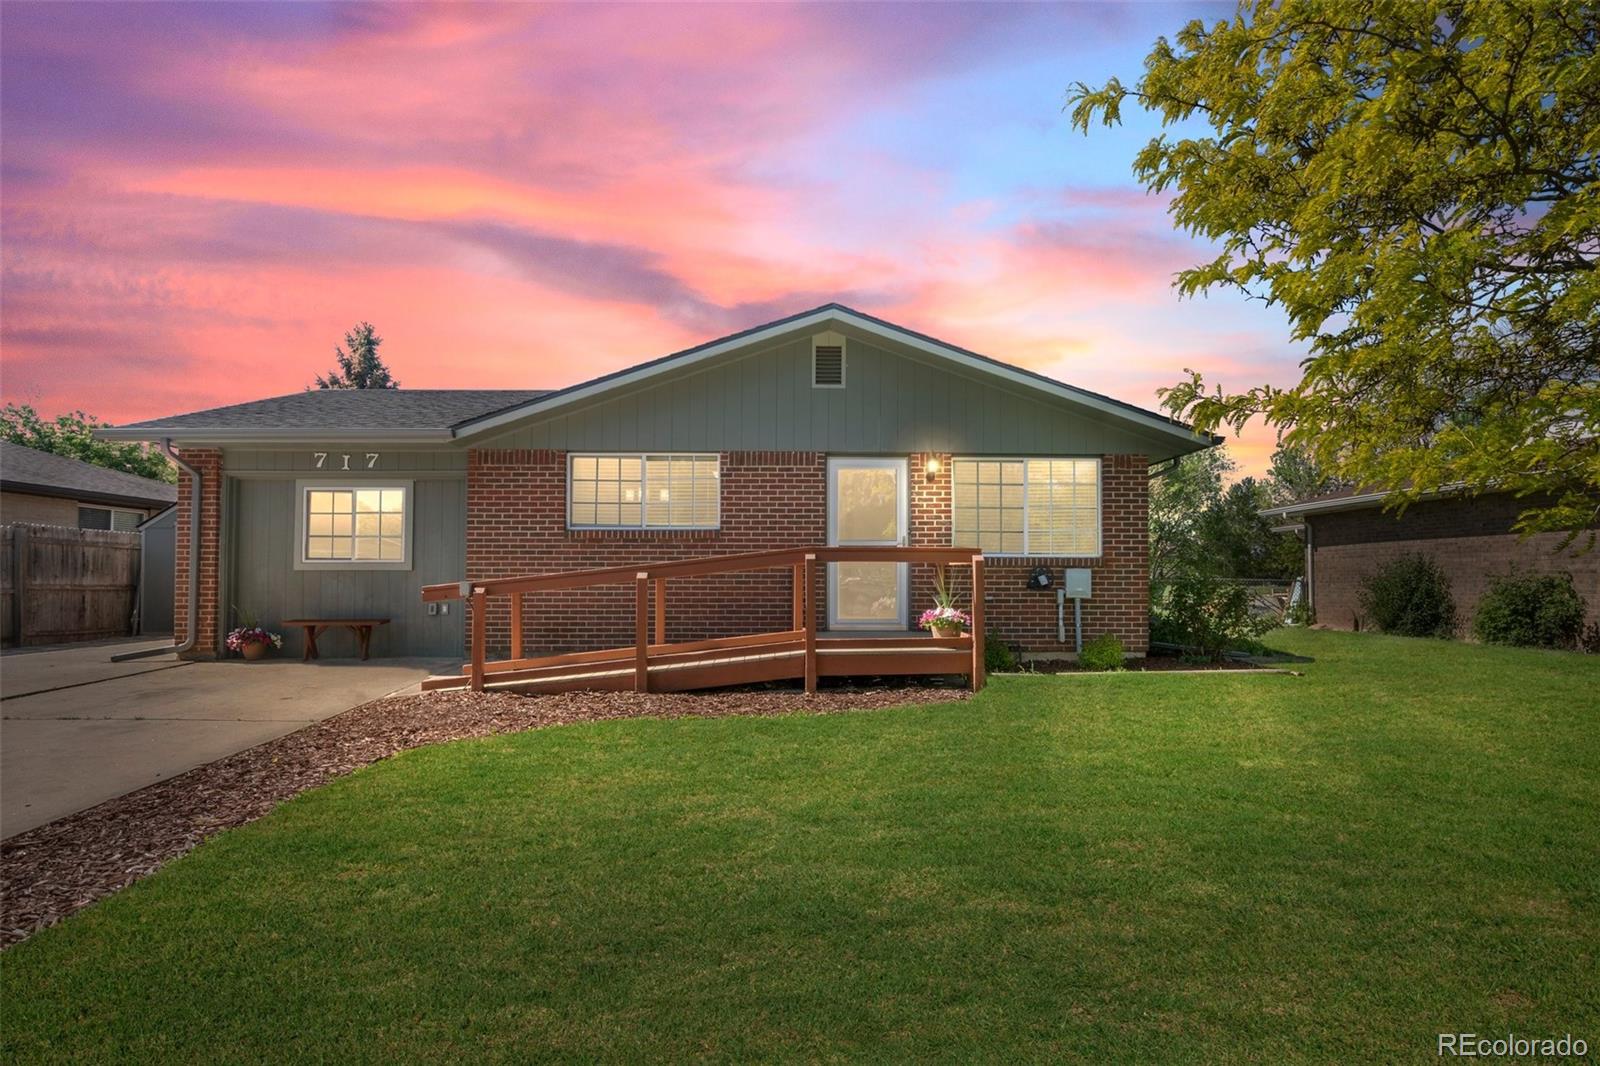
Active under contract
$445,000
3
bds
|
1
ba
|
1,375
sqft
|
built
1972
717 E 4th Ave, Longmont, CO 80504
$-698
Cash flow
-8.2%
Cash-on-Cash Return
3.8%
Cap rate
0.5%
Rent to Value Ratio
1,199 out of 1,339 properties for sale in Boulder County
Limited Results Shown
Create a free account, or log in to reveal all property listings and enjoy the complete experience.
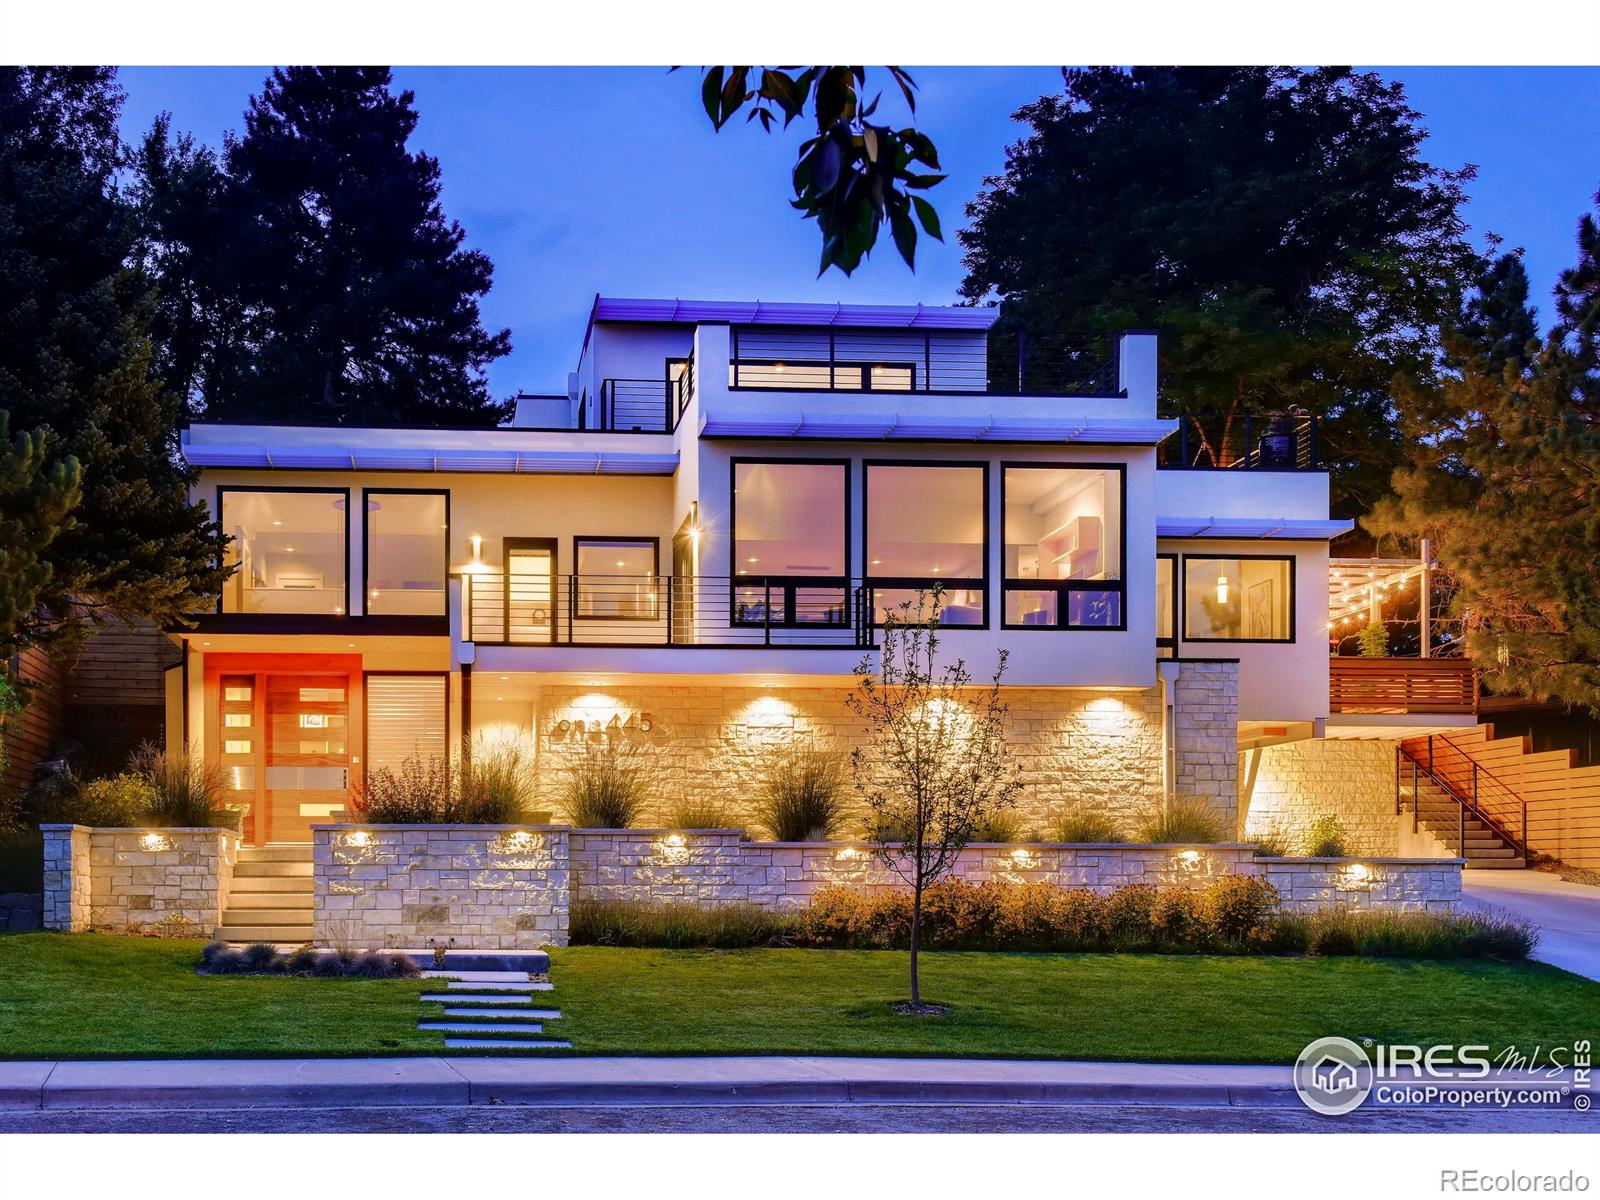
Active
$5,495,000
4
bds
|
4
ba
|
4,189
sqft
|
built
2016
1445 Moss Rock Pl, Boulder, CO 80304
$-20,633
Cash flow
-19.6%
Cash-on-Cash Return
1.2%
Cap rate
0.2%
Rent to Value Ratio
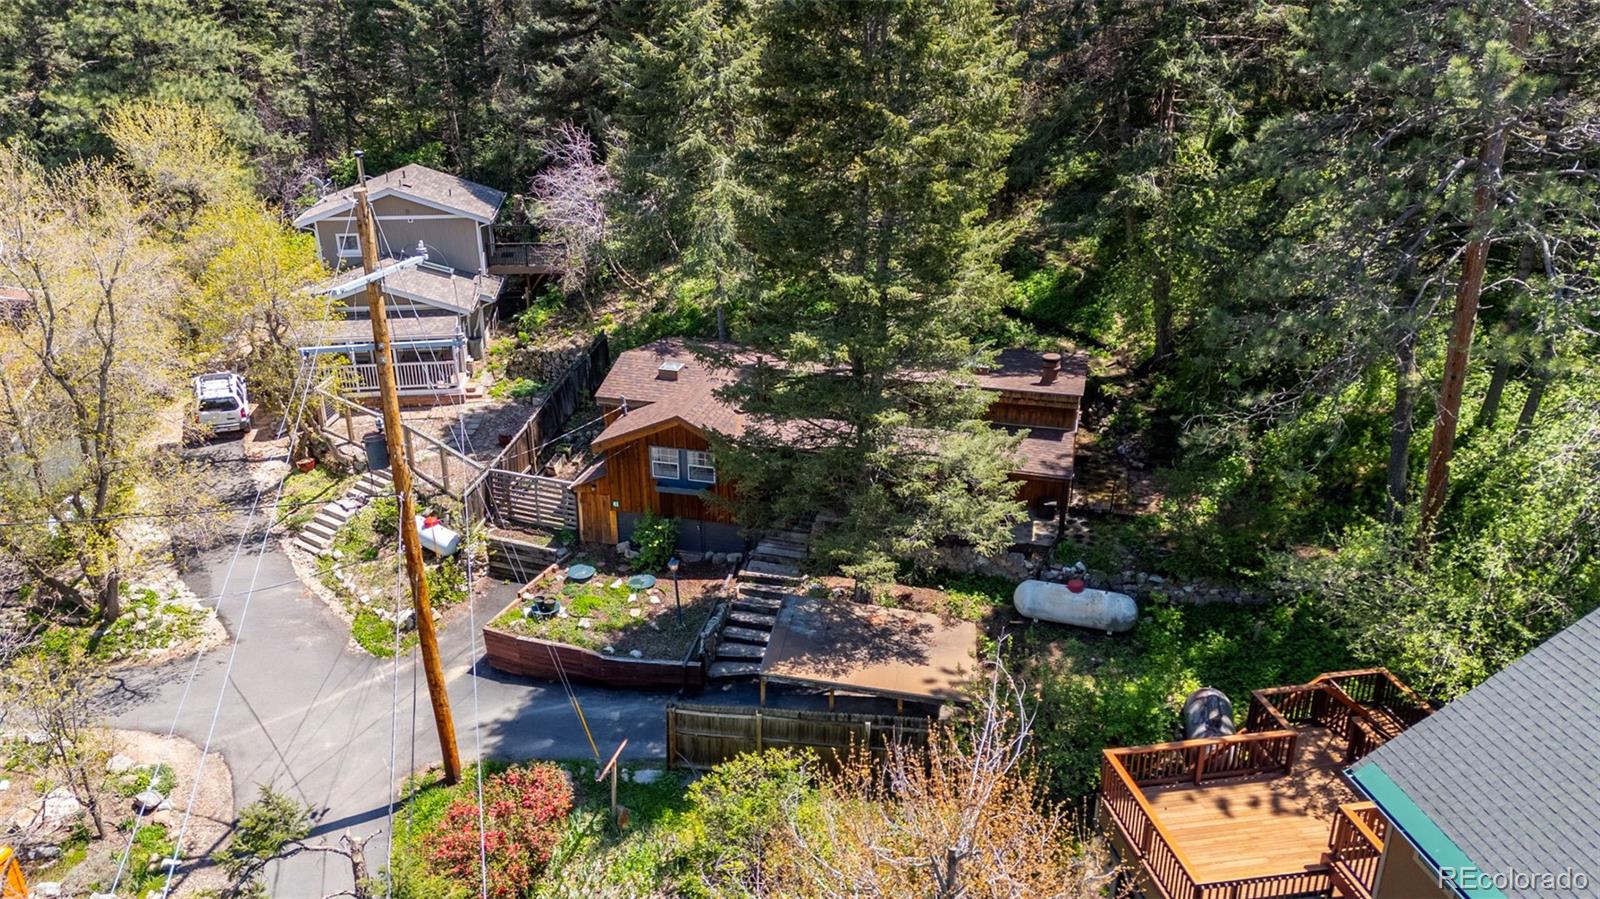
Active
$699,777
2
bds
|
1
ba
|
958
sqft
|
built
1940
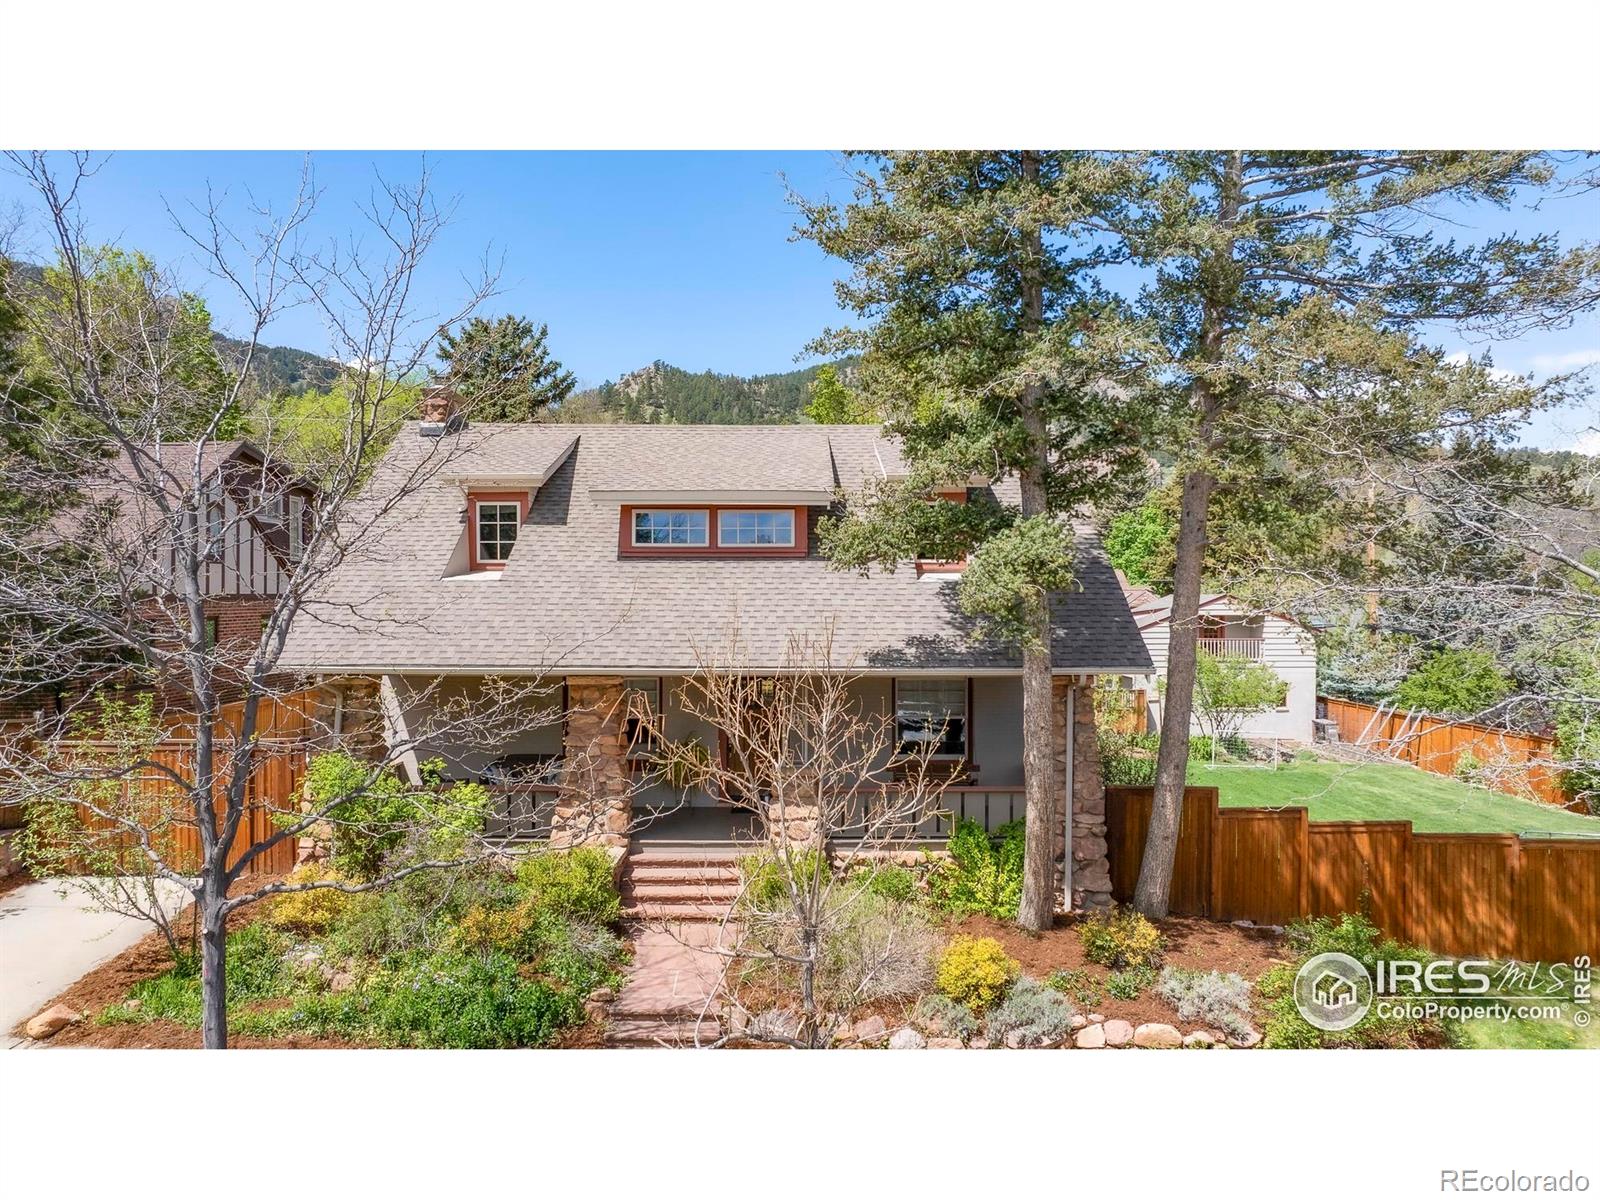
41 Silver Spruce, Boulder, CO 80302
$-1,573
Cash flow
-11.7%
Cash-on-Cash Return
3.0%
Cap rate
0.4%
Rent to Value Ratio
Active under contract
$1,200,000
2
bds
|
3
ba
|
1,296
sqft
|
built
2009
2050 Walnut St, Boulder, CO 80302
$-3,862
Cash flow
-16.8%
Cash-on-Cash Return
1.8%
Cap rate
0.4%
Rent to Value Ratio
Active
$4,795,000
4
bds
|
5
ba
|
4,210
sqft
|
built
2023
2586 3rd St, Boulder, CO 80304
$-15,916
Cash flow
-17.3%
Cash-on-Cash Return
1.7%
Cap rate
0.2%
Rent to Value Ratio
Active
$1,575,000
3
bds
|
3
ba
|
2,019
sqft
|
built
1977
1198 Crestmoor Dr, Boulder, CO 80303
$-5,391
Cash flow
-17.9%
Cash-on-Cash Return
1.6%
Cap rate
0.3%
Rent to Value Ratio
Active
$879,000
4
bds
|
2
ba
|
1,928
sqft
|
built
1930
1245 Longs Peak Ave, Longmont, CO 80501
$-2,098
Cash flow
-12.5%
Cash-on-Cash Return
2.8%
Cap rate
0.4%
Rent to Value Ratio
Active
$417,500
2
bds
|
2
ba
|
968
sqft
|
built
1978
3740 Iris Ave, Boulder, CO 80301
$-932
Cash flow
-11.6%
Cash-on-Cash Return
3.0%
Cap rate
0.6%
Rent to Value Ratio
Active
$550,000
3
bds
|
2
ba
|
1,200
sqft
|
built
1910
219 Terry St, Longmont, CO 80501
$-1,526
Cash flow
-14.5%
Cash-on-Cash Return
2.3%
Cap rate
0.4%
Rent to Value Ratio
Active
$572,000
4
bds
|
3
ba
|
2,512
sqft
|
built
1964
1700 Jewel Dr, Longmont, CO 80501
$-1,471
Cash flow
-13.4%
Cash-on-Cash Return
2.6%
Cap rate
0.3%
Rent to Value Ratio
Active under contract
$535,000
3
bds
|
2
ba
|
1,428
sqft
|
built
1962
1204 Sherri Mar Ct, Longmont, CO 80501
$-1,020
Cash flow
-9.9%
Cash-on-Cash Return
3.4%
Cap rate
0.5%
Rent to Value Ratio
Active
$689,000
4
bds
|
3
ba
|
1,941
sqft
|
built
1965
12734 Anhawa Ave, Longmont, CO 80503
$-1,466
Cash flow
-11.1%
Cash-on-Cash Return
3.1%
Cap rate
0.4%
Rent to Value Ratio
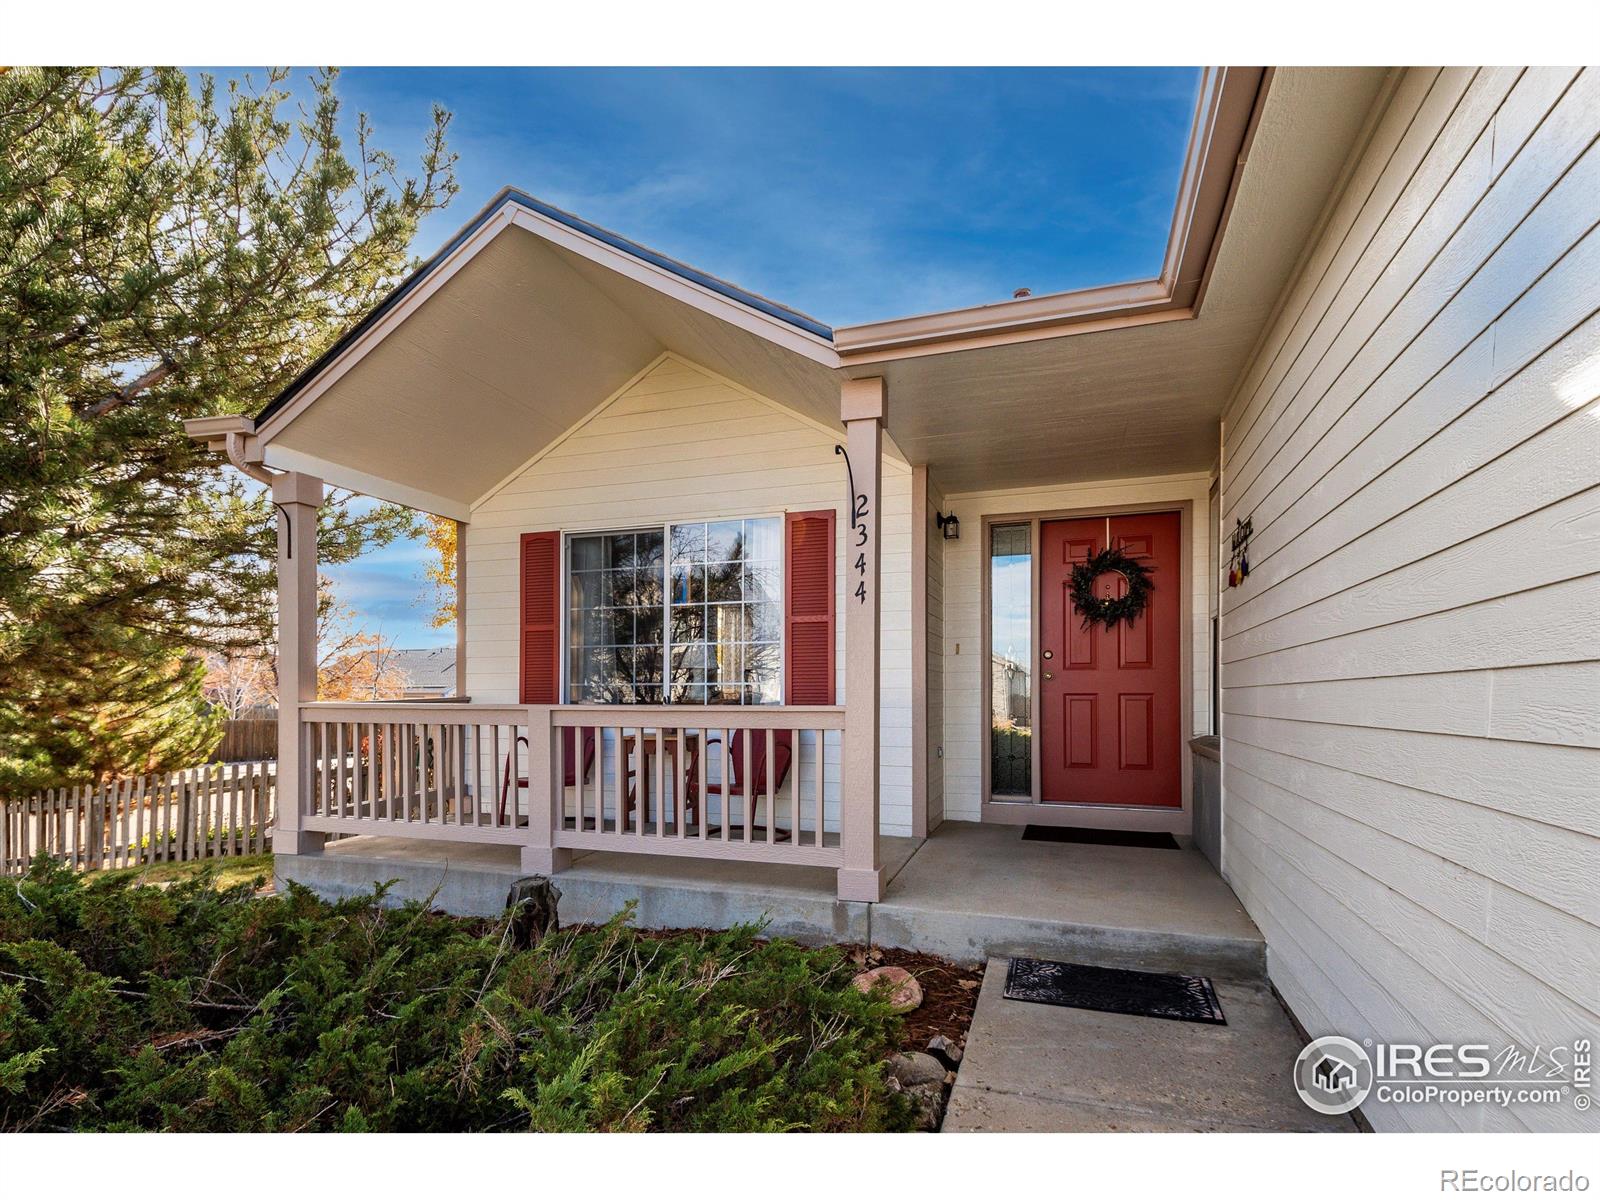
Active
$649,000
4
bds
|
4
ba
|
3,269
sqft
|
built
2000
2344 Flagstaff Dr, Longmont, CO 80504
$-1,231
Cash flow
-9.9%
Cash-on-Cash Return
3.4%
Cap rate
0.5%
Rent to Value Ratio
Active
$998,500
2
bds
|
2
ba
|
1,211
sqft
|
built
1994
750 Cougar Dr, Boulder, CO 80302
$-2,719
Cash flow
-14.2%
Cash-on-Cash Return
2.4%
Cap rate
0.4%
Rent to Value Ratio
Active
$512,000
1
bds
|
1
ba
|
972
sqft
|
built
1984
2201 Pearl St, Boulder, CO 80302
$-1,736
Cash flow
-17.7%
Cash-on-Cash Return
1.6%
Cap rate
0.4%
Rent to Value Ratio
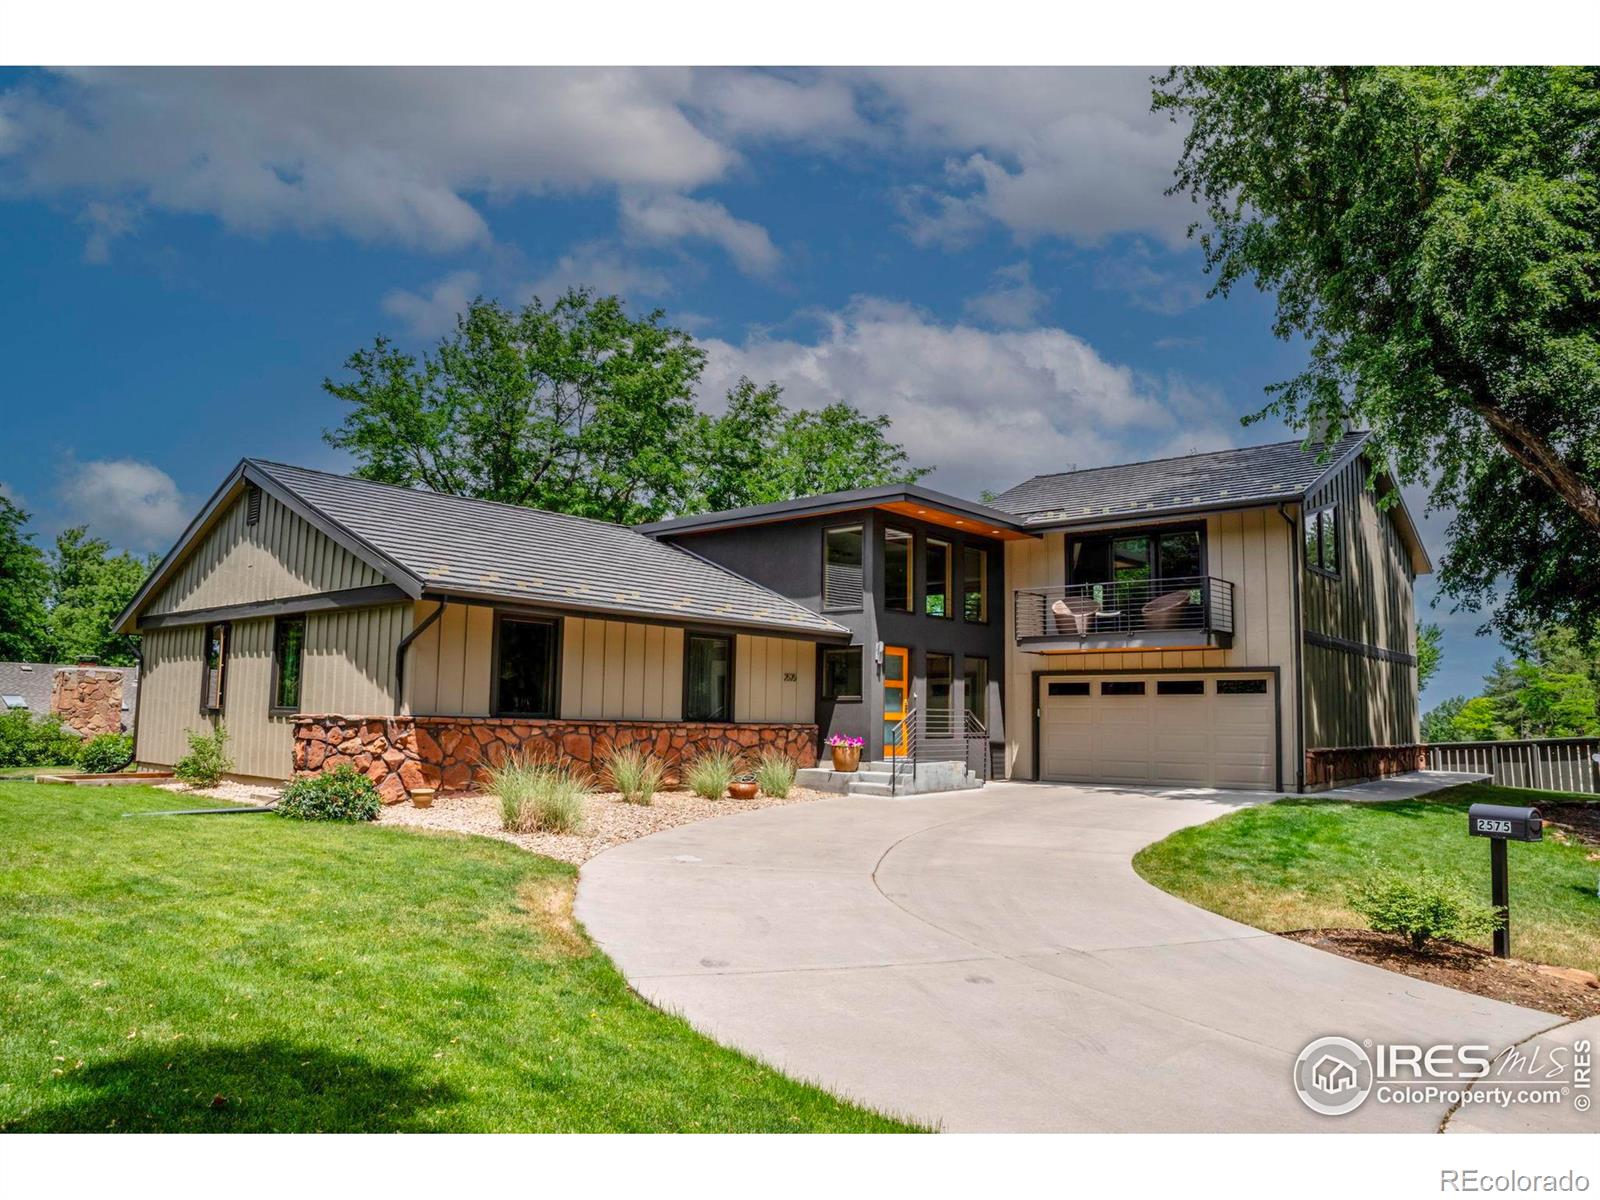
Active
$2,495,000
4
bds
|
3
ba
|
4,046
sqft
|
built
1968
2575 Briarwood Dr, Boulder, CO 80305
$-6,904
Cash flow
-14.4%
Cash-on-Cash Return
2.4%
Cap rate
0.4%
Rent to Value Ratio
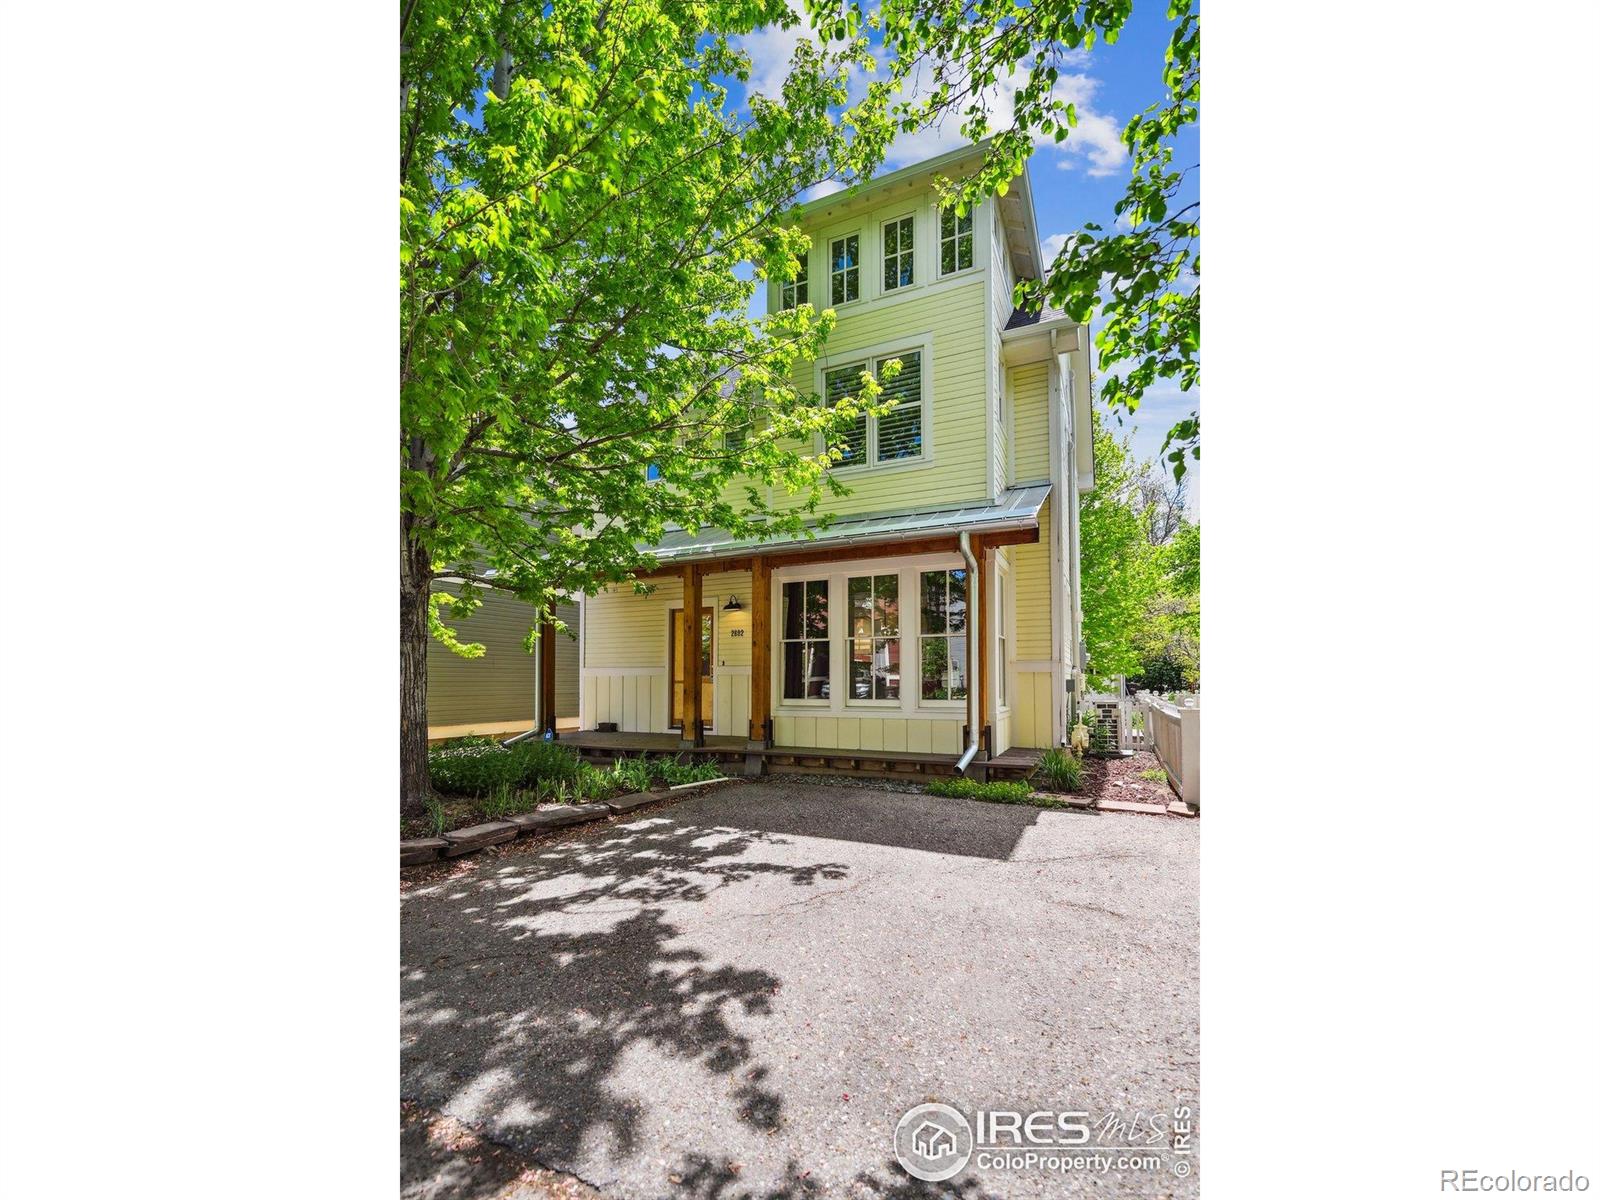
Active
$1,200,000
3
bds
|
3
ba
|
2,101
sqft
|
built
1999
2602 Tumwater Ln, Boulder, CO 80304
$-3,273
Cash flow
-14.2%
Cash-on-Cash Return
2.4%
Cap rate
0.4%
Rent to Value Ratio
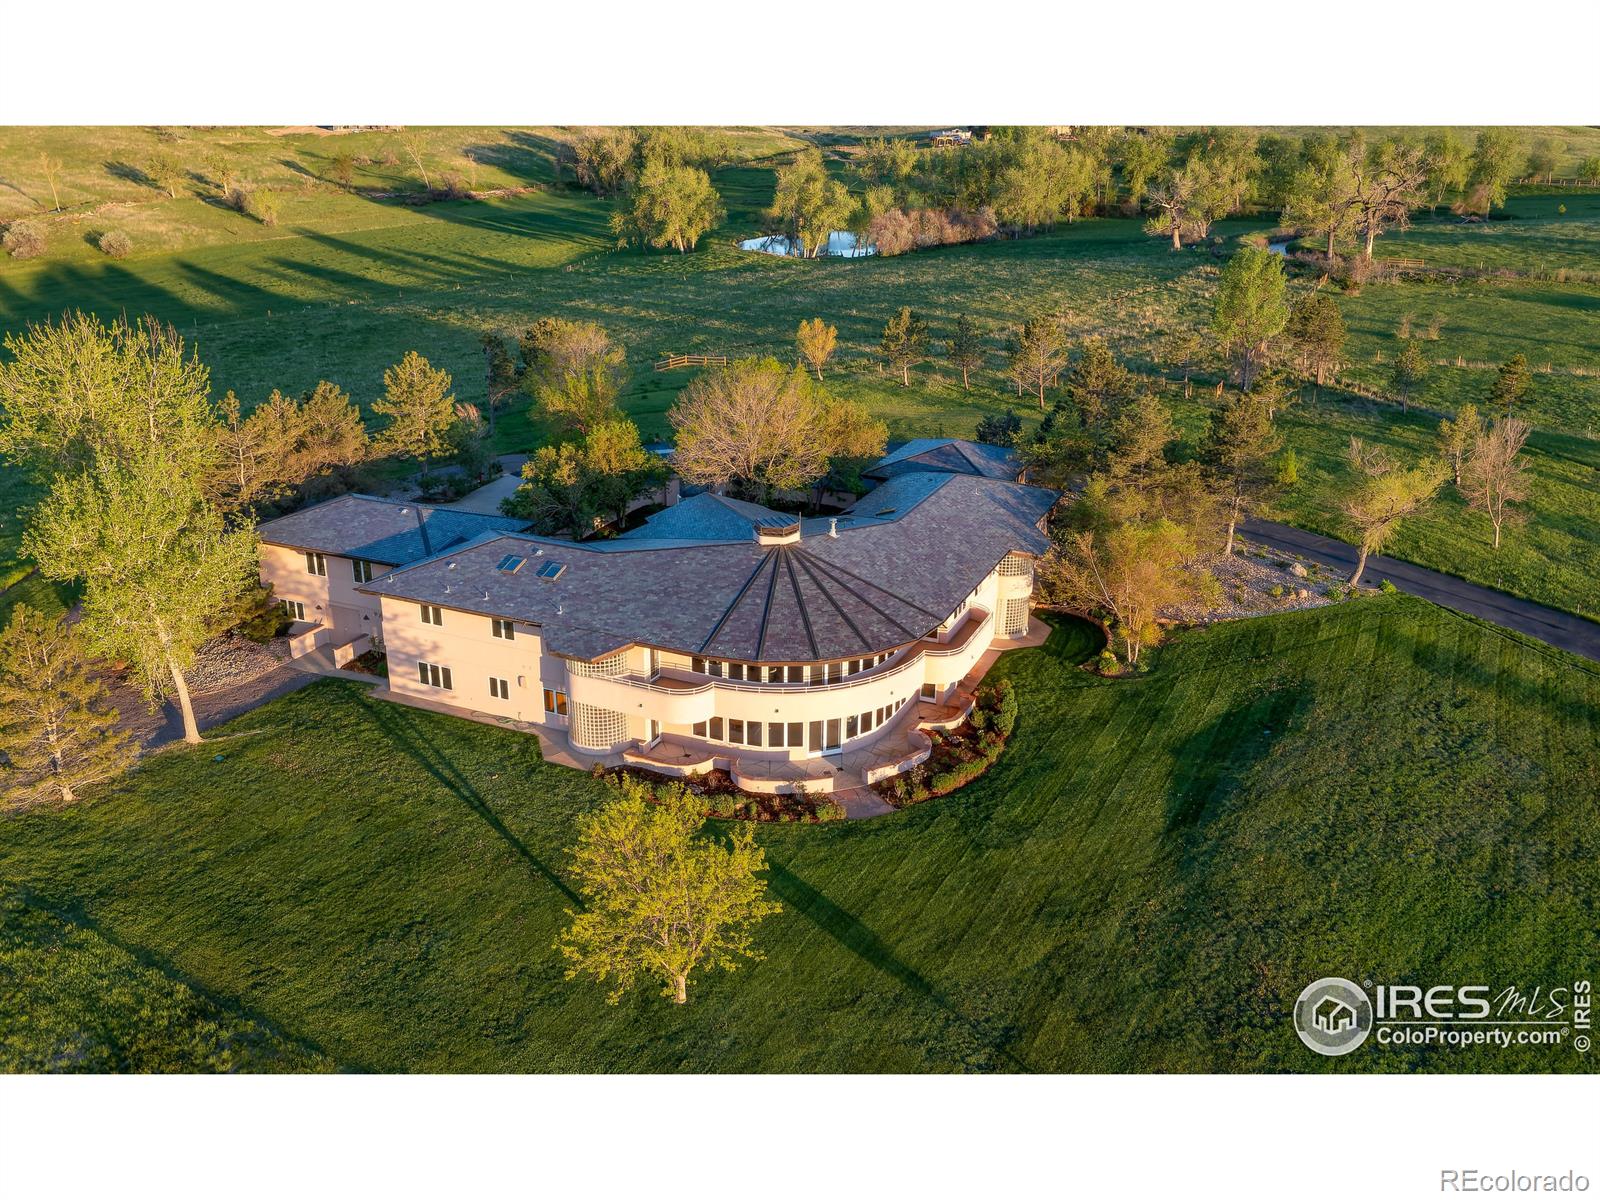
Active
$14,800,000
5
bds
|
7
ba
|
8,884
sqft
|
built
1997
640 S 68th St, Boulder, CO 80303
$-64,518
Cash flow
-22.7%
Cash-on-Cash Return
0.4%
Cap rate
0.1%
Rent to Value Ratio
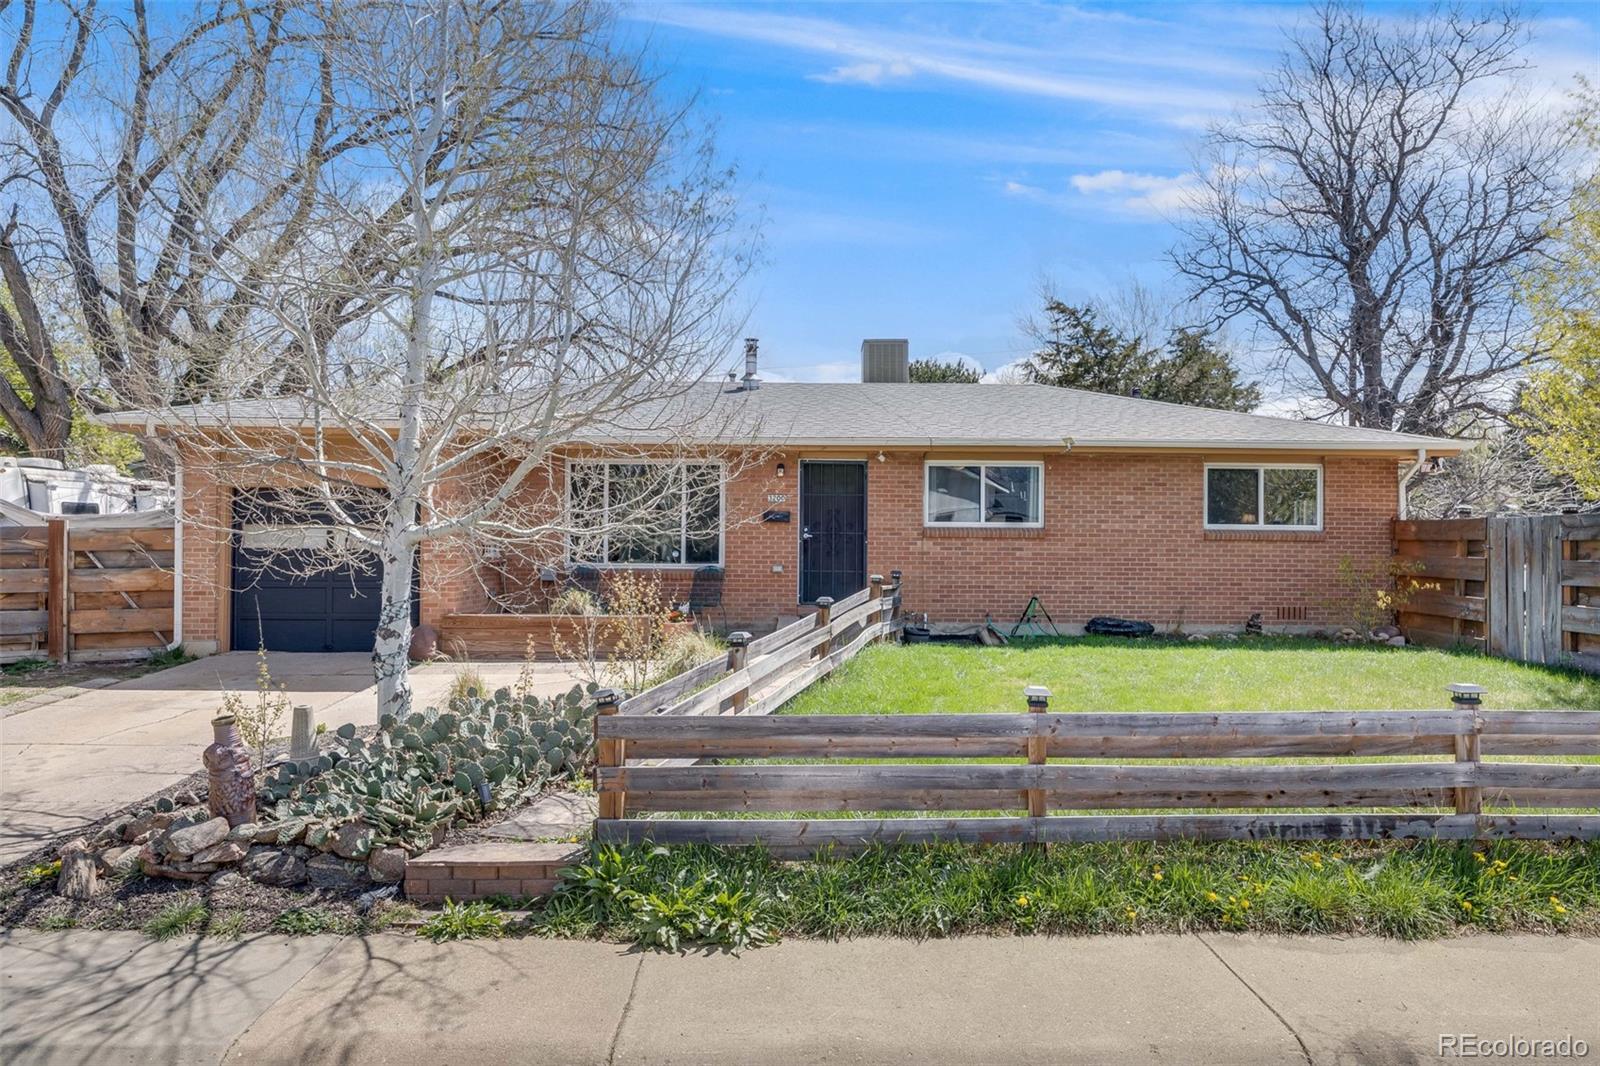
Active
$799,000
3
bds
|
2
ba
|
1,204
sqft
|
built
1956
3200 Eastman Ave, Boulder, CO 80305
$-1,997
Cash flow
-13.0%
Cash-on-Cash Return
2.7%
Cap rate
0.4%
Rent to Value Ratio
Active
$695,000
6
bds
|
0
ba
|
0
sqft
|
built
1956
2107 3rd Ave, Longmont, CO 80501
$-2,024
Cash flow
-15.2%
Cash-on-Cash Return
2.2%
Cap rate
0.3%
Rent to Value Ratio
Active
$725,000
2
bds
|
2
ba
|
940
sqft
|
built
2014
1707 Walnut St, Boulder, CO 80302
$-1,932
Cash flow
-13.9%
Cash-on-Cash Return
2.5%
Cap rate
0.4%
Rent to Value Ratio
Active
$2,790,000
4
bds
|
5
ba
|
2,793
sqft
|
built
1911
721 9th St, Boulder, CO 80302
$-9,900
Cash flow
-18.5%
Cash-on-Cash Return
1.4%
Cap rate
0.2%
Rent to Value Ratio
Active
$738,000
2
bds
|
3
ba
|
2,935
sqft
|
built
2001
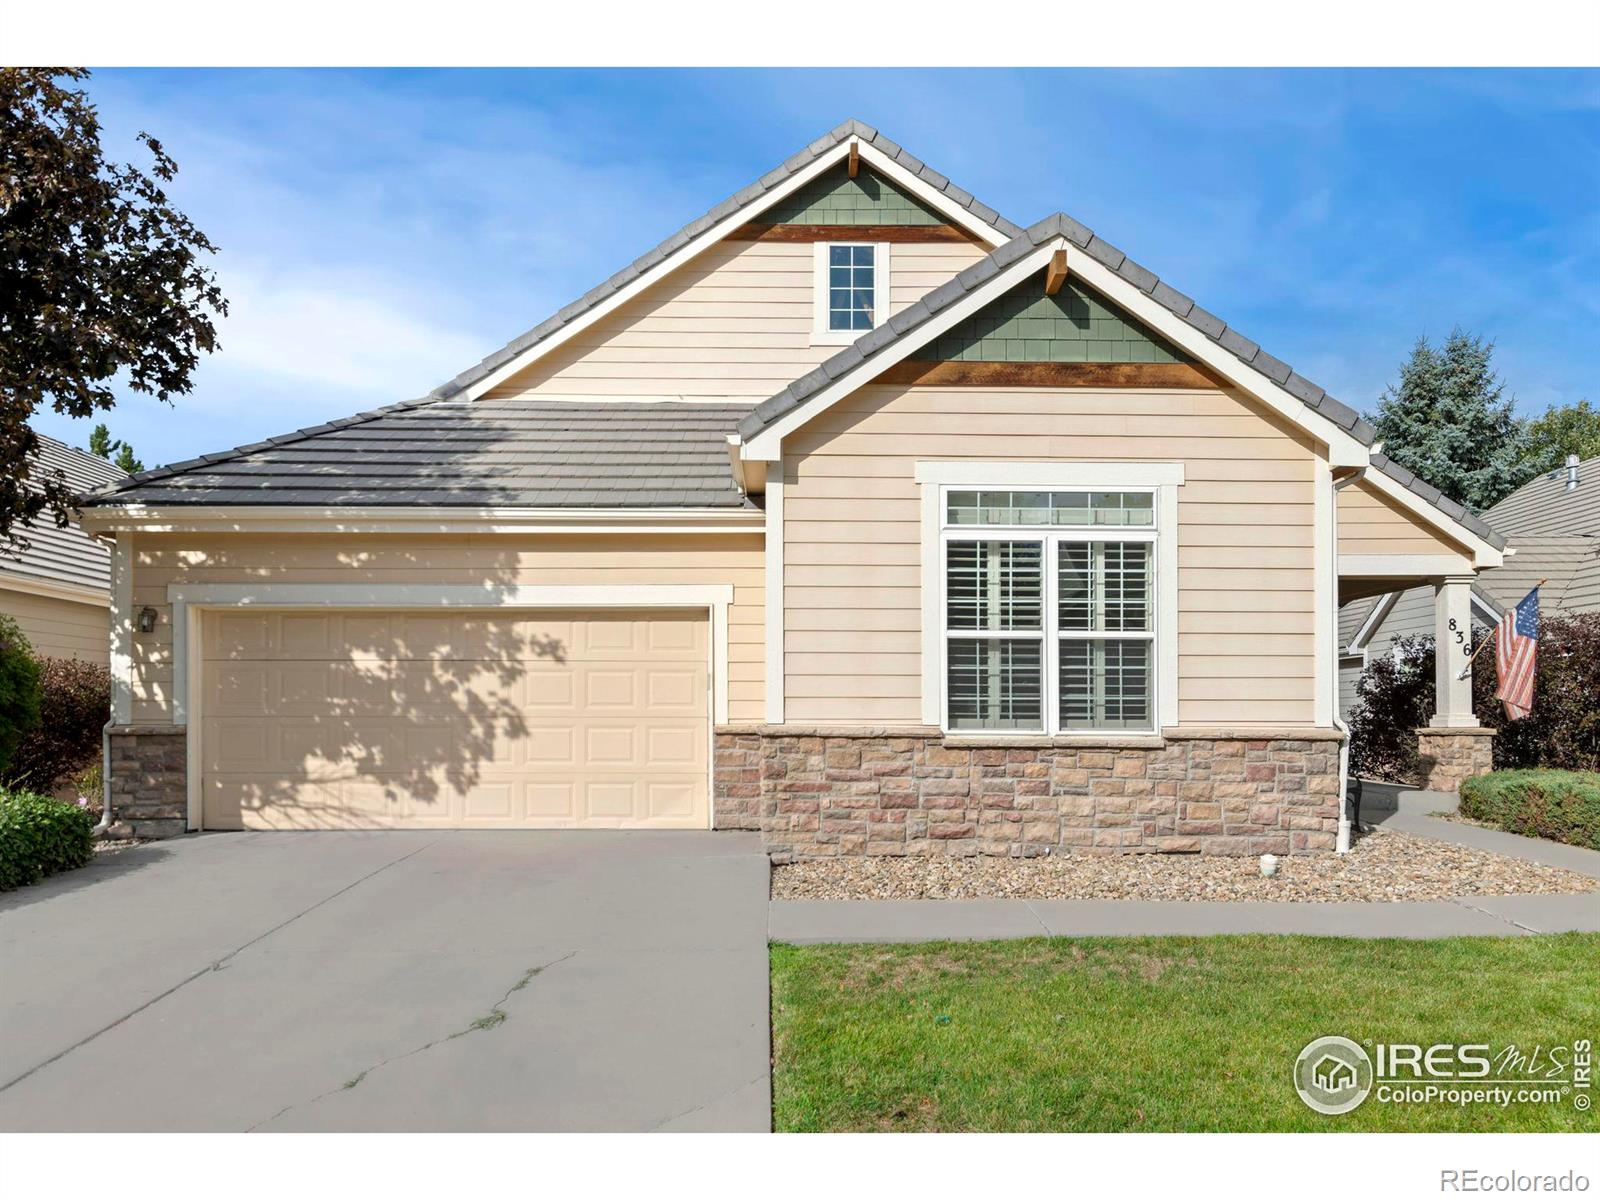
836 Windflower Dr, Longmont, CO 80504
$-1,764
Cash flow
-12.5%
Cash-on-Cash Return
2.8%
Cap rate
0.5%
Rent to Value Ratio
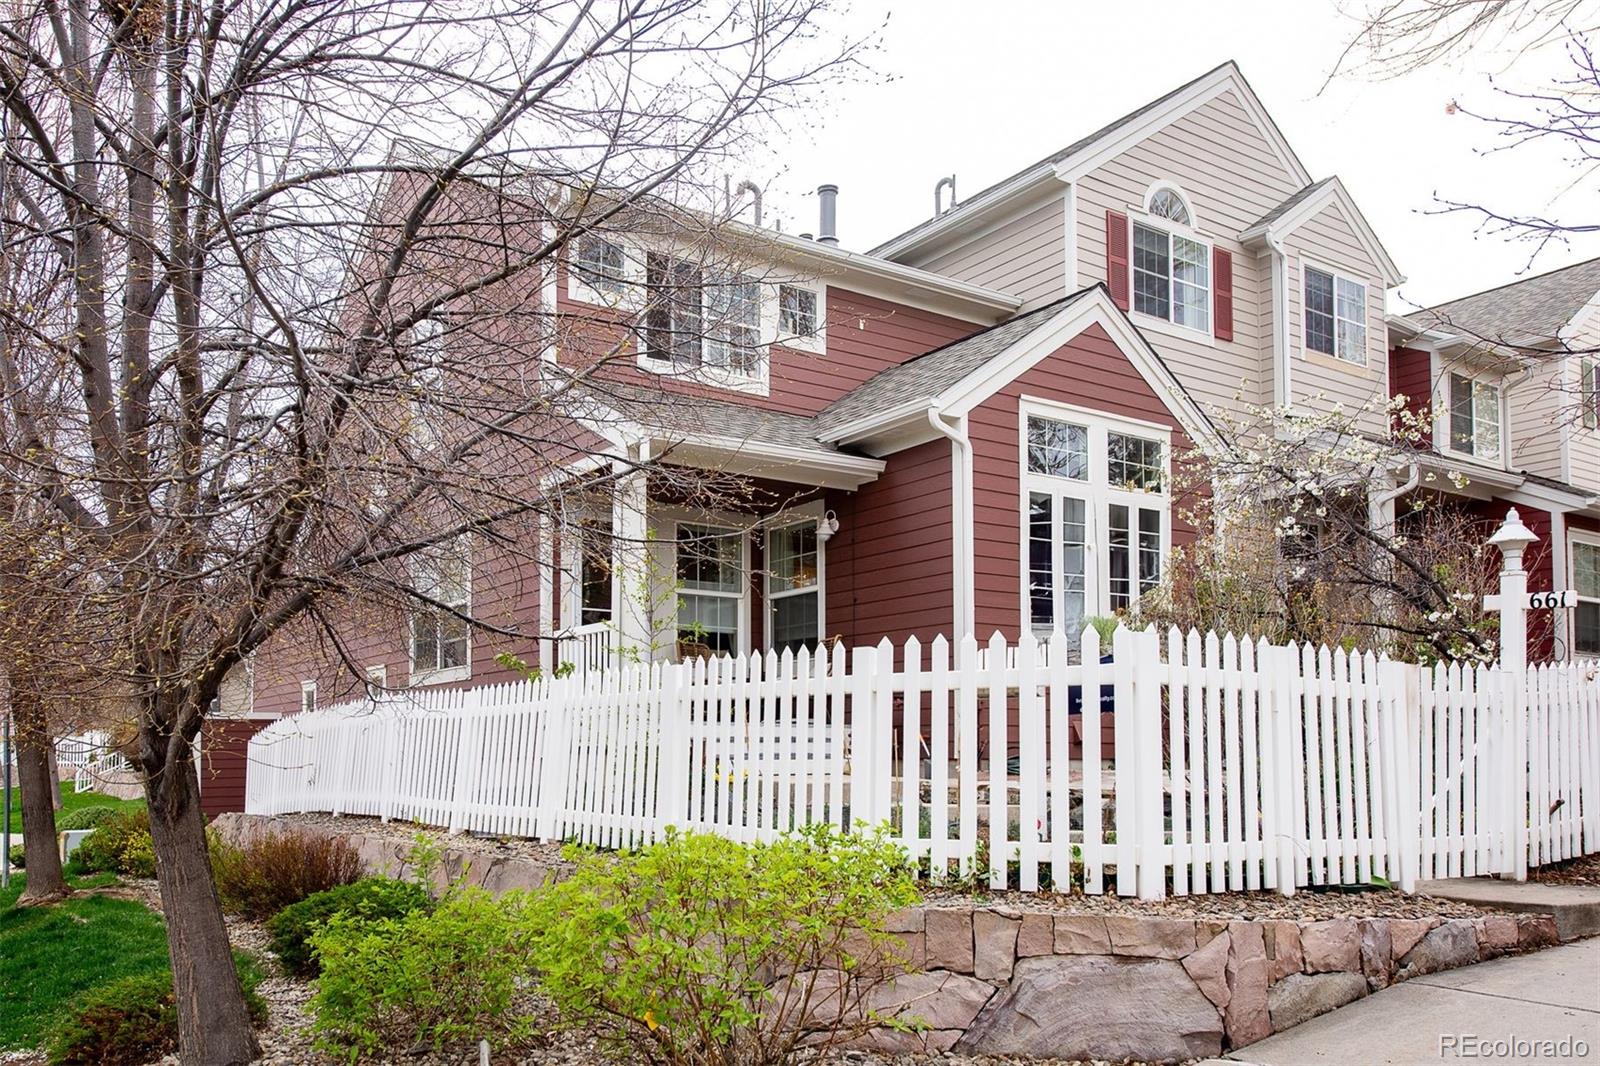
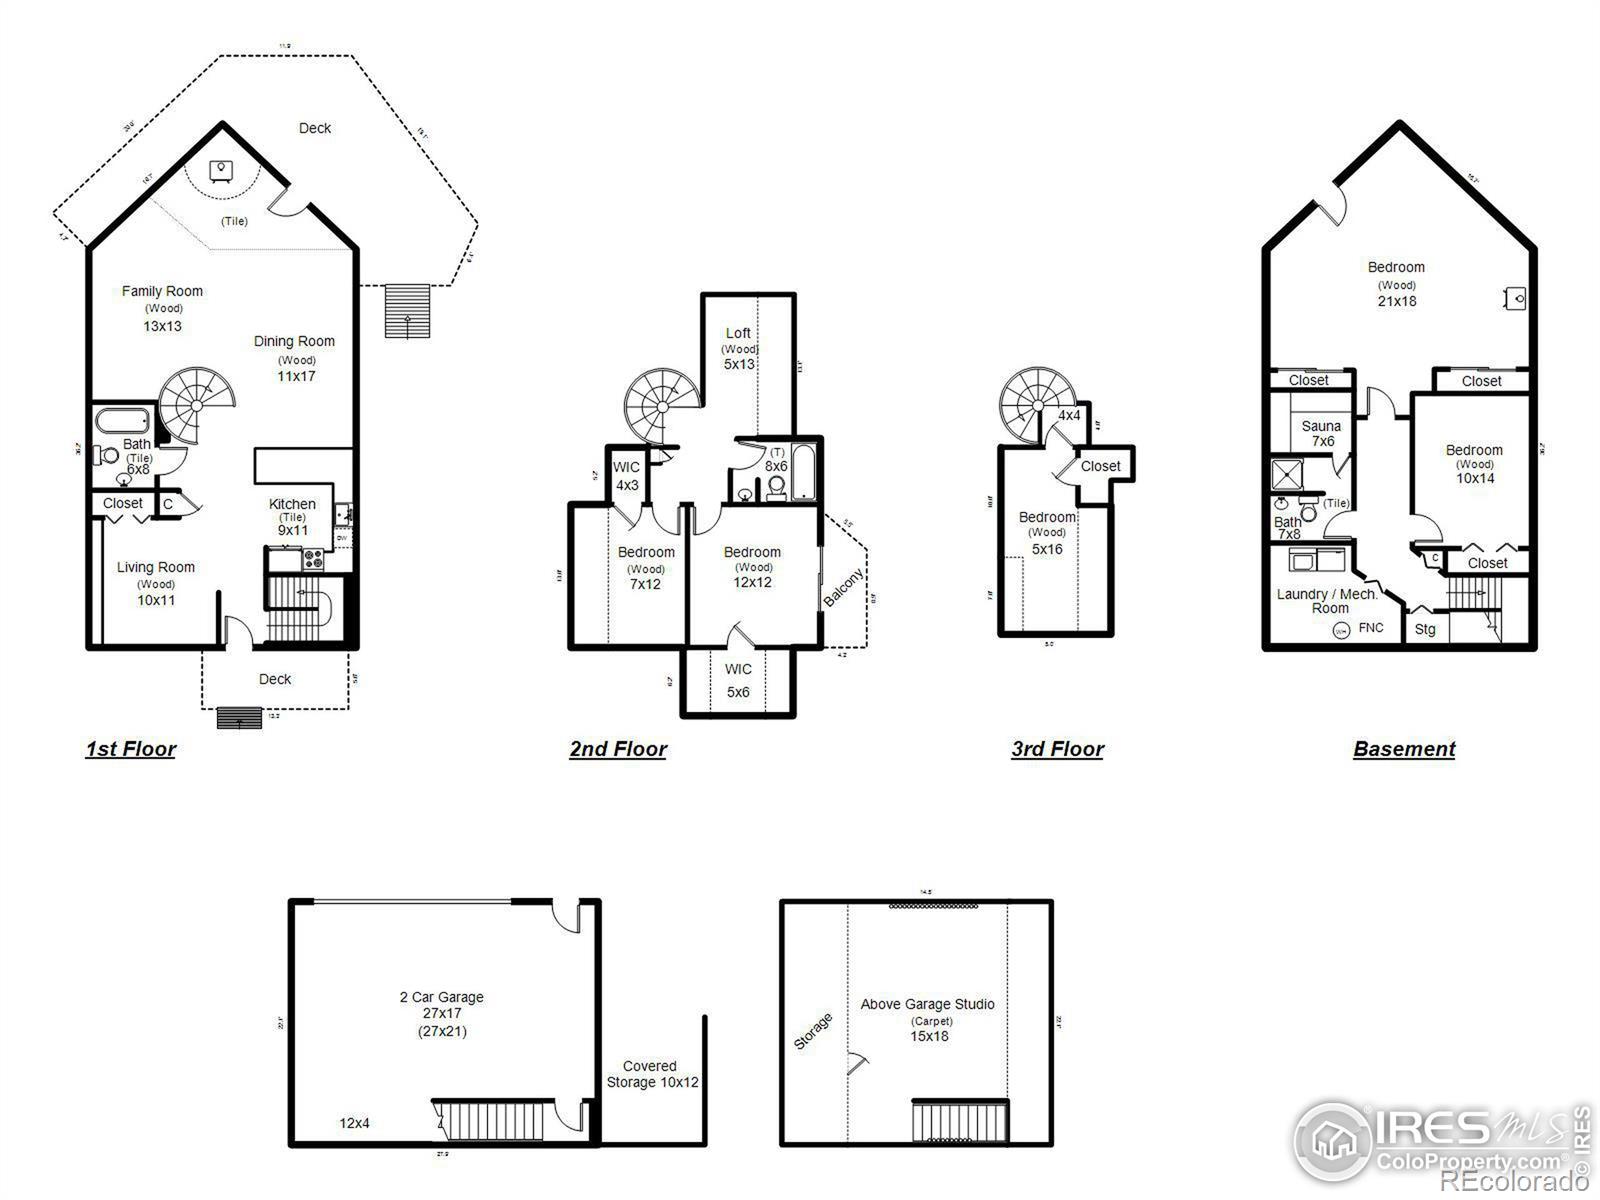
Active
$500,000
4
bds
|
4
ba
|
1,864
sqft
|
built
2003
661 Snowberry St, Longmont, CO 80503
$-991
Cash flow
-10.3%
Cash-on-Cash Return
3.3%
Cap rate
0.6%
Rent to Value Ratio
Active
$999,000
4
bds
|
3
ba
|
2,748
sqft
|
built
1972
208 Wild Tiger Rd, Boulder, CO 80302
$-1,712
Cash flow
-8.9%
Cash-on-Cash Return
3.6%
Cap rate
0.5%
Rent to Value Ratio
Active
$230,000
2
bds
|
2
ba
|
1,043
sqft
|
built
1983
50 19th Ave, Longmont, CO 80501
$-308
Cash flow
-7.0%
Cash-on-Cash Return
4.1%
Cap rate
0.8%
Rent to Value Ratio
Active
$615,000
4
bds
|
3
ba
|
2,400
sqft
|
built
1982
2325 15th Ave, Longmont, CO 80503
$-1,052
Cash flow
-8.9%
Cash-on-Cash Return
3.6%
Cap rate
0.5%
Rent to Value Ratio
Active
$679,900
5
bds
|
4
ba
|
2,376
sqft
|
built
2000
529 Olympia Ave, Longmont, CO 80504
$-1,522
Cash flow
-11.7%
Cash-on-Cash Return
3.0%
Cap rate
0.4%
Rent to Value Ratio
Active under contract
$1,095,000
3
bds
|
4
ba
|
2,452
sqft
|
built
1989
5978 Scotswood Ct, Boulder, CO 80301
$-3,271
Cash flow
-15.6%
Cash-on-Cash Return
2.1%
Cap rate
0.3%
Rent to Value Ratio
Active
$4,345,000
4
bds
|
6
ba
|
6,098
sqft
|
built
1987
8758 W Phillips Rd, Boulder, CO 80301
$-14,400
Cash flow
-17.3%
Cash-on-Cash Return
1.7%
Cap rate
0.2%
Rent to Value Ratio
Active
$1,495,000
3
bds
|
3
ba
|
3,970
sqft
|
built
1982
3900 Bogey Ct, Longmont, CO 80503
$-4,856
Cash flow
-16.9%
Cash-on-Cash Return
1.8%
Cap rate
0.3%
Rent to Value Ratio
Active
$1,160,000
3
bds
|
2
ba
|
1,480
sqft
|
built
1957
1950 Glenwood Dr, Boulder, CO 80304
$-3,166
Cash flow
-14.2%
Cash-on-Cash Return
2.4%
Cap rate
0.4%
Rent to Value Ratio
Active
$976,000
3
bds
|
1
ba
|
1,028
sqft
|
built
1969
3545 Cloverleaf Dr, Boulder, CO 80304
$-2,622
Cash flow
-14.0%
Cash-on-Cash Return
2.5%
Cap rate
0.4%
Rent to Value Ratio
Active under contract
$445,000
3
bds
|
1
ba
|
1,375
sqft
|
built
1972
717 E 4th Ave, Longmont, CO 80504
$-698
Cash flow
-8.2%
Cash-on-Cash Return
3.8%
Cap rate
0.5%
Rent to Value Ratio
Active
$596,500
2
bds
|
3
ba
|
1,150
sqft
|
built
2002
985 Laramie Blvd, Boulder, CO 80304
$-1,490
Cash flow
-13.0%
Cash-on-Cash Return
2.7%
Cap rate
0.5%
Rent to Value Ratio
Active
$419,900
3
bds
|
2
ba
|
1,080
sqft
|
built
1985
718 Julian Cir, Lafayette, CO 80026
$-1,035
Cash flow
-12.9%
Cash-on-Cash Return
2.7%
Cap rate
0.5%
Rent to Value Ratio
Active
$2,690,000
4
bds
|
5
ba
|
6,690
sqft
|
built
2001
385 Baxter Farm Ln, Erie, CO 80516
$-7,736
Cash flow
-15.0%
Cash-on-Cash Return
2.2%
Cap rate
0.3%
Rent to Value Ratio
Active
$725,000
4
bds
|
2
ba
|
2,120
sqft
|
built
1978
1504 Washington Ave, Louisville, CO 80027
$-1,793
Cash flow
-12.9%
Cash-on-Cash Return
2.7%
Cap rate
0.4%
Rent to Value Ratio

Active
$590,000
3
bds
|
3
ba
|
1,543
sqft
|
built
2004
258 Casper Dr, Lafayette, CO 80026
$-1,707
Cash flow
-15.1%
Cash-on-Cash Return
2.2%
Cap rate
0.5%
Rent to Value Ratio
Active
$1,140,000
6
bds
|
5
ba
|
4,356
sqft
|
built
2019
848 Sandstone Cir, Erie, CO 80516
$-3,461
Cash flow
-15.8%
Cash-on-Cash Return
2.0%
Cap rate
0.4%
Rent to Value Ratio
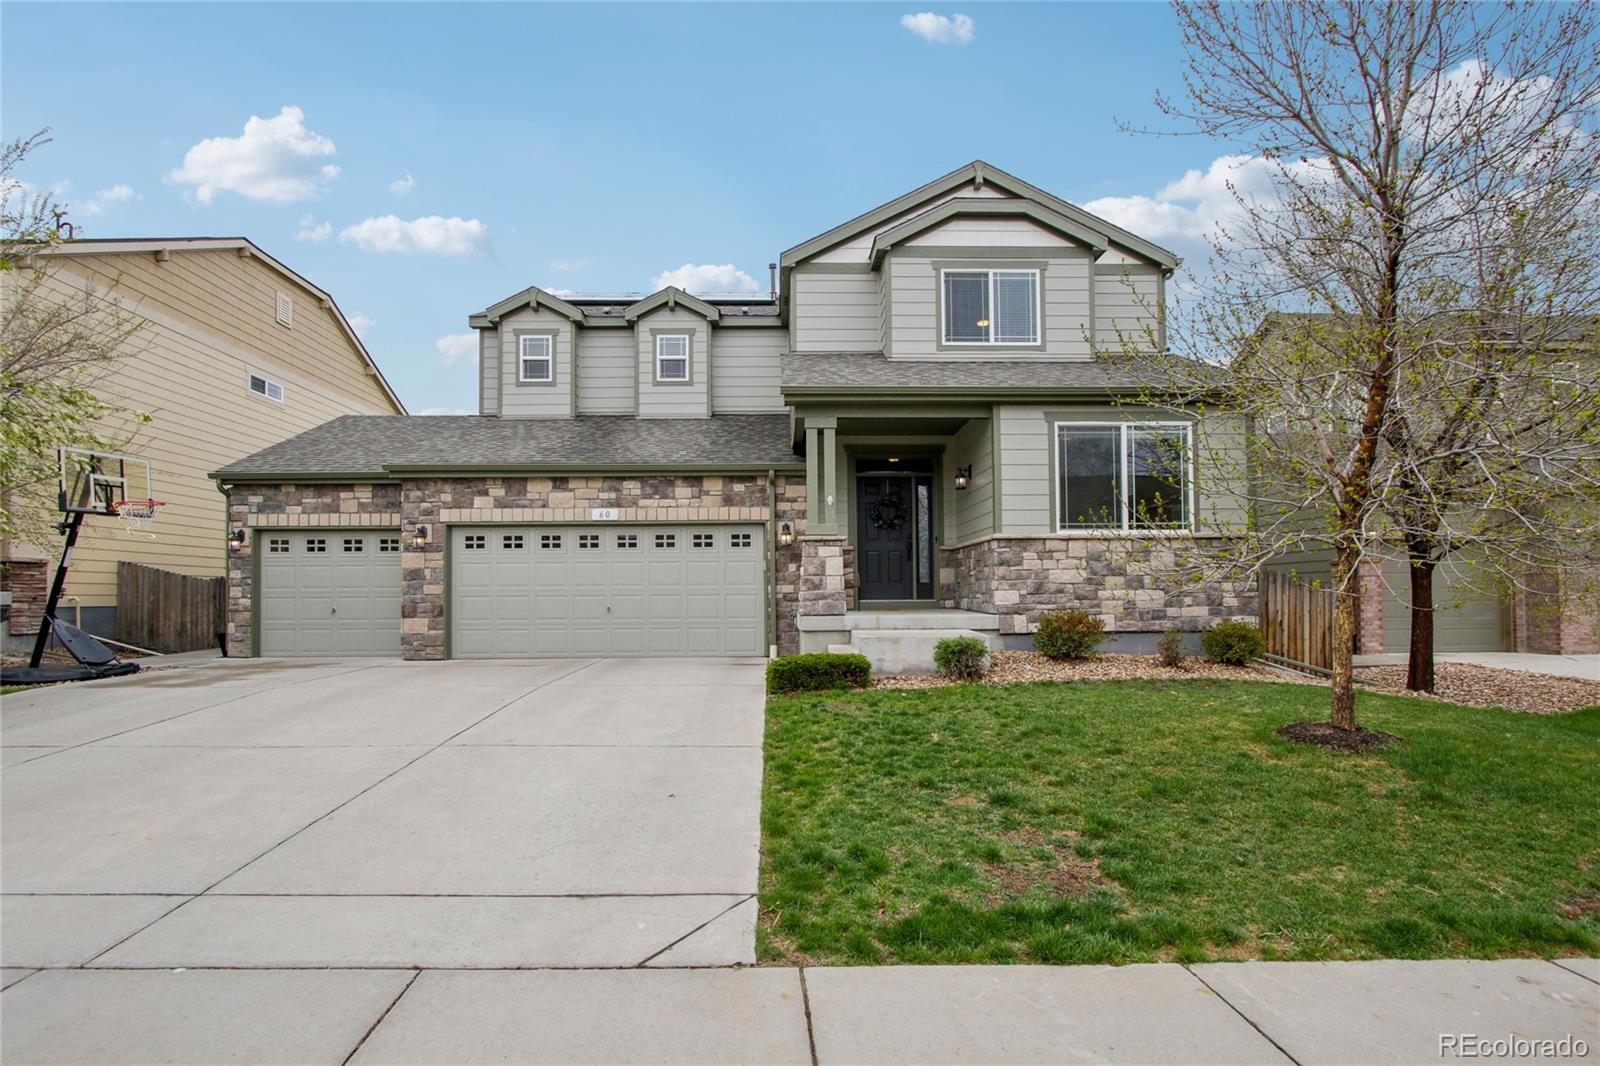
Active
$825,000
6
bds
|
6
ba
|
3,381
sqft
|
built
2015
60 Stewart Way, Erie, CO 80516
$-2,053
Cash flow
-13.0%
Cash-on-Cash Return
2.7%
Cap rate
0.4%
Rent to Value Ratio