Boulder County Investment Properties for Sale
Browse homes for sale and investment properties in Boulder County. Refine your search by price, property type, or more.
Best cash flowing properties in Boulder County

Active
$399,000
2
bds
|
1
ba
|
800
sqft
|
built
1930
2426 Riverside Dr, Lyons, CO 80540
$-368
Cash flow
-4.8%
Cash-on-Cash Return
4.6%
Cap rate
0.6%
Rent to Value Ratio
Active
$450,000
4
bds
|
2
ba
|
1,540
sqft
|
built
1900
2010 9th Ave, Longmont, CO 80501
$-612
Cash flow
-7.1%
Cash-on-Cash Return
4.0%
Cap rate
0.5%
Rent to Value Ratio
964 out of 1,054 properties for sale in Boulder County
Limited Results Shown
Create a free account, or log in to reveal all property listings and enjoy the complete experience.

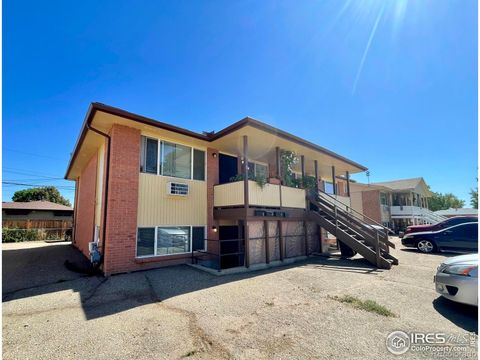
Active
$325,000
1
bds
|
1
ba
|
400
sqft
|
built
1983
2711 Mapleton Ave, Boulder, CO 80304
$-968
Cash flow
-15.5%
Cash-on-Cash Return
2.1%
Cap rate
0.5%
Rent to Value Ratio

Active
$335,000
1
bds
|
1
ba
|
400
sqft
|
built
1983
2711 Mapleton Ave, Boulder, CO 80304
$-877
Cash flow
-13.7%
Cash-on-Cash Return
2.5%
Cap rate
0.5%
Rent to Value Ratio

Active
$1,625,000
5
bds
|
3
ba
|
2,340
sqft
|
built
1908
1519 16th St, Boulder, CO 80302
$-5,198
Cash flow
-16.7%
Cash-on-Cash Return
1.8%
Cap rate
0.3%
Rent to Value Ratio

Active
$600,000
4
bds
|
3
ba
|
2,313
sqft
|
built
1992
1448 16th Ave, Longmont, CO 80501
$-1,137
Cash flow
-9.9%
Cash-on-Cash Return
3.4%
Cap rate
0.5%
Rent to Value Ratio
Active
$1,475,000
4
bds
|
3
ba
|
4,948
sqft
|
built
1989
6668 Fairways Dr, Longmont, CO 80503
$-4,694
Cash flow
-16.6%
Cash-on-Cash Return
1.9%
Cap rate
0.3%
Rent to Value Ratio

Active
$3,700,000
4
bds
|
5
ba
|
7,484
sqft
|
built
1993
1189 Rembrandt Rd, Boulder, CO 80302
$-11,946
Cash flow
-16.8%
Cash-on-Cash Return
1.8%
Cap rate
0.3%
Rent to Value Ratio

Active
$1,050,000
3
bds
|
3
ba
|
2,560
sqft
|
built
1994
187 Rocky Knob Ln, Nederland, CO 80466
$-2,338
Cash flow
-11.6%
Cash-on-Cash Return
3.0%
Cap rate
0.4%
Rent to Value Ratio
Active
$22,500,000
5
bds
|
10
ba
|
13,284
sqft
|
built
2004
7484 N 49th St, Longmont, CO 80503
$-106,918
Cash flow
-24.8%
Cash-on-Cash Return
0.0%
Cap rate
0.0%
Rent to Value Ratio

Active
$1,640,000
3
bds
|
4
ba
|
3,155
sqft
|
built
2000
15 Arrowleaf Ct, Boulder, CO 80304
$-4,187
Cash flow
-13.3%
Cash-on-Cash Return
2.6%
Cap rate
0.4%
Rent to Value Ratio
Active
$839,900
4
bds
|
4
ba
|
2,802
sqft
|
built
2020
970 Compass Dr, Erie, CO 80516
$-1,993
Cash flow
-12.4%
Cash-on-Cash Return
2.8%
Cap rate
0.5%
Rent to Value Ratio
Active
$3,950,000
2
bds
|
3
ba
|
2,768
sqft
|
built
2005
1360 Walnut St, Boulder, CO 80302
$-17,437
Cash flow
-23.0%
Cash-on-Cash Return
0.4%
Cap rate
0.2%
Rent to Value Ratio

Active
$1,285,000
4
bds
|
3
ba
|
1,930
sqft
|
built
1940
3360 Broadway St, Boulder, CO 80304
$-3,390
Cash flow
-13.8%
Cash-on-Cash Return
2.5%
Cap rate
0.4%
Rent to Value Ratio
Active
$1,620,000
3
bds
|
3
ba
|
2,652
sqft
|
built
1967
2208 Champlain Dr, Boulder, CO 80301
$-5,604
Cash flow
-18.0%
Cash-on-Cash Return
1.5%
Cap rate
0.2%
Rent to Value Ratio
Active
$799,990
3
bds
|
4
ba
|
2,051
sqft
|
built
2021
352 Superior Dr, Superior, CO 80027
$-2,310
Cash flow
-15.1%
Cash-on-Cash Return
2.2%
Cap rate
0.4%
Rent to Value Ratio

Active
$1,019,000
3
bds
|
1
ba
|
927
sqft
|
built
1958
6903 Valmont Rd, Boulder, CO 80301
$-3,020
Cash flow
-15.5%
Cash-on-Cash Return
2.1%
Cap rate
0.3%
Rent to Value Ratio
Active
$3,695,000
4
bds
|
3
ba
|
2,924
sqft
|
built
1920
5196 Oxford Rd, Longmont, CO 80503
$-14,067
Cash flow
-19.9%
Cash-on-Cash Return
1.1%
Cap rate
0.2%
Rent to Value Ratio
Active
$2,250,000
5
bds
|
4
ba
|
3,186
sqft
|
built
1974
3970 Longwood Ave, Boulder, CO 80305
$-6,738
Cash flow
-15.6%
Cash-on-Cash Return
2.1%
Cap rate
0.3%
Rent to Value Ratio
Active
$620,000
4
bds
|
3
ba
|
2,325
sqft
|
built
1992
2912 Lake Park Way, Longmont, CO 80503
$-1,177
Cash flow
-9.9%
Cash-on-Cash Return
3.4%
Cap rate
0.5%
Rent to Value Ratio

Active
$2,999,000
5
bds
|
4
ba
|
4,625
sqft
|
built
1966
2857 Linden Dr, Boulder, CO 80304
$-8,776
Cash flow
-15.3%
Cash-on-Cash Return
2.2%
Cap rate
0.3%
Rent to Value Ratio
Active
$749,000
2
bds
|
3
ba
|
1,536
sqft
|
built
1957
2420 Big Owl Rd, Allenspark, CO 80510
$-1,497
Cash flow
-10.4%
Cash-on-Cash Return
3.3%
Cap rate
0.4%
Rent to Value Ratio
Active
$700,000
2
bds
|
2
ba
|
1,476
sqft
|
built
1997
3860 Colorado Ave, Boulder, CO 80303
$-1,917
Cash flow
-14.3%
Cash-on-Cash Return
2.4%
Cap rate
0.4%
Rent to Value Ratio

Active
$765,000
2
bds
|
2
ba
|
2,126
sqft
|
built
1994
548 Coughlin Meadows Rd, Boulder, CO 80302
$-1,469
Cash flow
-10.0%
Cash-on-Cash Return
3.4%
Cap rate
0.5%
Rent to Value Ratio
Active
$875,000
4
bds
|
2
ba
|
2,228
sqft
|
built
1965
8840 Niwot Rd, Niwot, CO 80503
$-2,298
Cash flow
-13.7%
Cash-on-Cash Return
2.5%
Cap rate
0.4%
Rent to Value Ratio
Active
$728,000
3
bds
|
3
ba
|
1,654
sqft
|
built
1994
1842 Reliance Cir, Superior, CO 80027
$-1,615
Cash flow
-11.6%
Cash-on-Cash Return
3.0%
Cap rate
0.4%
Rent to Value Ratio
Active
$469,000
3
bds
|
2
ba
|
1,238
sqft
|
built
1984
494 Owl Dr, Louisville, CO 80027
$-1,202
Cash flow
-13.4%
Cash-on-Cash Return
2.6%
Cap rate
0.5%
Rent to Value Ratio

Active
$774,900
5
bds
|
4
ba
|
2,766
sqft
|
built
2000
1369 Padfield Pl, Erie, CO 80516
$-1,743
Cash flow
-11.7%
Cash-on-Cash Return
3.0%
Cap rate
0.5%
Rent to Value Ratio
Active
$1,385,000
3
bds
|
5
ba
|
4,732
sqft
|
built
2004
1055 Divide View Dr, Golden, CO 80403
$-2,873
Cash flow
-10.8%
Cash-on-Cash Return
3.2%
Cap rate
0.4%
Rent to Value Ratio

Active
$1,148,000
4
bds
|
4
ba
|
4,081
sqft
|
built
1998
2275 Schooner St, Lafayette, CO 80026
$-3,015
Cash flow
-13.7%
Cash-on-Cash Return
2.5%
Cap rate
0.4%
Rent to Value Ratio
Active
$825,000
4
bds
|
0
ba
|
0
sqft
|
built
1969
832 S Bowen St, Longmont, CO 80501
$-2,941
Cash flow
-18.6%
Cash-on-Cash Return
1.4%
Cap rate
0.2%
Rent to Value Ratio

Active
$650,000
2
bds
|
2
ba
|
1,687
sqft
|
built
1981
4475 Laguna Pl, Boulder, CO 80303
$-2,224
Cash flow
-17.9%
Cash-on-Cash Return
1.6%
Cap rate
0.4%
Rent to Value Ratio
Active
$1,250,000
4
bds
|
3
ba
|
2,635
sqft
|
built
1991
5665 Cascade Pl, Boulder, CO 80303
$-3,818
Cash flow
-15.9%
Cash-on-Cash Return
2.0%
Cap rate
0.3%
Rent to Value Ratio
Active
$649,000
3
bds
|
2
ba
|
2,184
sqft
|
built
2005
221 Homestead Pkwy, Longmont, CO 80504
$-1,401
Cash flow
-11.3%
Cash-on-Cash Return
3.1%
Cap rate
0.4%
Rent to Value Ratio
Active
$9,750,000
6
bds
|
6
ba
|
6,610
sqft
|
built
2022
2100 Kohler Dr, Boulder, CO 80305
$-43,081
Cash flow
-23.1%
Cash-on-Cash Return
0.4%
Cap rate
0.1%
Rent to Value Ratio
Active
$615,000
3
bds
|
3
ba
|
1,876
sqft
|
built
2006
2104 18th Ave, Longmont, CO 80501
$-1,344
Cash flow
-11.4%
Cash-on-Cash Return
3.1%
Cap rate
0.5%
Rent to Value Ratio

Active
$1,050,000
4
bds
|
3
ba
|
2,858
sqft
|
built
2017
759 Old Wagon Trail Cir, Lafayette, CO 80026
$-2,806
Cash flow
-13.9%
Cash-on-Cash Return
2.5%
Cap rate
0.4%
Rent to Value Ratio
Active
$619,999
3
bds
|
4
ba
|
2,388
sqft
|
built
1992
2935 Bow Line Pl, Longmont, CO 80503
$-1,320
Cash flow
-11.1%
Cash-on-Cash Return
3.1%
Cap rate
0.5%
Rent to Value Ratio
Active
$392,900
2
bds
|
3
ba
|
1,460
sqft
|
built
2018
1456 Sepia Ave, Longmont, CO 80501
$-677
Cash flow
-9.0%
Cash-on-Cash Return
3.6%
Cap rate
0.6%
Rent to Value Ratio

Active
$1,575,000
3
bds
|
3
ba
|
2,713
sqft
|
built
2014
1133 Arroyo Chico, Boulder, CO 80302
$-3,271
Cash flow
-10.8%
Cash-on-Cash Return
3.2%
Cap rate
0.5%
Rent to Value Ratio