Boulder County Investment Properties for Sale
Browse homes for sale and investment properties in Boulder County. Refine your search by price, property type, or more.
Best cash flowing properties in Boulder County
Active
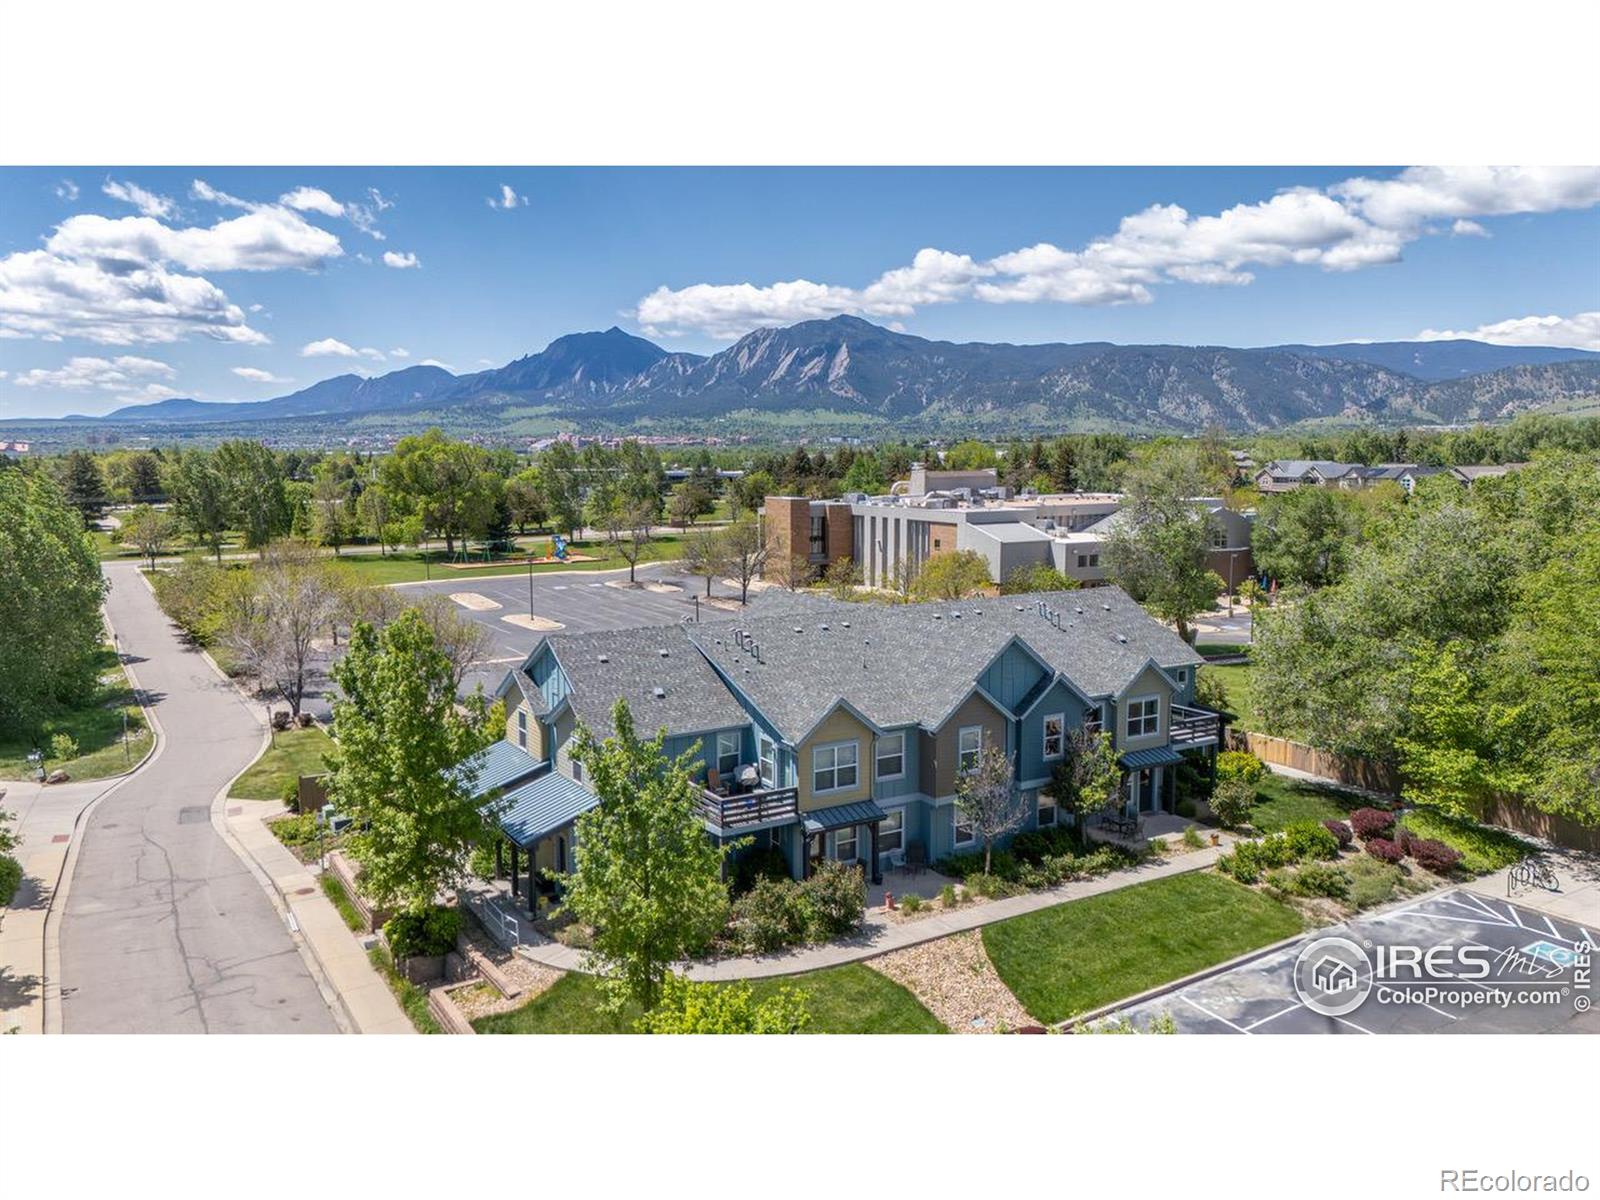
$229,397
2
bds
|
2
ba
|
1,069
sqft
|
built
2009
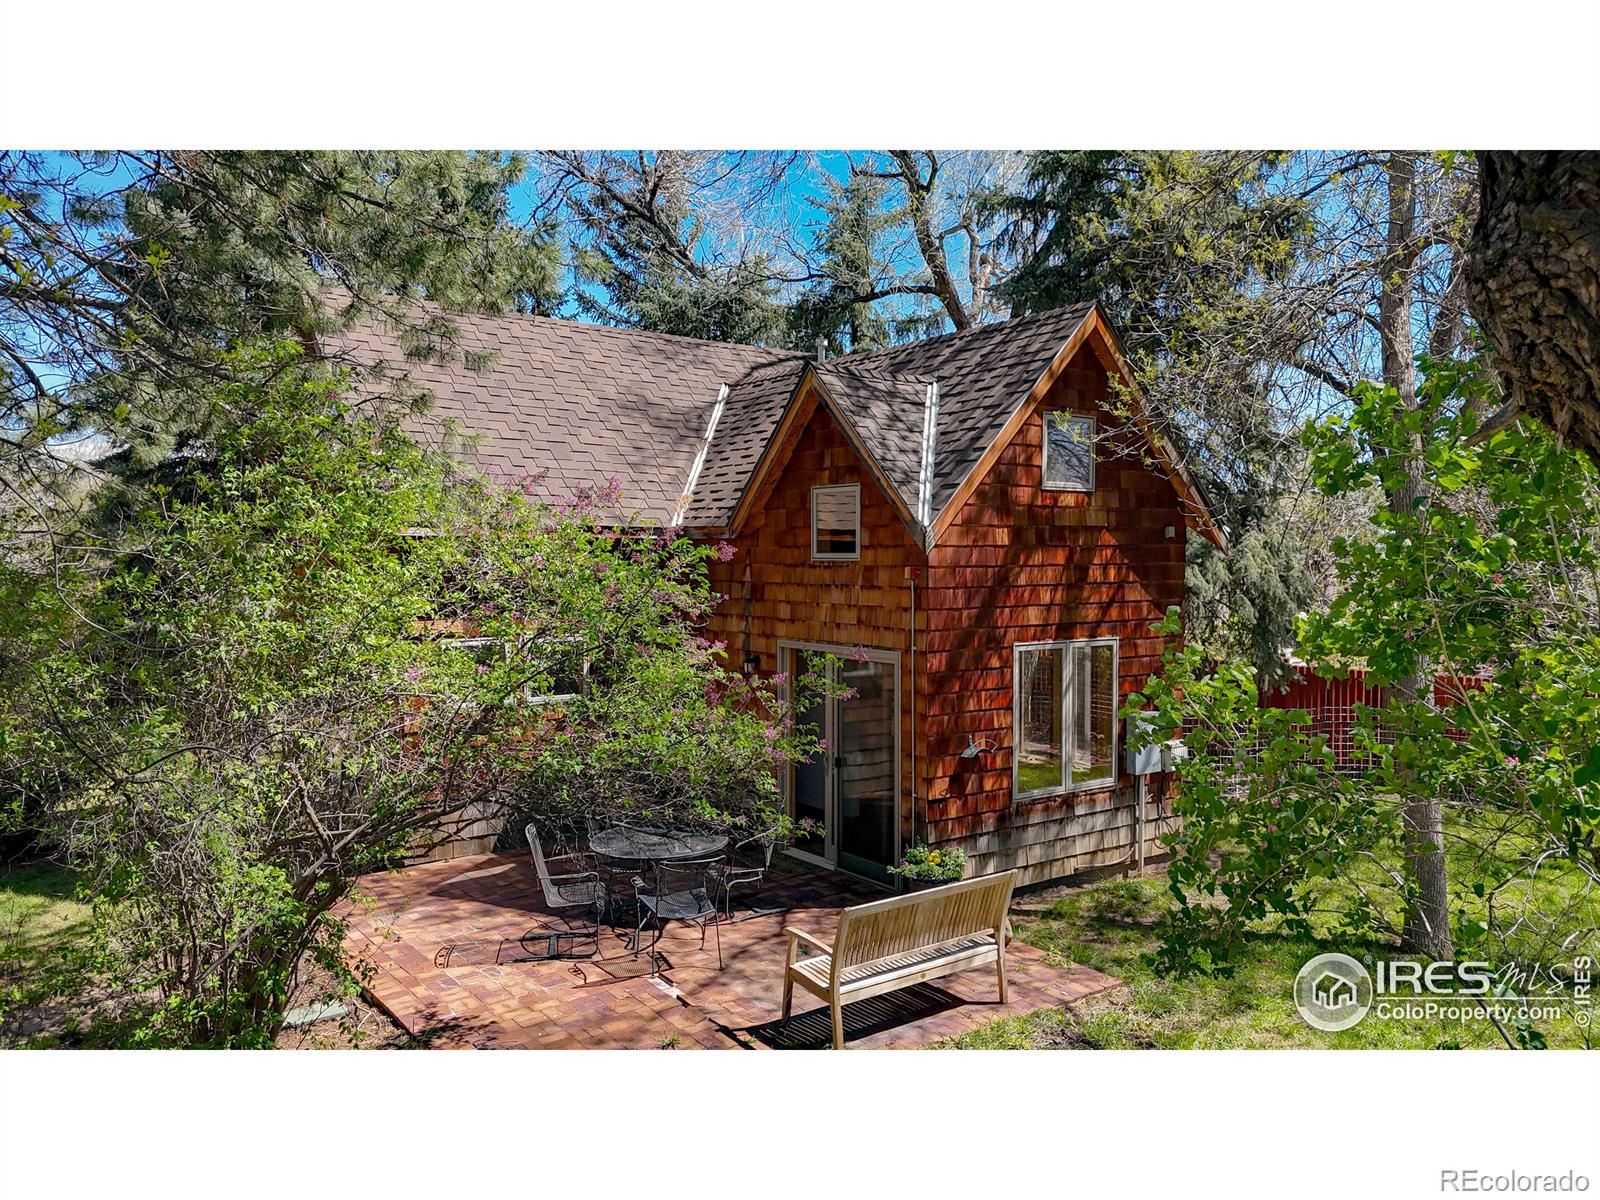
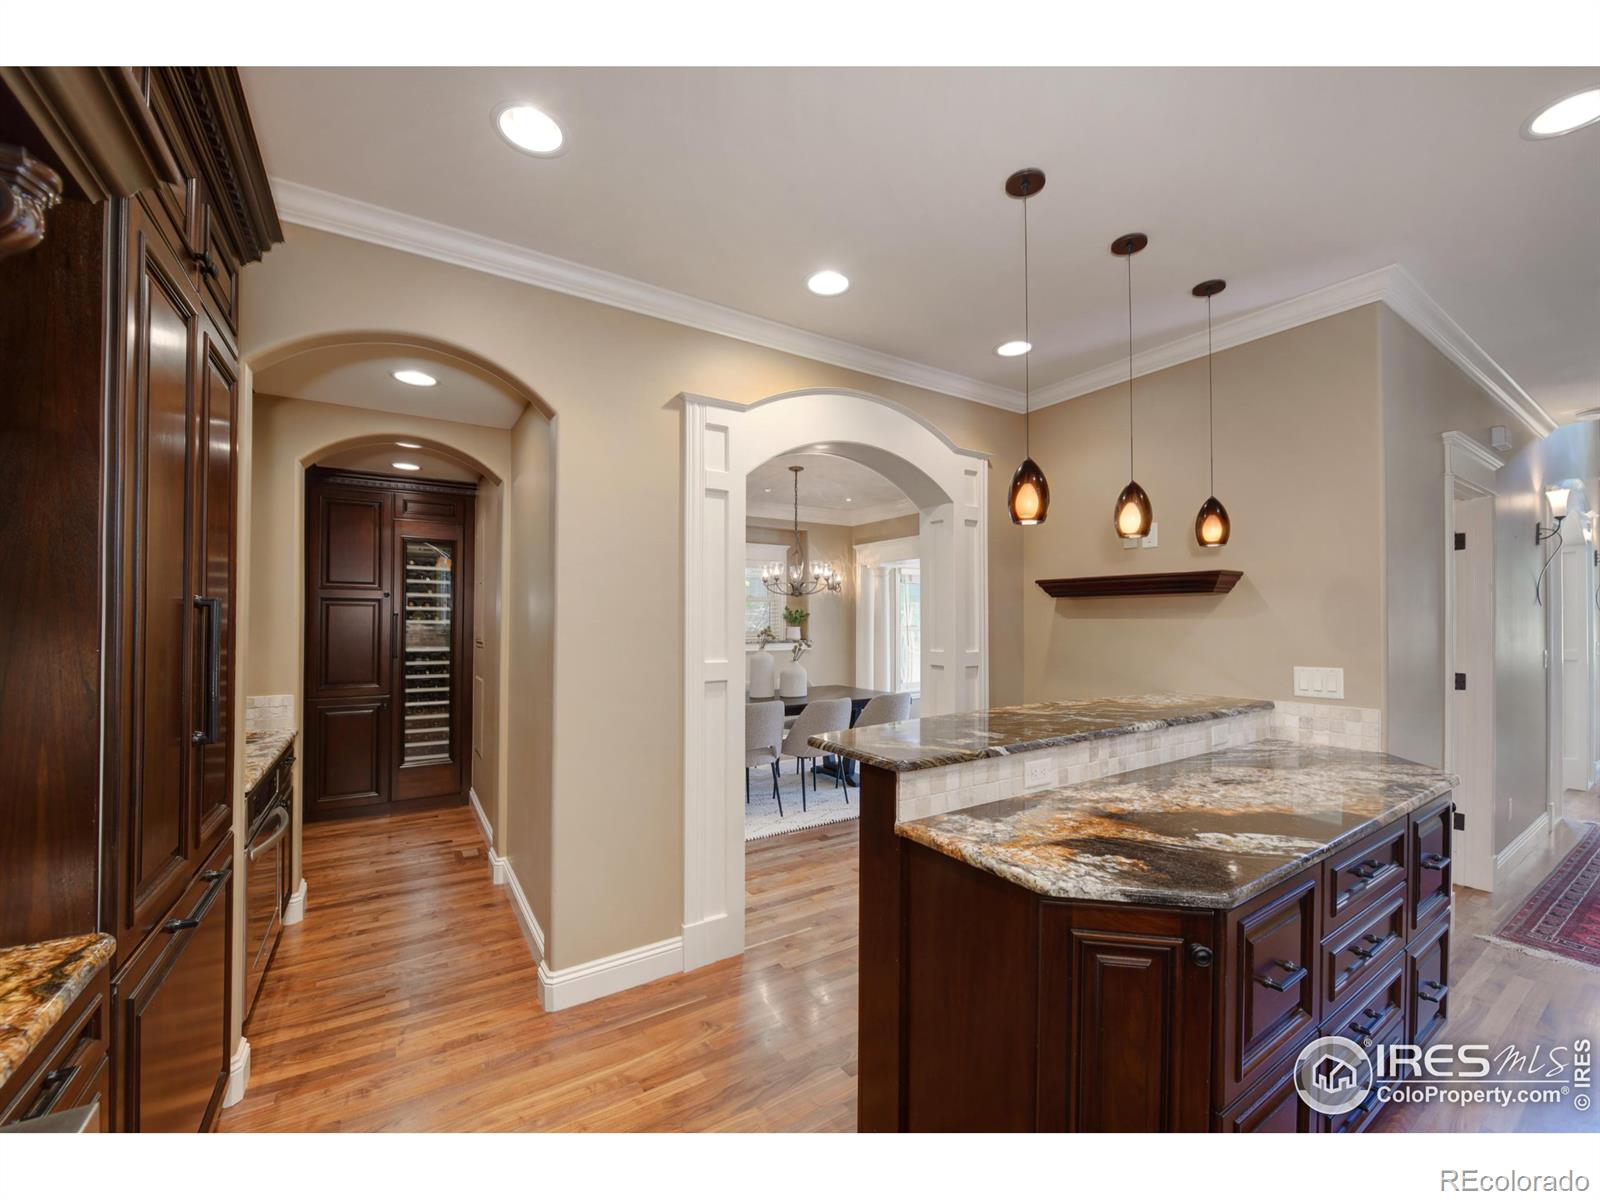
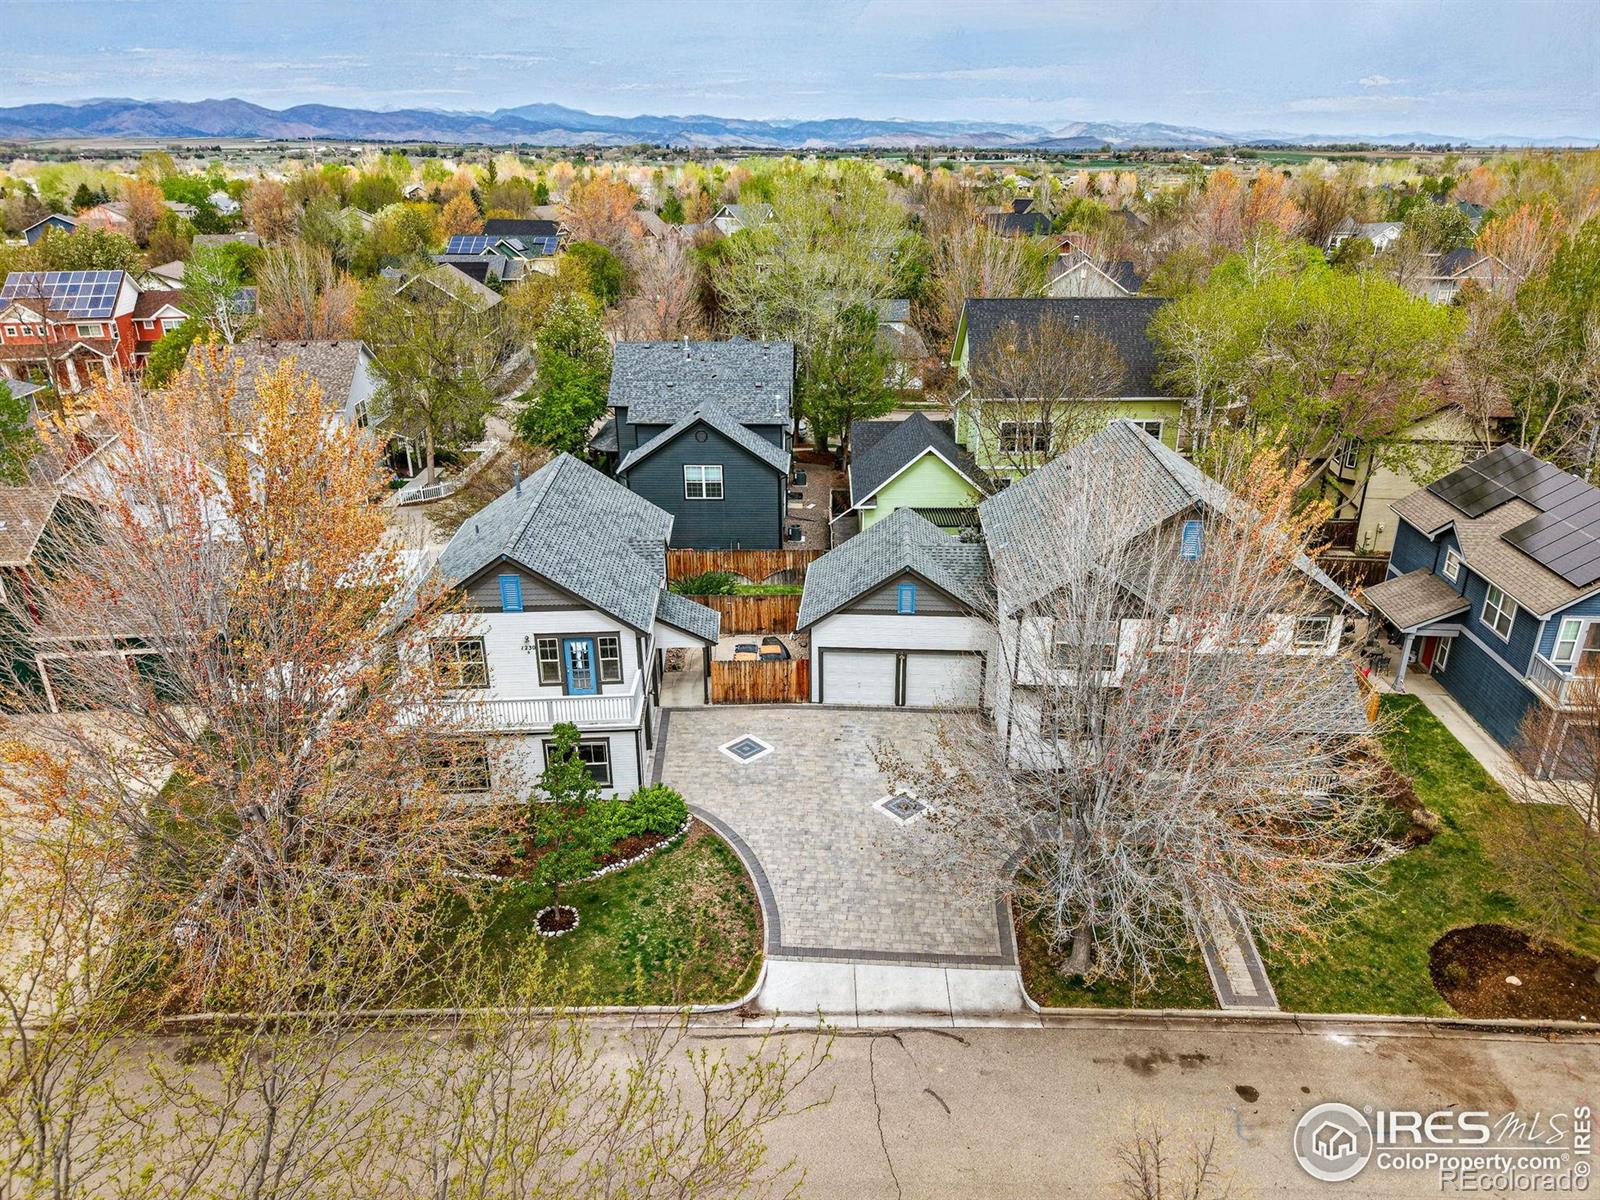
3671 Pinedale St, Boulder, CO 80301
$-484
Cash flow
-11.0%
Cash-on-Cash Return
3.8%
Cap rate
0.8%
Rent to Value Ratio
Active
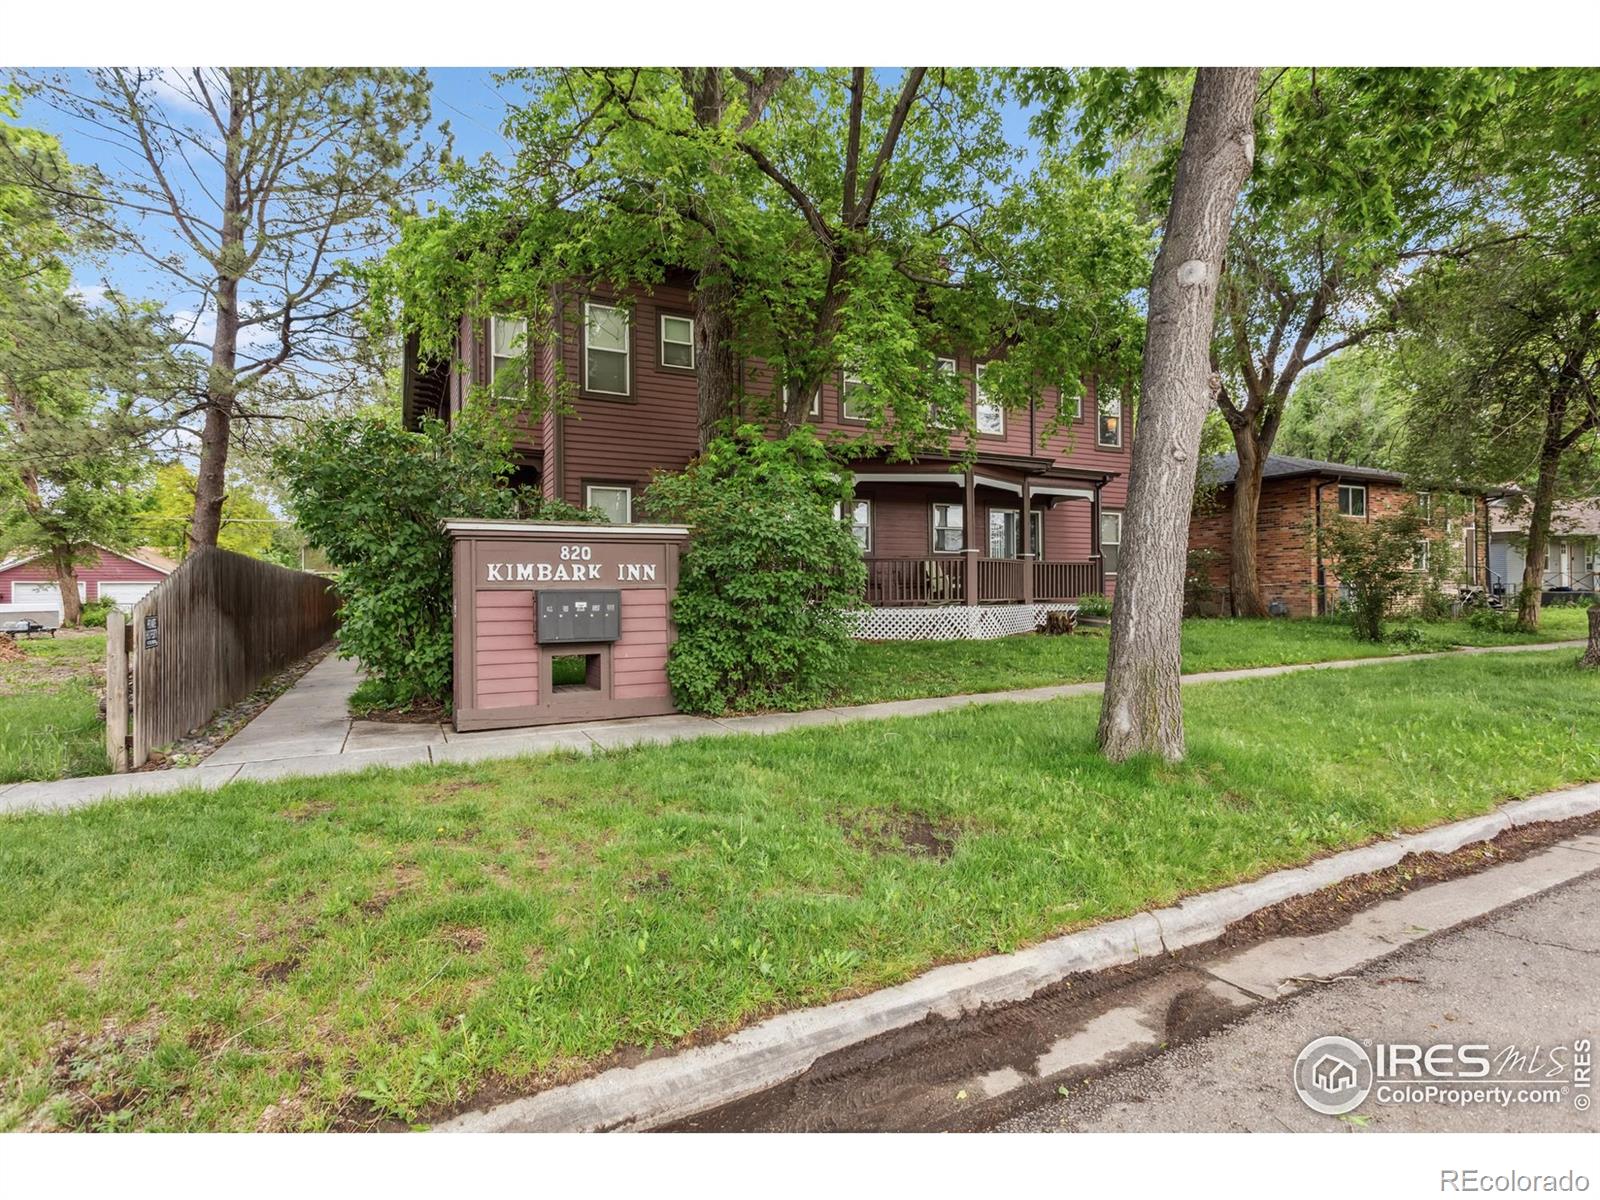
$379,900
2
bds
|
2
ba
|
1,282
sqft
|
built
1999
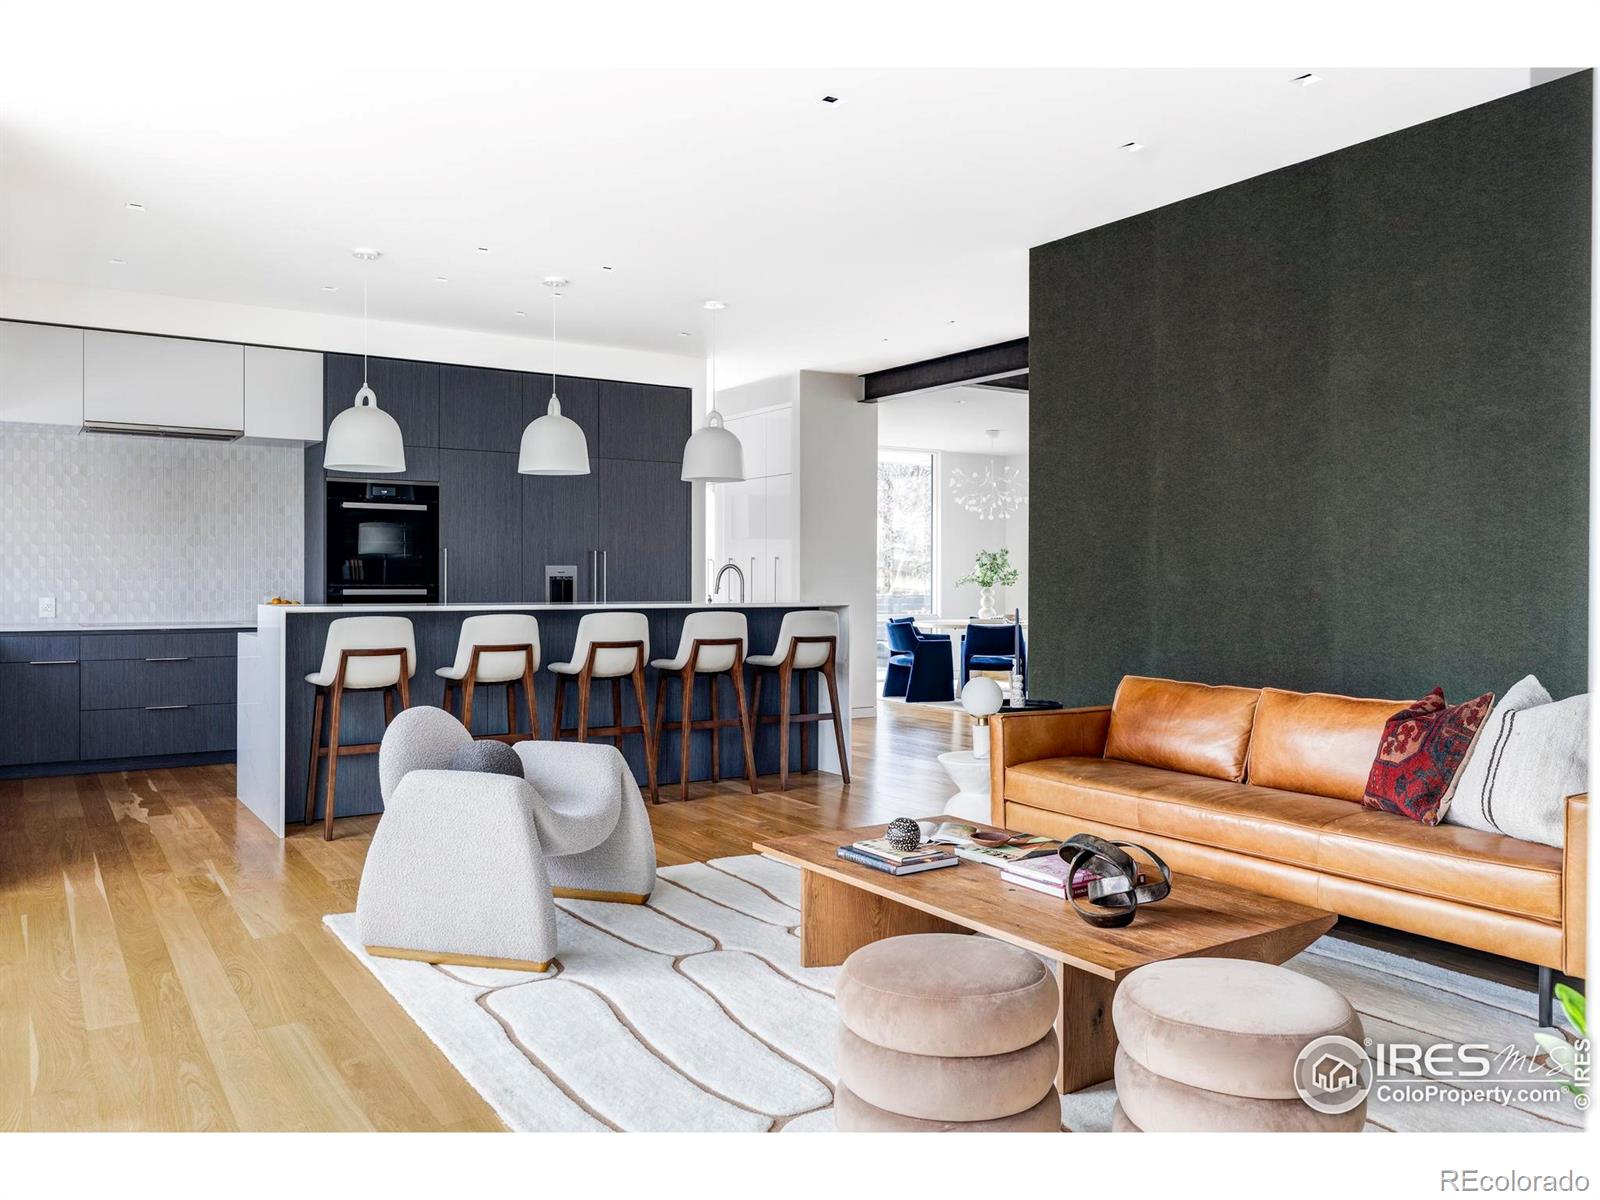
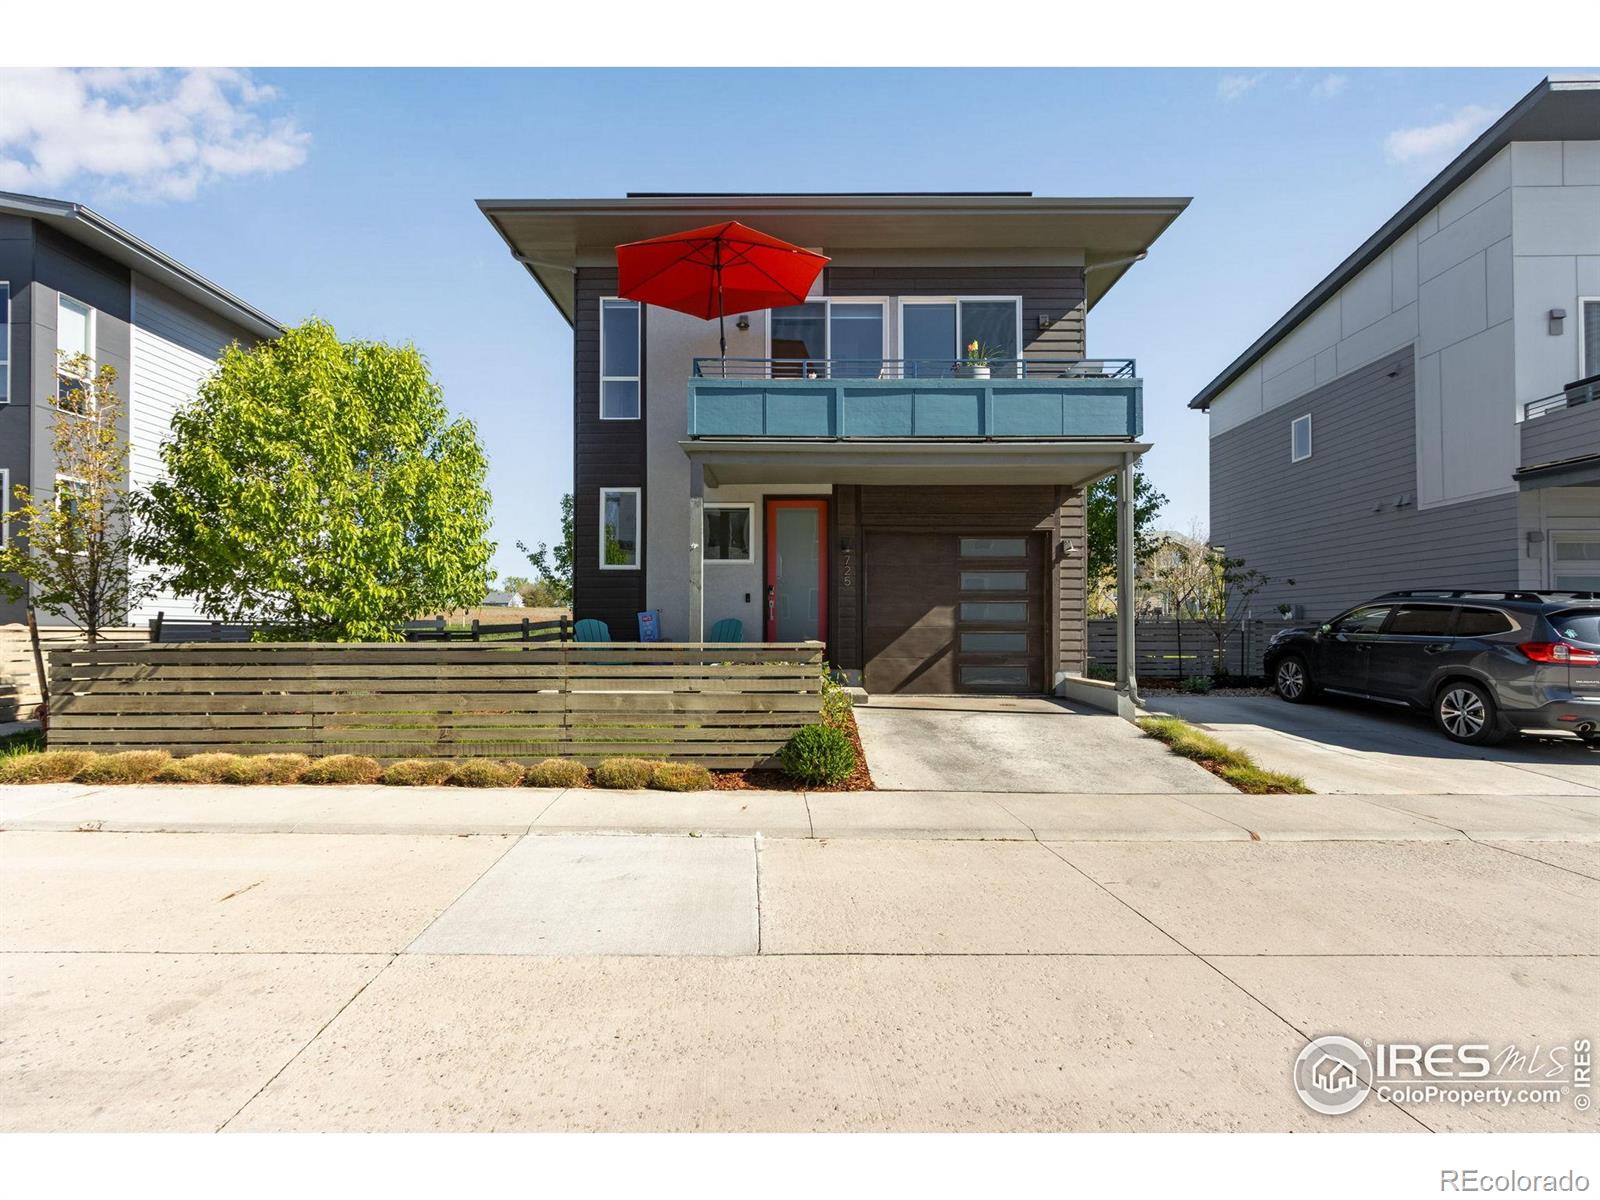
820 Kimbark St, Longmont, CO 80501
$-853
Cash flow
-11.7%
Cash-on-Cash Return
3.6%
Cap rate
0.6%
Rent to Value Ratio
1,218 out of 1,361 properties for sale in Boulder County
Limited Results Shown
Create a free account, or log in to reveal all property listings and enjoy the complete experience.
Active
$4,500,000
5
bds
|
3
ba
|
3,654
sqft
|
built
1976
630 Northstar Ct, Boulder, CO 80304
$-21,754
Cash flow
-25.2%
Cash-on-Cash Return
0.5%
Cap rate
0.1%
Rent to Value Ratio
Active
$725,000
5
bds
|
3
ba
|
2,464
sqft
|
built
1977
6396 Twin Lakes Rd, Boulder, CO 80301
$-2,033
Cash flow
-14.6%
Cash-on-Cash Return
2.9%
Cap rate
0.4%
Rent to Value Ratio
Active
$4,495,000
5
bds
|
5
ba
|
6,215
sqft
|
built
2007
3132 5th St, Boulder, CO 80304
$-19,180
Cash flow
-22.3%
Cash-on-Cash Return
1.2%
Cap rate
0.2%
Rent to Value Ratio
Active
$3,180,000
5
bds
|
4
ba
|
5,053
sqft
|
built
1917
851 14th St, Boulder, CO 80302
$-12,996
Cash flow
-21.3%
Cash-on-Cash Return
1.4%
Cap rate
0.2%
Rent to Value Ratio
Active
$874,000
4
bds
|
3
ba
|
2,255
sqft
|
built
1970
7240 Glacier View Rd, Longmont, CO 80503
$-2,759
Cash flow
-16.5%
Cash-on-Cash Return
2.5%
Cap rate
0.4%
Rent to Value Ratio
Active
$599,000
2
bds
|
2
ba
|
1,124
sqft
|
built
2005
4500 Baseline Rd, Boulder, CO 80303
$-2,435
Cash flow
-21.2%
Cash-on-Cash Return
1.4%
Cap rate
0.4%
Rent to Value Ratio
Active
$1,920,000
4
bds
|
3
ba
|
2,930
sqft
|
built
1925
3776 Orange Ln, Boulder, CO 80304
$-6,697
Cash flow
-18.2%
Cash-on-Cash Return
2.1%
Cap rate
0.3%
Rent to Value Ratio
Active
$475,000
1
bds
|
1
ba
|
1,076
sqft
|
built
1981
4475 Laguna Pl, Boulder, CO 80303
$-1,703
Cash flow
-18.7%
Cash-on-Cash Return
2.0%
Cap rate
0.5%
Rent to Value Ratio
Active
$2,070,000
5
bds
|
4
ba
|
4,899
sqft
|
built
1987
2672 Winding Trail Dr, Boulder, CO 80304
$-8,003
Cash flow
-20.2%
Cash-on-Cash Return
1.6%
Cap rate
0.3%
Rent to Value Ratio
Active
$2,950,000
4
bds
|
4
ba
|
4,448
sqft
|
built
1998
910 Kalmia Ave, Boulder, CO 80304
$-13,255
Cash flow
-23.4%
Cash-on-Cash Return
0.9%
Cap rate
0.2%
Rent to Value Ratio
Active
$3,500,000
3
bds
|
4
ba
|
4,066
sqft
|
built
2007
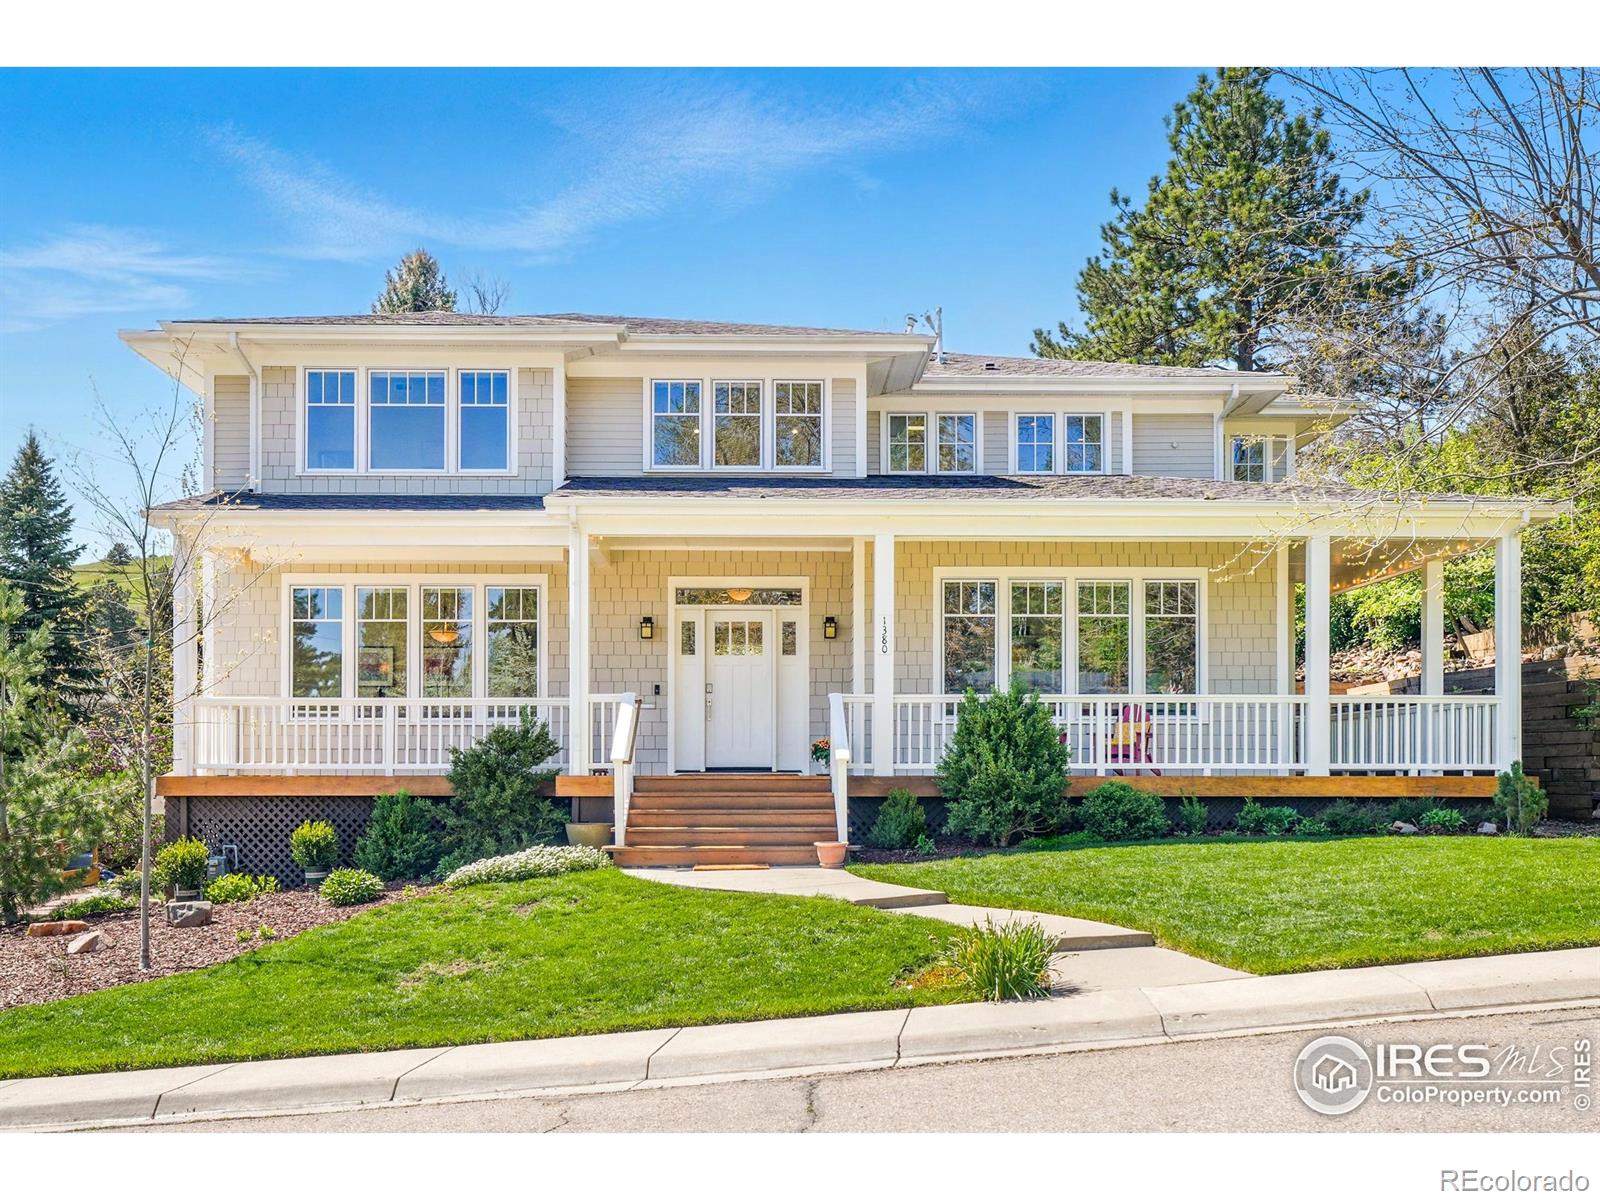
1380 Bluebell Ave, Boulder, CO 80302
$-15,161
Cash flow
-22.6%
Cash-on-Cash Return
1.1%
Cap rate
0.2%
Rent to Value Ratio
Active
$3,250,000
4
bds
|
5
ba
|
5,005
sqft
|
built
1964
245 Fair Pl, Boulder, CO 80302
$-11,105
Cash flow
-17.8%
Cash-on-Cash Return
2.2%
Cap rate
0.3%
Rent to Value Ratio
Active
$629,500
2
bds
|
3
ba
|
1,250
sqft
|
built
2002
1065 Laramie Blvd, Boulder, CO 80304
$-1,531
Cash flow
-12.7%
Cash-on-Cash Return
3.4%
Cap rate
0.5%
Rent to Value Ratio
Active
$2,500,000
5
bds
|
6
ba
|
6,112
sqft
|
built
1993
2835 Links Dr, Boulder, CO 80301
$-7,977
Cash flow
-16.6%
Cash-on-Cash Return
2.5%
Cap rate
0.4%
Rent to Value Ratio
Active
$2,450,000
3
bds
|
5
ba
|
3,064
sqft
|
built
1988
1521 Mapleton Ave, Boulder, CO 80304
$-9,099
Cash flow
-19.4%
Cash-on-Cash Return
1.8%
Cap rate
0.3%
Rent to Value Ratio

Active
$2,700,000
4
bds
|
3
ba
|
3,050
sqft
|
built
1965
1035 Rosehill Dr, Boulder, CO 80302
$-11,083
Cash flow
-21.4%
Cash-on-Cash Return
1.4%
Cap rate
0.2%
Rent to Value Ratio
Active
$5,995,000
5
bds
|
6
ba
|
4,032
sqft
|
built
2020
2670 6th St, Boulder, CO 80304
$-26,262
Cash flow
-22.9%
Cash-on-Cash Return
1.0%
Cap rate
0.2%
Rent to Value Ratio
Active
$229,397
2
bds
|
2
ba
|
1,069
sqft
|
built
2009
3671 Pinedale St, Boulder, CO 80301
$-484
Cash flow
-11.0%
Cash-on-Cash Return
3.8%
Cap rate
0.8%
Rent to Value Ratio
Active
$1,175,000
5
bds
|
2
ba
|
2,072
sqft
|
built
1966
5355 Kewanee Dr, Boulder, CO 80303
$-4,448
Cash flow
-19.8%
Cash-on-Cash Return
1.7%
Cap rate
0.3%
Rent to Value Ratio
Active
$1,495,000
3
bds
|
3
ba
|
2,442
sqft
|
built
1978
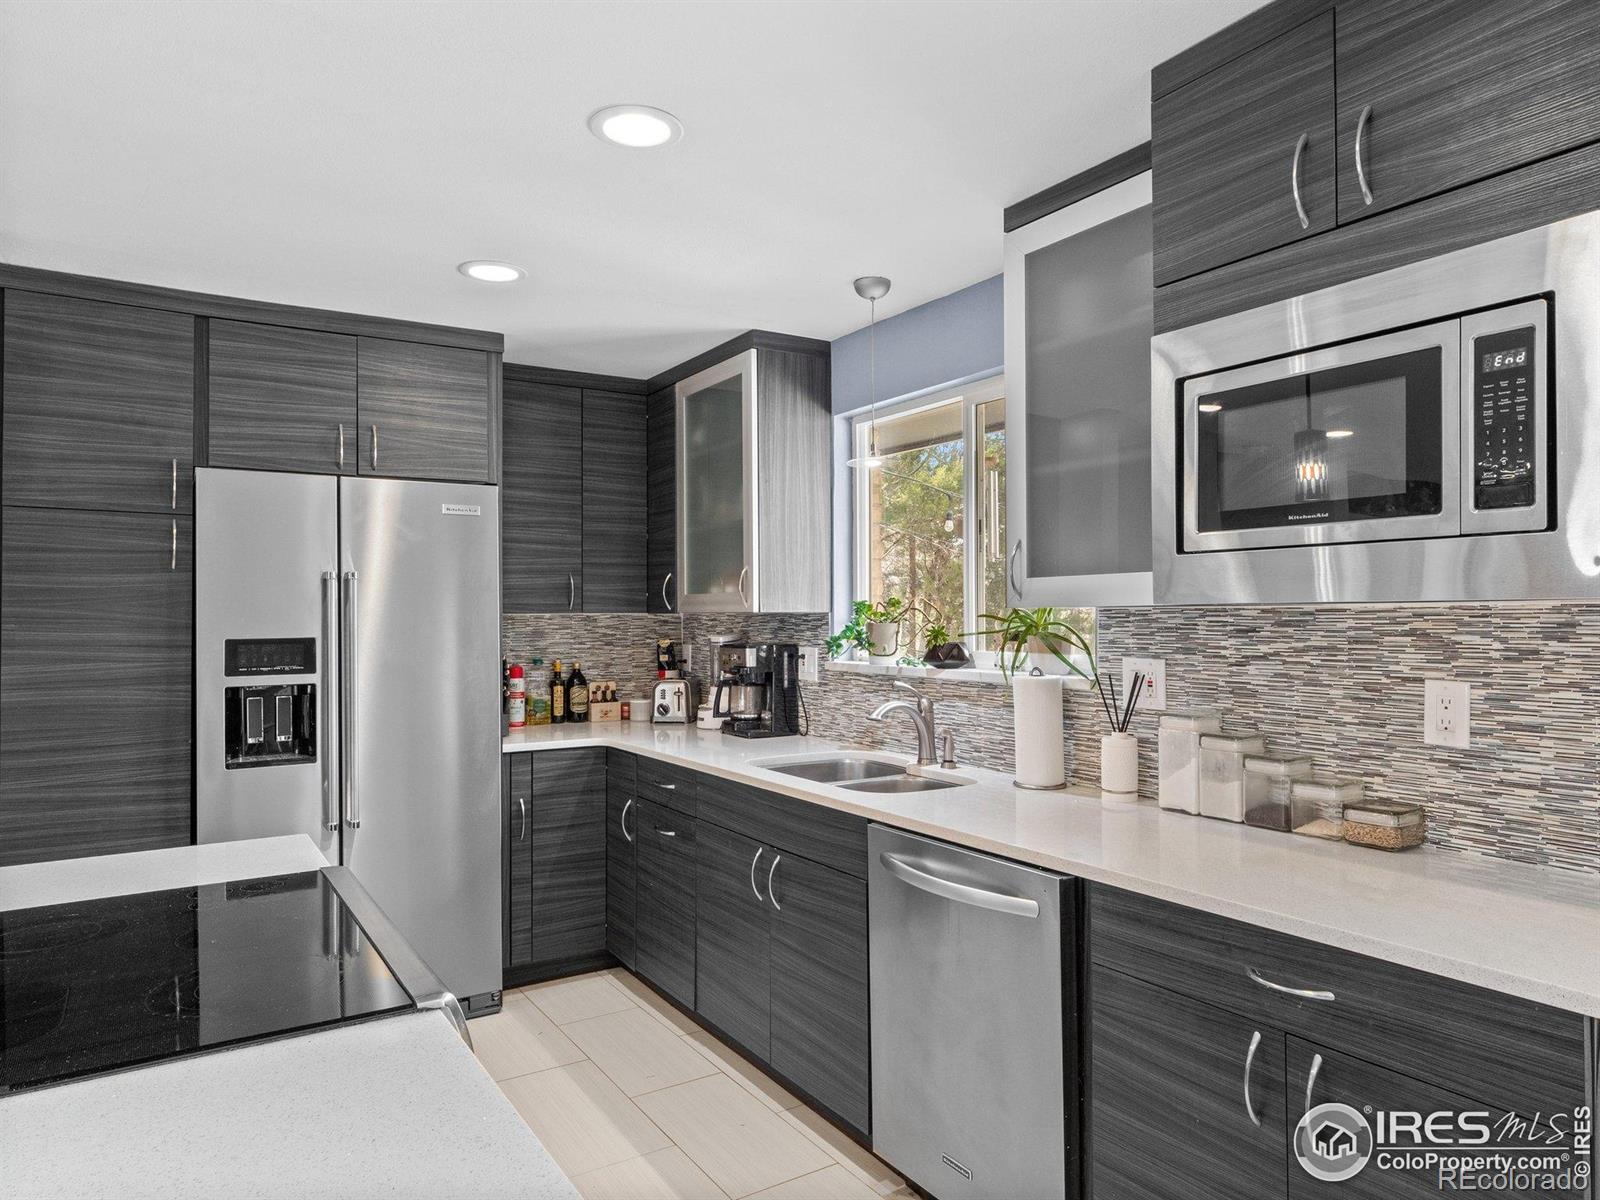
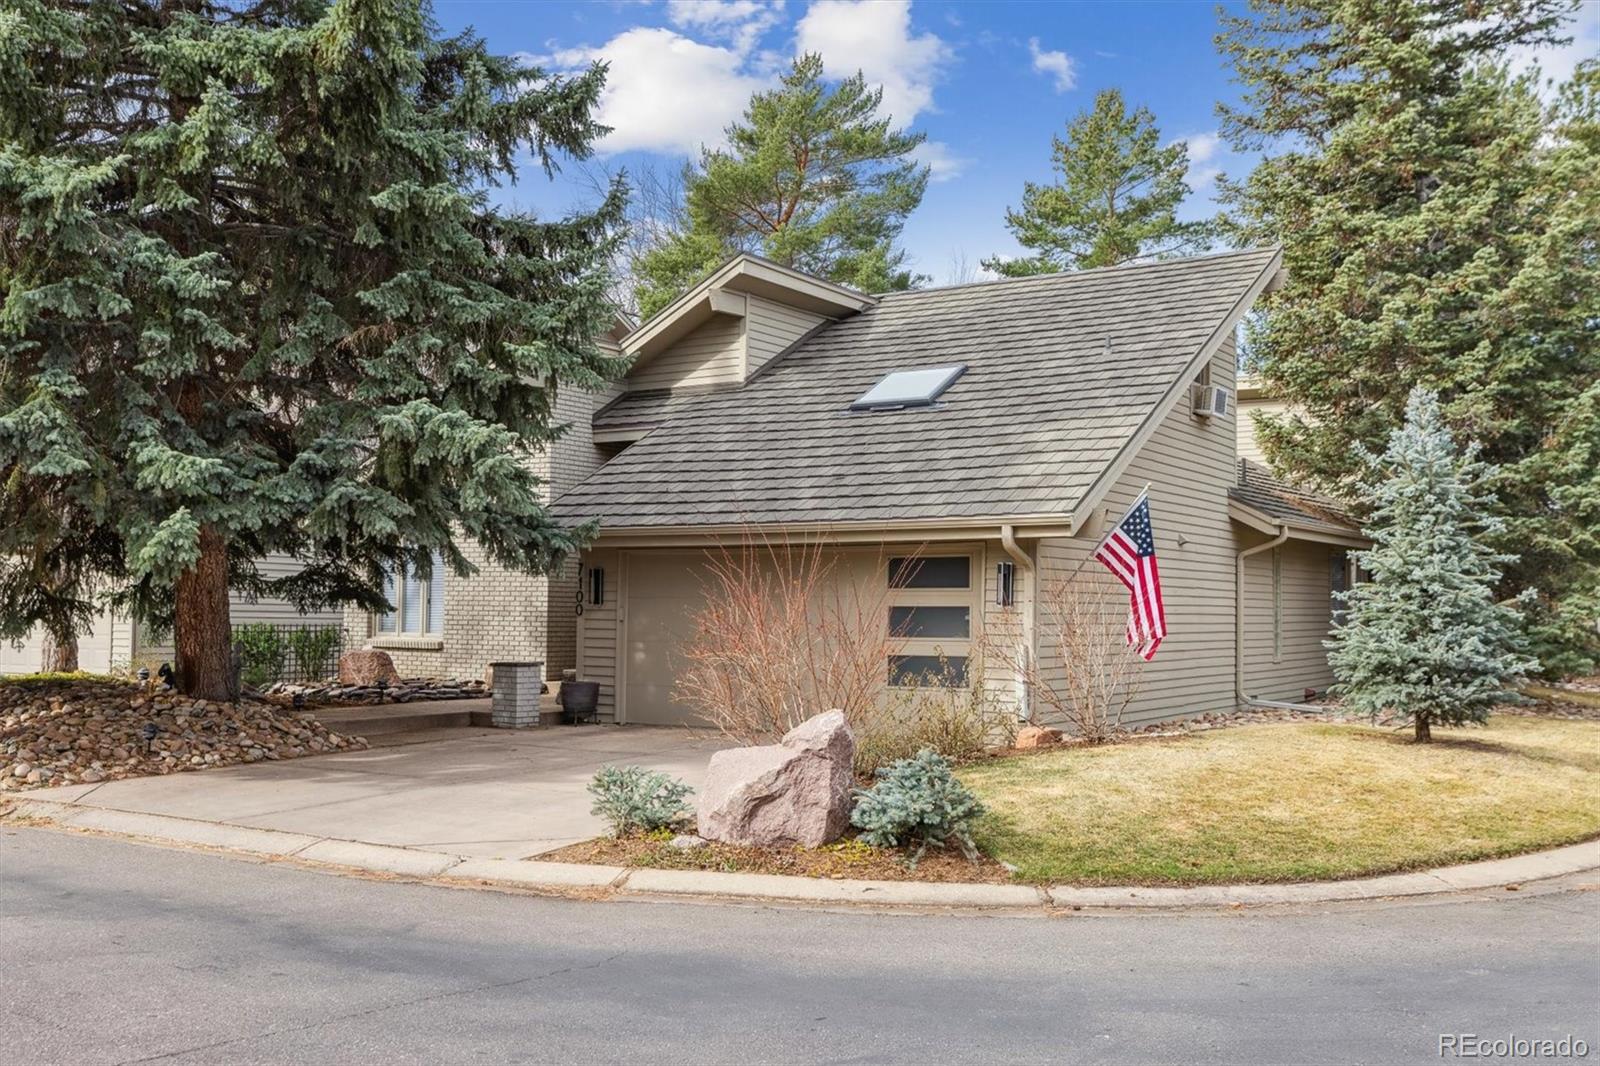
7100 Cedarwood Cir, Boulder, CO 80301
$-5,750
Cash flow
-20.1%
Cash-on-Cash Return
1.7%
Cap rate
0.3%
Rent to Value Ratio
Active
$595,000
3
bds
|
3
ba
|
1,785
sqft
|
built
2024
700 Lillibrook Pl, Lafayette, CO 80026
$-1,785
Cash flow
-15.7%
Cash-on-Cash Return
2.7%
Cap rate
0.4%
Rent to Value Ratio

Active
$1,199,000
4
bds
|
3
ba
|
2,816
sqft
|
built
1978
274 Boulder View Rd, Boulder, CO 80302
$-3,888
Cash flow
-16.9%
Cash-on-Cash Return
2.4%
Cap rate
0.3%
Rent to Value Ratio
Active
$625,000
3
bds
|
2
ba
|
1,554
sqft
|
built
1978
2725 Juniper Ave, Boulder, CO 80304
$-2,010
Cash flow
-16.8%
Cash-on-Cash Return
2.4%
Cap rate
0.4%
Rent to Value Ratio
Active
$1,075,000
4
bds
|
5
ba
|
3,353
sqft
|
built
2020
285 Clementina St, Louisville, CO 80027
$-3,159
Cash flow
-15.3%
Cash-on-Cash Return
2.8%
Cap rate
0.5%
Rent to Value Ratio
Active
$615,000
3
bds
|
4
ba
|
2,010
sqft
|
built
2013
1675 Saratoga Dr, Lafayette, CO 80026
$-1,931
Cash flow
-16.4%
Cash-on-Cash Return
2.5%
Cap rate
0.5%
Rent to Value Ratio
Active
$949,500
5
bds
|
4
ba
|
3,432
sqft
|
built
2000
1230 Tyler Pl, Erie, CO 80516
$-3,180
Cash flow
-17.5%
Cash-on-Cash Return
2.3%
Cap rate
0.4%
Rent to Value Ratio
Active
$575,000
3
bds
|
2
ba
|
956
sqft
|
built
2019
725 Amelia Ln, Lafayette, CO 80026
$-1,416
Cash flow
-12.8%
Cash-on-Cash Return
3.3%
Cap rate
0.5%
Rent to Value Ratio
Active
$675,000
4
bds
|
3
ba
|
1,736
sqft
|
built
1982
117 Sandler Dr, Lafayette, CO 80026
$-1,698
Cash flow
-13.1%
Cash-on-Cash Return
3.3%
Cap rate
0.5%
Rent to Value Ratio
Active under contract
$875,000
3
bds
|
3
ba
|
2,704
sqft
|
built
2016
1130 Summit View Dr, Louisville, CO 80027
$-3,042
Cash flow
-18.1%
Cash-on-Cash Return
2.1%
Cap rate
0.4%
Rent to Value Ratio
Pending
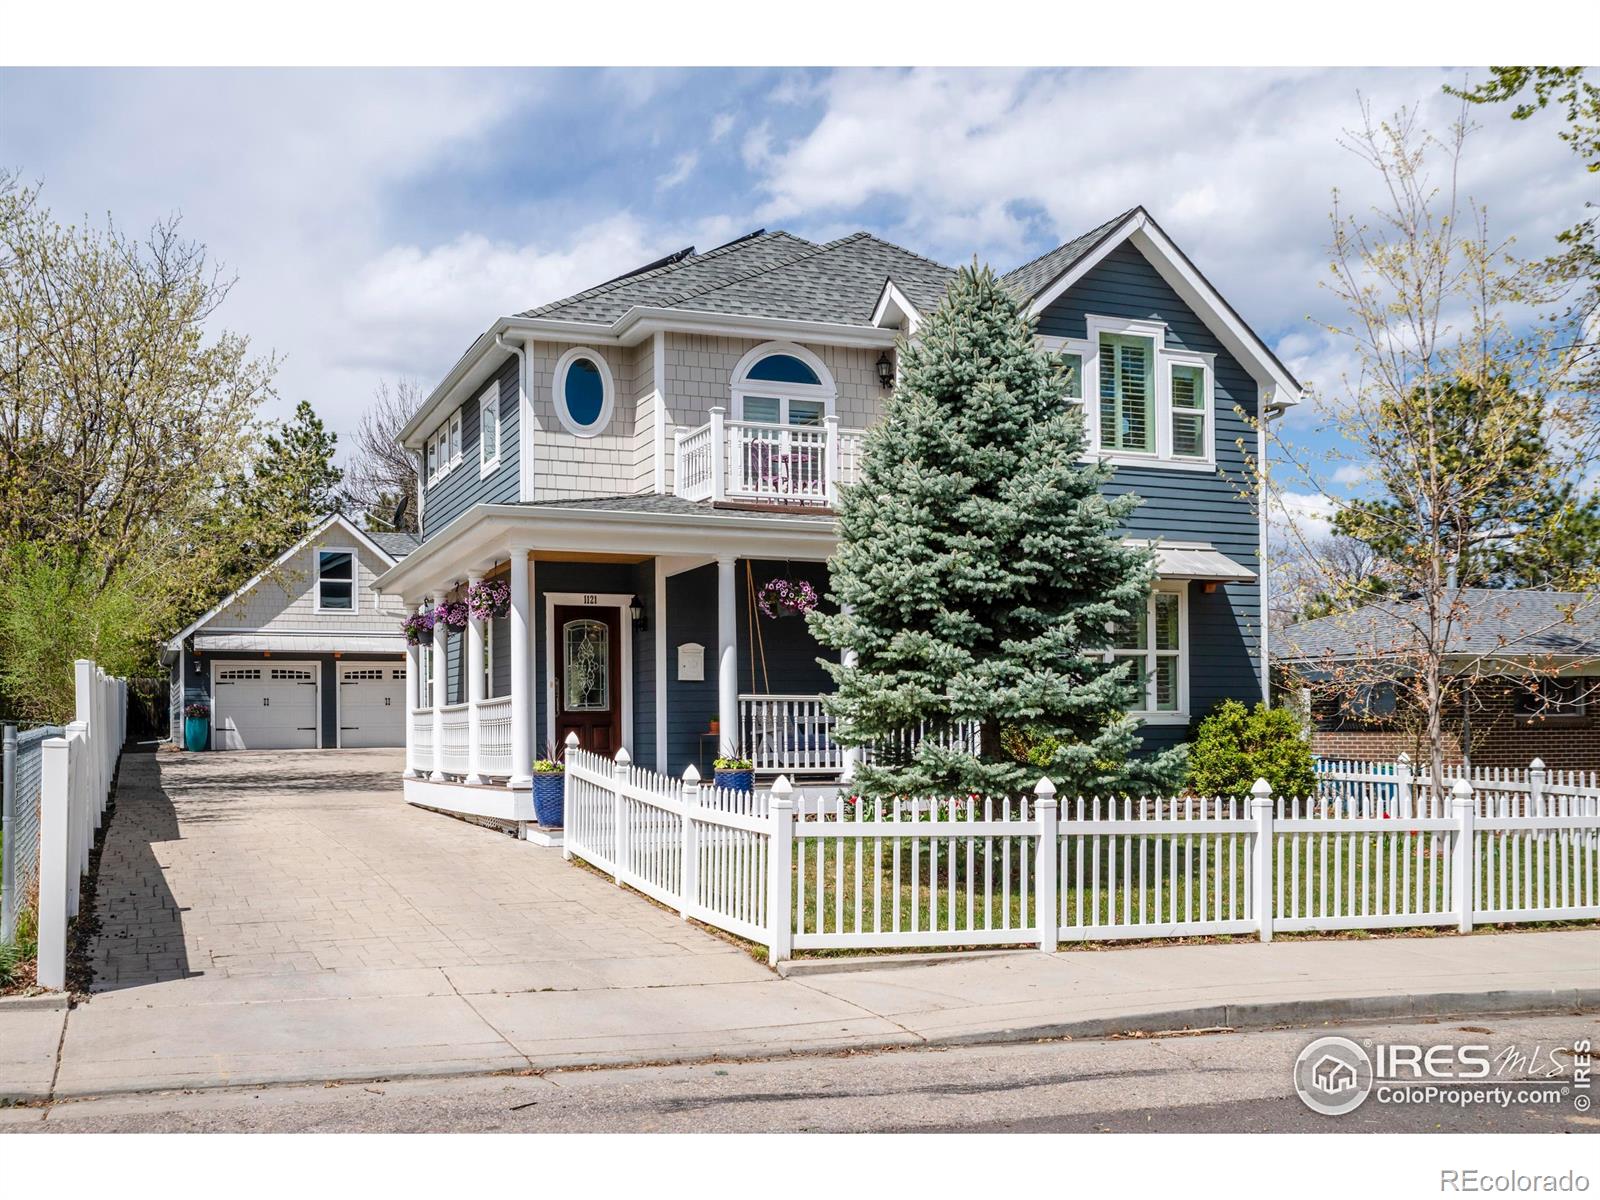
$1,595,000
4
bds
|
4
ba
|
2,375
sqft
|
built
2011
1121 Lincoln Ave, Louisville, CO 80027
$-6,536
Cash flow
-21.4%
Cash-on-Cash Return
1.4%
Cap rate
0.2%
Rent to Value Ratio
Active
$679,000
6
bds
|
3
ba
|
2,517
sqft
|
built
2002
1536 Goshawk Dr, Longmont, CO 80504
$-1,749
Cash flow
-13.4%
Cash-on-Cash Return
3.2%
Cap rate
0.5%
Rent to Value Ratio

Active
$1,100,000
6
bds
|
3
ba
|
2,800
sqft
|
built
1960
4293 Graham Ct, Boulder, CO 80305
$-3,798
Cash flow
-18.0%
Cash-on-Cash Return
2.1%
Cap rate
0.3%
Rent to Value Ratio
Active
$1,645,000
6
bds
|
6
ba
|
5,147
sqft
|
built
2004
1321 Onyx Cir, Longmont, CO 80504
$-5,407
Cash flow
-17.1%
Cash-on-Cash Return
2.3%
Cap rate
0.4%
Rent to Value Ratio
Active
$625,000
2
bds
|
1
ba
|
754
sqft
|
built
1951
1201 Balsam Ave, Boulder, CO 80304
$-2,045
Cash flow
-17.1%
Cash-on-Cash Return
2.4%
Cap rate
0.4%
Rent to Value Ratio
Active
$925,000
4
bds
|
4
ba
|
3,112
sqft
|
built
2002
3744 Gypsum Ct, Superior, CO 80027
$-2,922
Cash flow
-16.5%
Cash-on-Cash Return
2.5%
Cap rate
0.4%
Rent to Value Ratio
Active
$1,048,000
4
bds
|
3
ba
|
3,202
sqft
|
built
2021
741 Kohlor Dr, Lafayette, CO 80026
$-2,995
Cash flow
-14.9%
Cash-on-Cash Return
2.9%
Cap rate
0.4%
Rent to Value Ratio
Active
$1,175,000
6
bds
|
6
ba
|
3,967
sqft
|
built
2021
800 Meadowlark Dr, Erie, CO 80516
$-4,411
Cash flow
-19.6%
Cash-on-Cash Return
1.8%
Cap rate
0.3%
Rent to Value Ratio
Active
$1,295,000
4
bds
|
4
ba
|
3,540
sqft
|
built
1998
877 Eldorado Dr, Superior, CO 80027
$-4,062
Cash flow
-16.4%
Cash-on-Cash Return
2.5%
Cap rate
0.4%
Rent to Value Ratio
Active
$379,900
2
bds
|
2
ba
|
1,282
sqft
|
built
1999
820 Kimbark St, Longmont, CO 80501
$-853
Cash flow
-11.7%
Cash-on-Cash Return
3.6%
Cap rate
0.6%
Rent to Value Ratio
Active
$780,000
3
bds
|
2
ba
|
1,636
sqft
|
built
1983
38 Navajo Trl, Nederland, CO 80466
$-2,065
Cash flow
-13.8%
Cash-on-Cash Return
3.1%
Cap rate
0.4%
Rent to Value Ratio