Boulder County Investment Properties for Sale
Browse homes for sale and investment properties in Boulder County. Refine your search by price, property type, or more.
Best cash flowing properties in Boulder County
Active
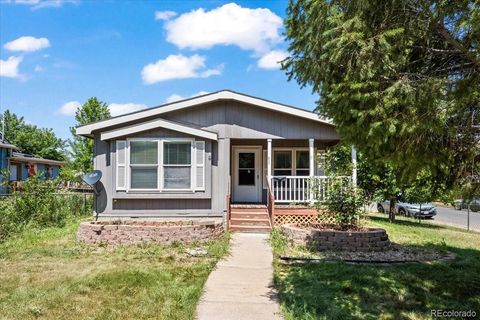
$299,000
2
bds
|
1
ba
|
916
sqft
|
built
1925
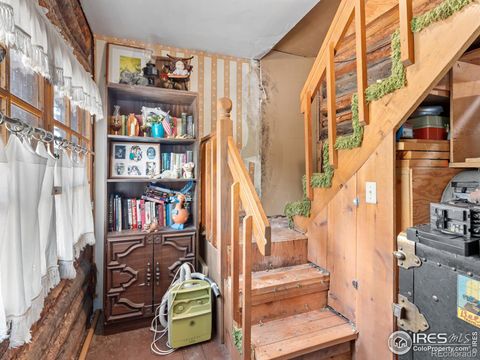
11650 Peak To Peak Dr, Allenspark, CO 80510
$-7
Cash flow
-0.1%
Cash-on-Cash Return
5.7%
Cap rate
0.7%
Rent to Value Ratio
Active
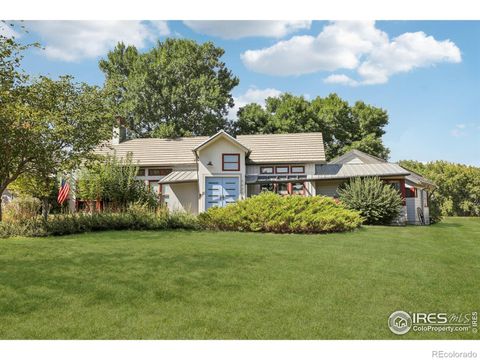
$440,000
3
bds
|
2
ba
|
1,517
sqft
|
built
1969
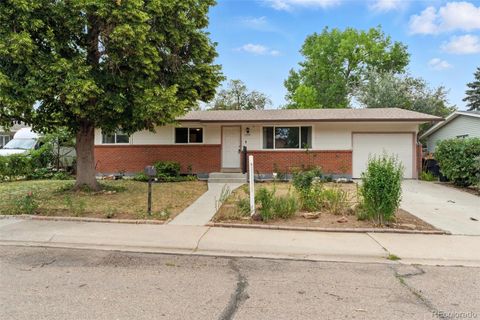
1534 Mount Evans Dr, Longmont, CO 80504
$-502
Cash flow
-6.0%
Cash-on-Cash Return
4.3%
Cap rate
0.6%
Rent to Value Ratio
954 out of 1,044 properties for sale in Boulder County
Limited Results Shown
Create a free account, or log in to reveal all property listings and enjoy the complete experience.

Active
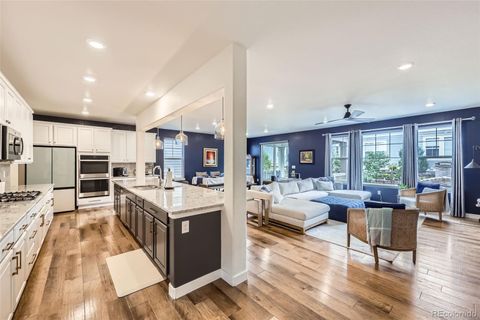
$349,900
2
bds
|
3
ba
|
1,171
sqft
|
built
2000
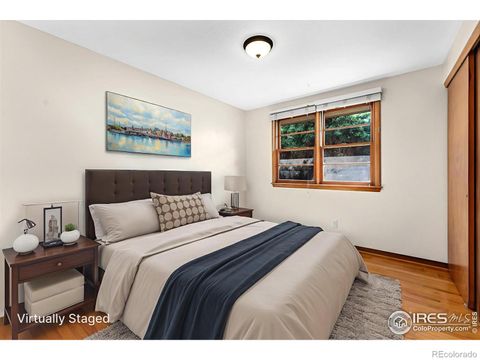
1601 Great Western Dr, Longmont, CO 80501
$-858
Cash flow
-12.8%
Cash-on-Cash Return
2.7%
Cap rate
0.6%
Rent to Value Ratio
Active
$475,000
3
bds
|
2
ba
|
1,086
sqft
|
built
1962
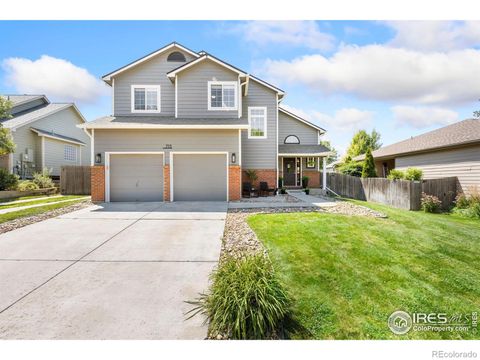
1247 Linden St, Longmont, CO 80501
$-734
Cash flow
-8.1%
Cash-on-Cash Return
3.8%
Cap rate
0.5%
Rent to Value Ratio

Active
$1,499,000
4
bds
|
5
ba
|
5,032
sqft
|
built
1972
14534 Fenton St, Broomfield, CO 80020
$-2,872
Cash flow
-10.0%
Cash-on-Cash Return
3.4%
Cap rate
0.5%
Rent to Value Ratio
Active
$579,000
3
bds
|
3
ba
|
1,694
sqft
|
built
1997
713 Pendleton Ave, Longmont, CO 80504
$-1,101
Cash flow
-9.9%
Cash-on-Cash Return
3.4%
Cap rate
0.5%
Rent to Value Ratio

Active
$475,000
2
bds
|
1
ba
|
1,044
sqft
|
built
1977
1129 Monroe Dr, Boulder, CO 80303
$-1,418
Cash flow
-15.6%
Cash-on-Cash Return
2.1%
Cap rate
0.5%
Rent to Value Ratio

Active
$745,000
3
bds
|
2
ba
|
1,491
sqft
|
built
1971
7646 Concord Dr, Boulder, CO 80301
$-1,435
Cash flow
-10.0%
Cash-on-Cash Return
3.4%
Cap rate
0.5%
Rent to Value Ratio
Active
$470,000
2
bds
|
1
ba
|
1,008
sqft
|
built
1953
1209 Gay St, Longmont, CO 80501
$-816
Cash flow
-9.1%
Cash-on-Cash Return
3.6%
Cap rate
0.5%
Rent to Value Ratio
Active
$720,000
4
bds
|
3
ba
|
2,577
sqft
|
built
1994
1108 Chokecherry Ln, Longmont, CO 80503
$-1,660
Cash flow
-12.0%
Cash-on-Cash Return
2.9%
Cap rate
0.4%
Rent to Value Ratio
Active
$349,900
3
bds
|
2
ba
|
1,300
sqft
|
built
2018
804 Summer Hawk Dr, Longmont, CO 80504
$-719
Cash flow
-10.7%
Cash-on-Cash Return
3.2%
Cap rate
0.6%
Rent to Value Ratio
Active
$695,000
3
bds
|
2
ba
|
1,642
sqft
|
built
1985
253 W Cedar Way, Louisville, CO 80027
$-1,699
Cash flow
-12.8%
Cash-on-Cash Return
2.7%
Cap rate
0.4%
Rent to Value Ratio
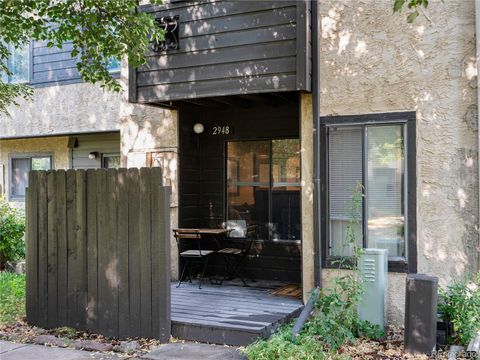
Active
$615,000
3
bds
|
4
ba
|
1,645
sqft
|
built
1980
2948 Shady Holw W, Boulder, CO 80304
$-1,655
Cash flow
-14.0%
Cash-on-Cash Return
2.4%
Cap rate
0.5%
Rent to Value Ratio
Active
$514,000
3
bds
|
3
ba
|
1,553
sqft
|
built
2002
2206 Watersong Cir, Longmont, CO 80504
$-1,156
Cash flow
-11.7%
Cash-on-Cash Return
3.0%
Cap rate
0.5%
Rent to Value Ratio
Active
$999,900
4
bds
|
4
ba
|
3,296
sqft
|
built
1993
1899 Breen Ln, Superior, CO 80027
$-2,575
Cash flow
-13.4%
Cash-on-Cash Return
2.6%
Cap rate
0.4%
Rent to Value Ratio
Active
$1,100,000
3
bds
|
3
ba
|
3,132
sqft
|
built
2016
2904 Casalon Cir, Superior, CO 80027
$-3,179
Cash flow
-15.1%
Cash-on-Cash Return
2.2%
Cap rate
0.4%
Rent to Value Ratio
Active
$1,200,000
3
bds
|
4
ba
|
3,299
sqft
|
built
2008
2712 Calmante Pl, Superior, CO 80027
$-3,954
Cash flow
-17.2%
Cash-on-Cash Return
1.7%
Cap rate
0.3%
Rent to Value Ratio
Active
$1,050,000
4
bds
|
3
ba
|
2,216
sqft
|
built
1970
6954 Wapiti Ct, Boulder, CO 80301
$-2,398
Cash flow
-11.9%
Cash-on-Cash Return
2.9%
Cap rate
0.4%
Rent to Value Ratio

Active
$8,750,000
4
bds
|
4
ba
|
4,578
sqft
|
built
1952
700 Utica Ave, Boulder, CO 80304
$-38,190
Cash flow
-22.8%
Cash-on-Cash Return
0.4%
Cap rate
0.1%
Rent to Value Ratio
Active
$1,150,000
5
bds
|
4
ba
|
3,732
sqft
|
built
1994
1293 Lost Angel Rd, Boulder, CO 80302
$-2,888
Cash flow
-13.1%
Cash-on-Cash Return
2.7%
Cap rate
0.4%
Rent to Value Ratio
Active
$1,150,000
3
bds
|
3
ba
|
2,351
sqft
|
built
1981
118 Crooked Spur, Boulder, CO 80302
$-3,902
Cash flow
-17.7%
Cash-on-Cash Return
1.6%
Cap rate
0.2%
Rent to Value Ratio

Active
$1,100,000
3
bds
|
3
ba
|
2,365
sqft
|
built
1970
5566 Sugarloaf Rd, Boulder, CO 80302
$-2,841
Cash flow
-13.5%
Cash-on-Cash Return
2.6%
Cap rate
0.4%
Rent to Value Ratio
Active
$2,200,000
3
bds
|
3
ba
|
2,857
sqft
|
built
1970
6972 Roaring Fork Trl, Boulder, CO 80301
$-8,103
Cash flow
-19.2%
Cash-on-Cash Return
1.3%
Cap rate
0.2%
Rent to Value Ratio

Active
$1,695,000
5
bds
|
3
ba
|
2,513
sqft
|
built
1950
2030 Columbine Ave, Boulder, CO 80302
$-4,858
Cash flow
-15.0%
Cash-on-Cash Return
2.2%
Cap rate
0.3%
Rent to Value Ratio

Active
$1,795,000
5
bds
|
4
ba
|
4,278
sqft
|
built
1972
4398 Carter Trl, Boulder, CO 80301
$-5,538
Cash flow
-16.1%
Cash-on-Cash Return
2.0%
Cap rate
0.3%
Rent to Value Ratio

Active
$1,085,000
3
bds
|
3
ba
|
2,112
sqft
|
built
1977
475 Deer Trail Rd, Boulder, CO 80302
$-2,411
Cash flow
-11.6%
Cash-on-Cash Return
3.0%
Cap rate
0.4%
Rent to Value Ratio

Active
$990,000
3
bds
|
3
ba
|
1,477
sqft
|
built
1976
4236 Redwood Ct, Boulder, CO 80301
$-2,939
Cash flow
-15.5%
Cash-on-Cash Return
2.1%
Cap rate
0.3%
Rent to Value Ratio

Active
$1,845,000
4
bds
|
4
ba
|
3,925
sqft
|
built
1995
1057 Reed Ranch Rd, Boulder, CO 80302
$-4,976
Cash flow
-14.1%
Cash-on-Cash Return
2.4%
Cap rate
0.4%
Rent to Value Ratio
Active
$875,000
5
bds
|
4
ba
|
3,636
sqft
|
built
1998
1414 Wildrose Dr, Longmont, CO 80503
$-1,849
Cash flow
-11.0%
Cash-on-Cash Return
3.1%
Cap rate
0.5%
Rent to Value Ratio
Active
$562,500
2
bds
|
3
ba
|
2,662
sqft
|
built
1986
2623 Elmhurst Cir, Longmont, CO 80503
$-1,422
Cash flow
-13.2%
Cash-on-Cash Return
2.6%
Cap rate
0.5%
Rent to Value Ratio

Active
$575,000
2
bds
|
1
ba
|
1,371
sqft
|
built
1947
24427 Peak To Peak Hwy, Nederland, CO 80466
$-1,100
Cash flow
-10.0%
Cash-on-Cash Return
3.4%
Cap rate
0.5%
Rent to Value Ratio
Active
$827,000
5
bds
|
4
ba
|
2,912
sqft
|
built
2012
549 Jackson St, Lafayette, CO 80026
$-2,192
Cash flow
-13.8%
Cash-on-Cash Return
2.5%
Cap rate
0.4%
Rent to Value Ratio
Active
$679,000
3
bds
|
3
ba
|
1,445
sqft
|
built
2004
511 E Emma St, Lafayette, CO 80026
$-1,449
Cash flow
-11.1%
Cash-on-Cash Return
3.1%
Cap rate
0.5%
Rent to Value Ratio
Active
$715,000
3
bds
|
3
ba
|
1,670
sqft
|
built
2004
561 Homestead St, Lafayette, CO 80026
$-1,881
Cash flow
-13.7%
Cash-on-Cash Return
2.5%
Cap rate
0.4%
Rent to Value Ratio

Active
$749,900
2
bds
|
2
ba
|
1,660
sqft
|
built
2016
688 Brennan Cir, Erie, CO 80516
$-2,273
Cash flow
-15.8%
Cash-on-Cash Return
2.0%
Cap rate
0.4%
Rent to Value Ratio

Active
$1,595,000
4
bds
|
5
ba
|
5,263
sqft
|
built
2017
2326 Carbonate Cir, Erie, CO 80516
$-5,598
Cash flow
-18.3%
Cash-on-Cash Return
1.5%
Cap rate
0.3%
Rent to Value Ratio

Active
$850,000
4
bds
|
4
ba
|
3,145
sqft
|
built
2018
1331 Fountain Ln, Erie, CO 80516
$-1,646
Cash flow
-10.1%
Cash-on-Cash Return
3.4%
Cap rate
0.5%
Rent to Value Ratio
Active
$2,450,000
3
bds
|
3
ba
|
3,184
sqft
|
built
1999
6423 Monarch Park Ct, Niwot, CO 80503
$-8,213
Cash flow
-17.5%
Cash-on-Cash Return
1.7%
Cap rate
0.2%
Rent to Value Ratio
Active
$1,049,000
7
bds
|
6
ba
|
6,089
sqft
|
built
2019
1063 Sandstone Cir, Erie, CO 80516
$-2,981
Cash flow
-14.8%
Cash-on-Cash Return
2.3%
Cap rate
0.4%
Rent to Value Ratio
Active
$675,000
2
bds
|
2
ba
|
1,250
sqft
|
built
1986
2805 Sundown Ln, Boulder, CO 80303
$-2,288
Cash flow
-17.7%
Cash-on-Cash Return
1.6%
Cap rate
0.4%
Rent to Value Ratio