Denver County Investment Properties for Sale
Browse homes for sale and investment properties in Denver County. Refine your search by price, property type, or more.
Best cash flowing properties in Denver County
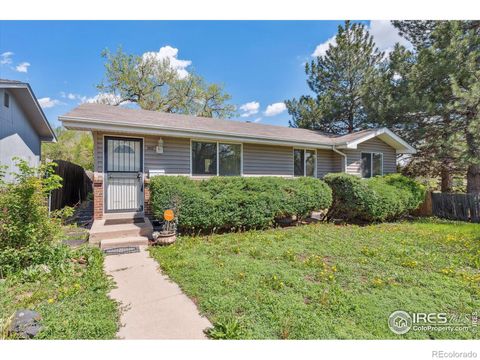
Active
$175,000
1
bds
|
1
ba
|
621
sqft
|
built
1970
3047 W 47th Ave, Denver, CO 80211
$97
Cash flow
2.9%
Cash-on-Cash Return
6.3%
Cap rate
1.0%
Rent to Value Ratio
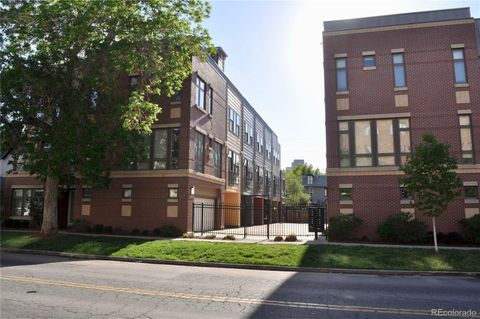
Active
$144,900
1
bds
|
1
ba
|
763
sqft
|
built
1971
7455 E Quincy Ave, Denver, CO 80237
$-104
Cash flow
-3.7%
Cash-on-Cash Return
4.8%
Cap rate
1.1%
Rent to Value Ratio
1,791 out of 1,887 properties for sale in Denver County
Limited Results Shown
Create a free account, or log in to reveal all property listings and enjoy the complete experience.
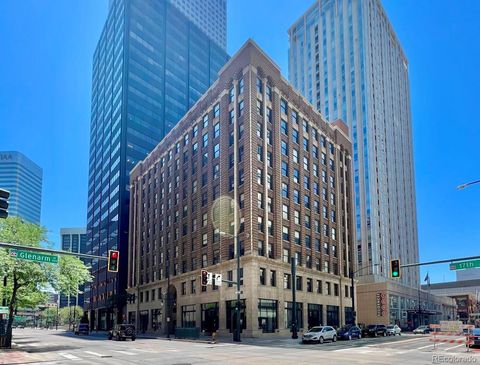
Active
$274,900
1
bds
|
1
ba
|
690
sqft
|
built
1938
444 17th St, Denver, CO 80202
$-773
Cash flow
-14.7%
Cash-on-Cash Return
2.3%
Cap rate
0.5%
Rent to Value Ratio
Active
$719,500
4
bds
|
2
ba
|
1,580
sqft
|
built
1941
2634 S Humboldt St, Denver, CO 80210
$-1,521
Cash flow
-11.0%
Cash-on-Cash Return
3.1%
Cap rate
0.4%
Rent to Value Ratio
Active
$2,325,000
4
bds
|
6
ba
|
4,045
sqft
|
built
2007
512 Cook St, Denver, CO 80206
$-8,074
Cash flow
-18.1%
Cash-on-Cash Return
1.5%
Cap rate
0.2%
Rent to Value Ratio
Active
$3,795,000
5
bds
|
6
ba
|
7,149
sqft
|
built
2007
295 Jersey St, Denver, CO 80220
$-15,151
Cash flow
-20.8%
Cash-on-Cash Return
0.9%
Cap rate
0.2%
Rent to Value Ratio
Active
$2,274,000
7
bds
|
6
ba
|
6,000
sqft
|
built
2025
4176 Zenobia St, Denver, CO 80212
$-9,711
Cash flow
-22.3%
Cash-on-Cash Return
0.6%
Cap rate
0.1%
Rent to Value Ratio
Active
$585,000
1
bds
|
2
ba
|
1,161
sqft
|
built
1928
1435 Wazee St, Denver, CO 80202
$-1,296
Cash flow
-11.6%
Cash-on-Cash Return
3.0%
Cap rate
0.5%
Rent to Value Ratio
Active
$1,400,000
3
bds
|
4
ba
|
3,141
sqft
|
built
1890
1928 S Washington St, Denver, CO 80210
$-2,883
Cash flow
-10.7%
Cash-on-Cash Return
3.2%
Cap rate
0.4%
Rent to Value Ratio
Active
$685,000
4
bds
|
4
ba
|
2,461
sqft
|
built
1976
4720 W Stanford Ave, Denver, CO 80236
$-1,153
Cash flow
-8.8%
Cash-on-Cash Return
3.7%
Cap rate
0.5%
Rent to Value Ratio
Active
$1,290,000
4
bds
|
4
ba
|
3,600
sqft
|
built
2006
1907 S Columbine St, Denver, CO 80210
$-3,250
Cash flow
-13.1%
Cash-on-Cash Return
2.7%
Cap rate
0.4%
Rent to Value Ratio

Active
$199,000
1
bds
|
1
ba
|
442
sqft
|
built
1968
155 S Pennsylvania St, Denver, CO 80209
$-190
Cash flow
-5.0%
Cash-on-Cash Return
4.5%
Cap rate
0.8%
Rent to Value Ratio
Active
$383,000
3
bds
|
3
ba
|
1,352
sqft
|
built
1969
6340 E Mississippi Ave, Denver, CO 80224
$-711
Cash flow
-9.7%
Cash-on-Cash Return
3.4%
Cap rate
0.7%
Rent to Value Ratio
Active
$470,000
4
bds
|
2
ba
|
1,892
sqft
|
built
1970
200 Perry St, Denver, CO 80219
$-672
Cash flow
-7.5%
Cash-on-Cash Return
4.0%
Cap rate
0.5%
Rent to Value Ratio
Active
$4,200,000
4
bds
|
4
ba
|
4,359
sqft
|
built
1926
140 Race St, Denver, CO 80206
$-15,914
Cash flow
-19.8%
Cash-on-Cash Return
1.1%
Cap rate
0.2%
Rent to Value Ratio
Active
$754,900
2
bds
|
4
ba
|
1,577
sqft
|
built
2016
2147 N Downing St, Denver, CO 80205
$-1,570
Cash flow
-10.9%
Cash-on-Cash Return
3.2%
Cap rate
0.5%
Rent to Value Ratio
Active
$225,000
1
bds
|
1
ba
|
618
sqft
|
built
1983
4899 S Dudley St, Littleton, CO 80123
$-313
Cash flow
-7.3%
Cash-on-Cash Return
4.0%
Cap rate
0.7%
Rent to Value Ratio
Active
$405,000
1
bds
|
1
ba
|
826
sqft
|
built
2003
1440 Little Raven St, Denver, CO 80202
$-1,009
Cash flow
-13.0%
Cash-on-Cash Return
2.7%
Cap rate
0.5%
Rent to Value Ratio
Active
$1,097,500
3
bds
|
3
ba
|
2,082
sqft
|
built
1903
432 N Ogden St, Denver, CO 80218
$-2,499
Cash flow
-11.9%
Cash-on-Cash Return
2.9%
Cap rate
0.4%
Rent to Value Ratio
Active
$1,706,250
7
bds
|
4
ba
|
3,958
sqft
|
built
1912
2900 W 32nd Ave, Denver, CO 80211
$-4,982
Cash flow
-15.2%
Cash-on-Cash Return
2.2%
Cap rate
0.3%
Rent to Value Ratio
Active
$787,500
2
bds
|
3
ba
|
1,941
sqft
|
built
1981
1350 Lawrence St, Denver, CO 80204
$-2,747
Cash flow
-18.2%
Cash-on-Cash Return
1.5%
Cap rate
0.5%
Rent to Value Ratio
Active
$300,000
2
bds
|
2
ba
|
1,249
sqft
|
built
2005
5800 Tower Rd, Denver, CO 80249
$-416
Cash flow
-7.2%
Cash-on-Cash Return
4.0%
Cap rate
0.7%
Rent to Value Ratio
Active
$439,000
2
bds
|
2
ba
|
1,227
sqft
|
built
1962
3100 E Cherry Creek South Dr, Denver, CO 80209
$-1,294
Cash flow
-15.4%
Cash-on-Cash Return
2.1%
Cap rate
0.6%
Rent to Value Ratio
Active
$569,000
2
bds
|
3
ba
|
2,869
sqft
|
built
1983
6969 W Yale Ave, Denver, CO 80227
$-1,369
Cash flow
-12.6%
Cash-on-Cash Return
2.8%
Cap rate
0.6%
Rent to Value Ratio
Active
$230,000
1
bds
|
1
ba
|
437
sqft
|
built
1967
36 N Emerson St, Denver, CO 80218
$-369
Cash flow
-8.4%
Cash-on-Cash Return
3.8%
Cap rate
0.7%
Rent to Value Ratio
Active
$708,030
4
bds
|
2
ba
|
1,642
sqft
|
built
1892
2514 N Humboldt St, Denver, CO 80205
$-1,439
Cash flow
-10.6%
Cash-on-Cash Return
3.2%
Cap rate
0.5%
Rent to Value Ratio
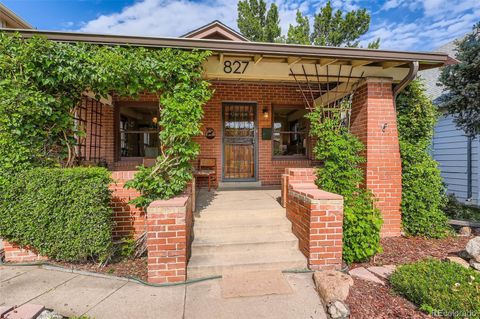
Active
$693,000
2
bds
|
1
ba
|
1,023
sqft
|
built
1922
827 S Sherman St, Denver, CO 80209
$-1,520
Cash flow
-11.4%
Cash-on-Cash Return
3.0%
Cap rate
0.4%
Rent to Value Ratio
Active
$450,000
1
bds
|
2
ba
|
1,322
sqft
|
built
1997
290 W 12th Ave, Denver, CO 80204
$-1,111
Cash flow
-12.9%
Cash-on-Cash Return
2.7%
Cap rate
0.6%
Rent to Value Ratio
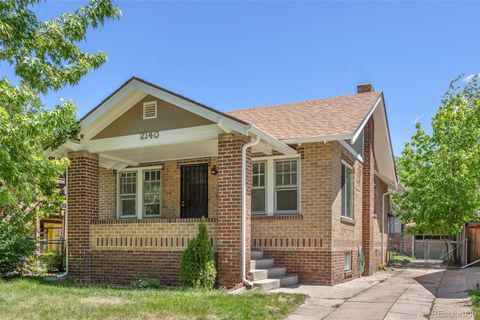
Active
$650,000
3
bds
|
1
ba
|
768
sqft
|
built
1928
2140 S Washington St, Denver, CO 80210
$-1,399
Cash flow
-11.2%
Cash-on-Cash Return
3.1%
Cap rate
0.4%
Rent to Value Ratio
Active
$439,900
4
bds
|
2
ba
|
866
sqft
|
built
1969
5519 Tucson St, Denver, CO 80239
$-324
Cash flow
-3.8%
Cash-on-Cash Return
4.8%
Cap rate
0.6%
Rent to Value Ratio
Active
$875,000
4
bds
|
2
ba
|
1,844
sqft
|
built
1948
1100 S Garfield St, Denver, CO 80210
$-2,019
Cash flow
-12.0%
Cash-on-Cash Return
2.9%
Cap rate
0.4%
Rent to Value Ratio

Active
$169,900
2
bds
|
1
ba
|
852
sqft
|
built
1971
875 S Quebec St, Denver, CO 80247
$-321
Cash flow
-9.9%
Cash-on-Cash Return
3.4%
Cap rate
0.8%
Rent to Value Ratio
Active
$475,000
3
bds
|
3
ba
|
1,866
sqft
|
built
2017
4774 Kittredge St, Denver, CO 80239
$-1,022
Cash flow
-11.2%
Cash-on-Cash Return
3.1%
Cap rate
0.6%
Rent to Value Ratio
Active
$417,000
2
bds
|
1
ba
|
868
sqft
|
built
1931
765 S Krameria St, Denver, CO 80224
$-617
Cash flow
-7.7%
Cash-on-Cash Return
3.9%
Cap rate
0.5%
Rent to Value Ratio
Active
$889,000
4
bds
|
4
ba
|
3,272
sqft
|
built
2014
5511 Wabash St, Denver, CO 80238
$-2,207
Cash flow
-13.0%
Cash-on-Cash Return
2.7%
Cap rate
0.5%
Rent to Value Ratio
Active
$650,000
2
bds
|
2
ba
|
1,218
sqft
|
built
1891
3547 Osage St, Denver, CO 80211
$-716
Cash flow
-5.7%
Cash-on-Cash Return
4.4%
Cap rate
0.6%
Rent to Value Ratio
Active
$1,099,000
4
bds
|
3
ba
|
1,986
sqft
|
built
1913
458 S Downing St, Denver, CO 80209
$-2,191
Cash flow
-10.4%
Cash-on-Cash Return
3.3%
Cap rate
0.5%
Rent to Value Ratio
Active
$341,158
2
bds
|
1
ba
|
737
sqft
|
built
2017
1750 Wewatta St, Denver, CO 80202
$-1,070
Cash flow
-16.4%
Cash-on-Cash Return
1.9%
Cap rate
0.6%
Rent to Value Ratio
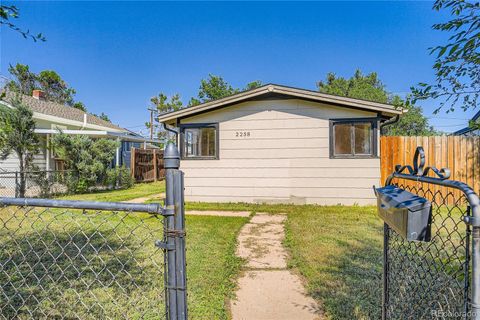
Active
$360,000
2
bds
|
1
ba
|
931
sqft
|
built
1934
2258 S Galapago St, Denver, CO 80223
$-211
Cash flow
-3.1%
Cash-on-Cash Return
5.0%
Cap rate
0.7%
Rent to Value Ratio
Active
$650,000
2
bds
|
3
ba
|
1,478
sqft
|
built
2016
2426 Welton St, Denver, CO 80205
$-1,349
Cash flow
-10.8%
Cash-on-Cash Return
3.2%
Cap rate
0.5%
Rent to Value Ratio