Denver County Investment Properties for Sale
Browse homes for sale and investment properties in Denver County. Refine your search by price, property type, or more.
Best cash flowing properties in Denver County
Active
$154,900
1
bds
|
1
ba
|
763
sqft
|
built
1971
7455 E Quincy Ave, Denver, CO 80237
$-229
Cash flow
-7.7%
Cash-on-Cash Return
4.5%
Cap rate
1.0%
Rent to Value Ratio
Active
$339,900
2
bds
|
1
ba
|
704
sqft
|
built
1953
2621 S Federal Blvd, Denver, CO 80219
$-320
Cash flow
-4.9%
Cash-on-Cash Return
5.2%
Cap rate
0.7%
Rent to Value Ratio
3,113 out of 3,223 properties for sale in Denver County
Limited Results Shown
Create a free account, or log in to reveal all property listings and enjoy the complete experience.
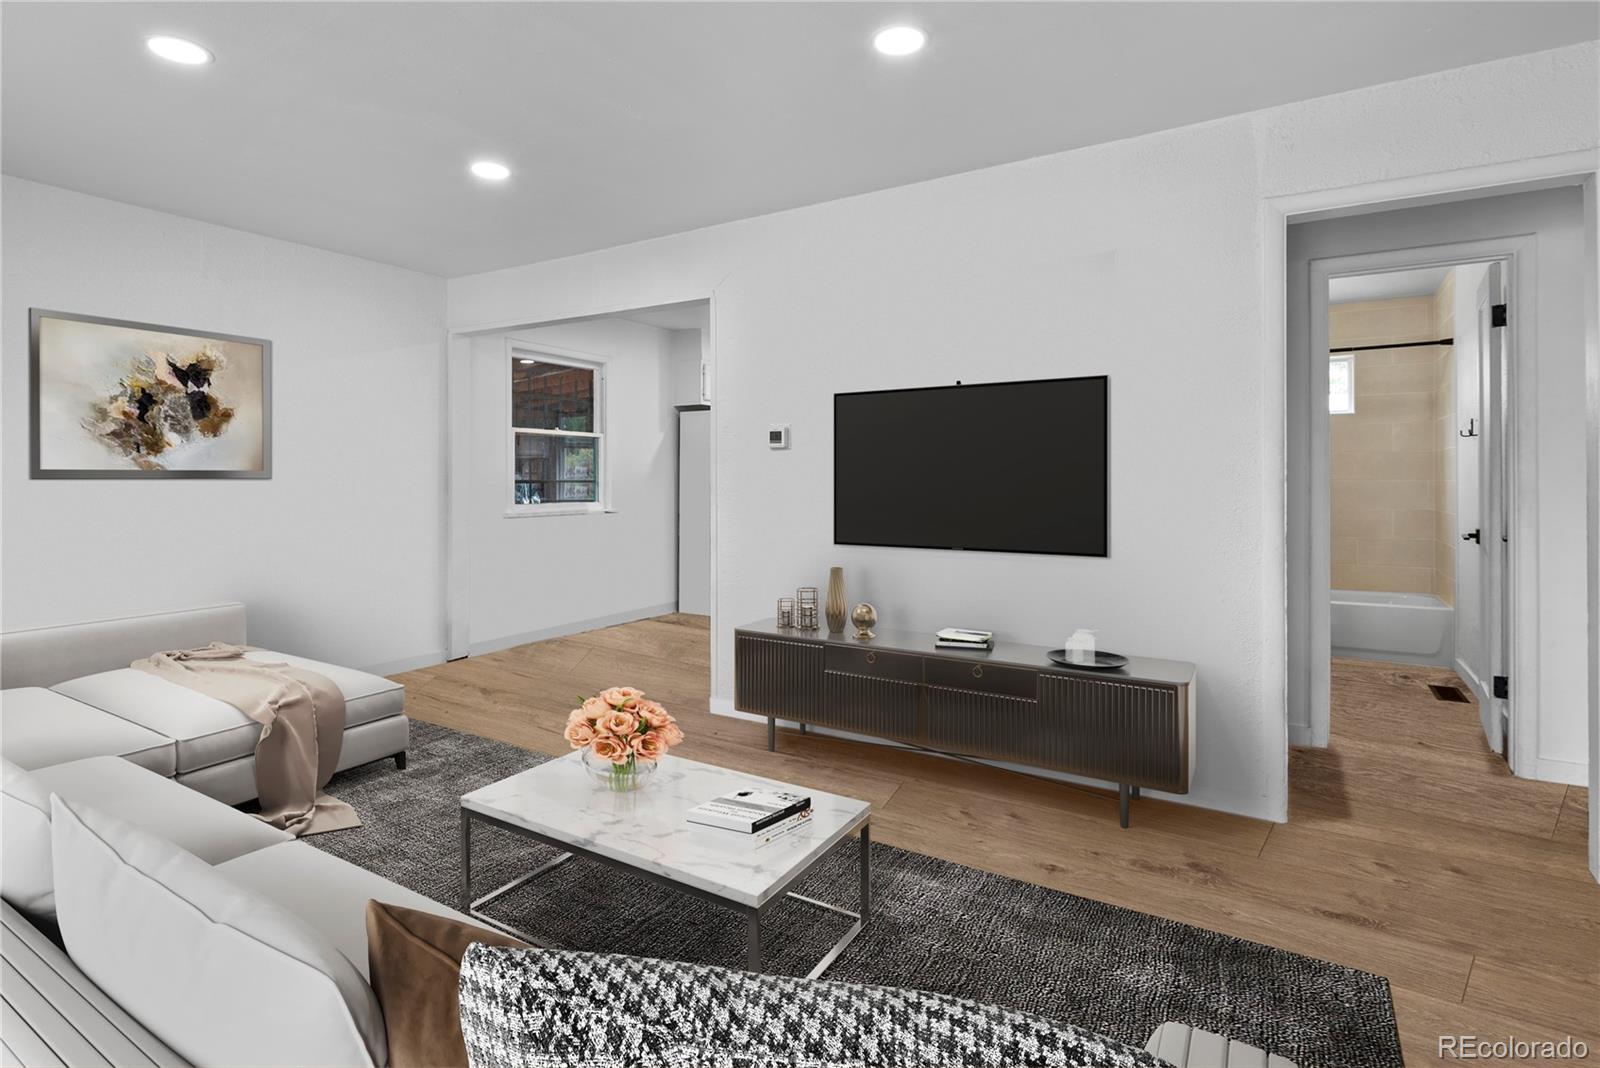
Active
$525,000
2
bds
|
2
ba
|
1,016
sqft
|
built
1906
3953 Tejon St, Denver, CO 80211
$-1,044
Cash flow
-10.4%
Cash-on-Cash Return
3.9%
Cap rate
0.5%
Rent to Value Ratio
Active
$154,900
1
bds
|
1
ba
|
763
sqft
|
built
1971
7455 E Quincy Ave, Denver, CO 80237
$-229
Cash flow
-7.7%
Cash-on-Cash Return
4.5%
Cap rate
1.0%
Rent to Value Ratio
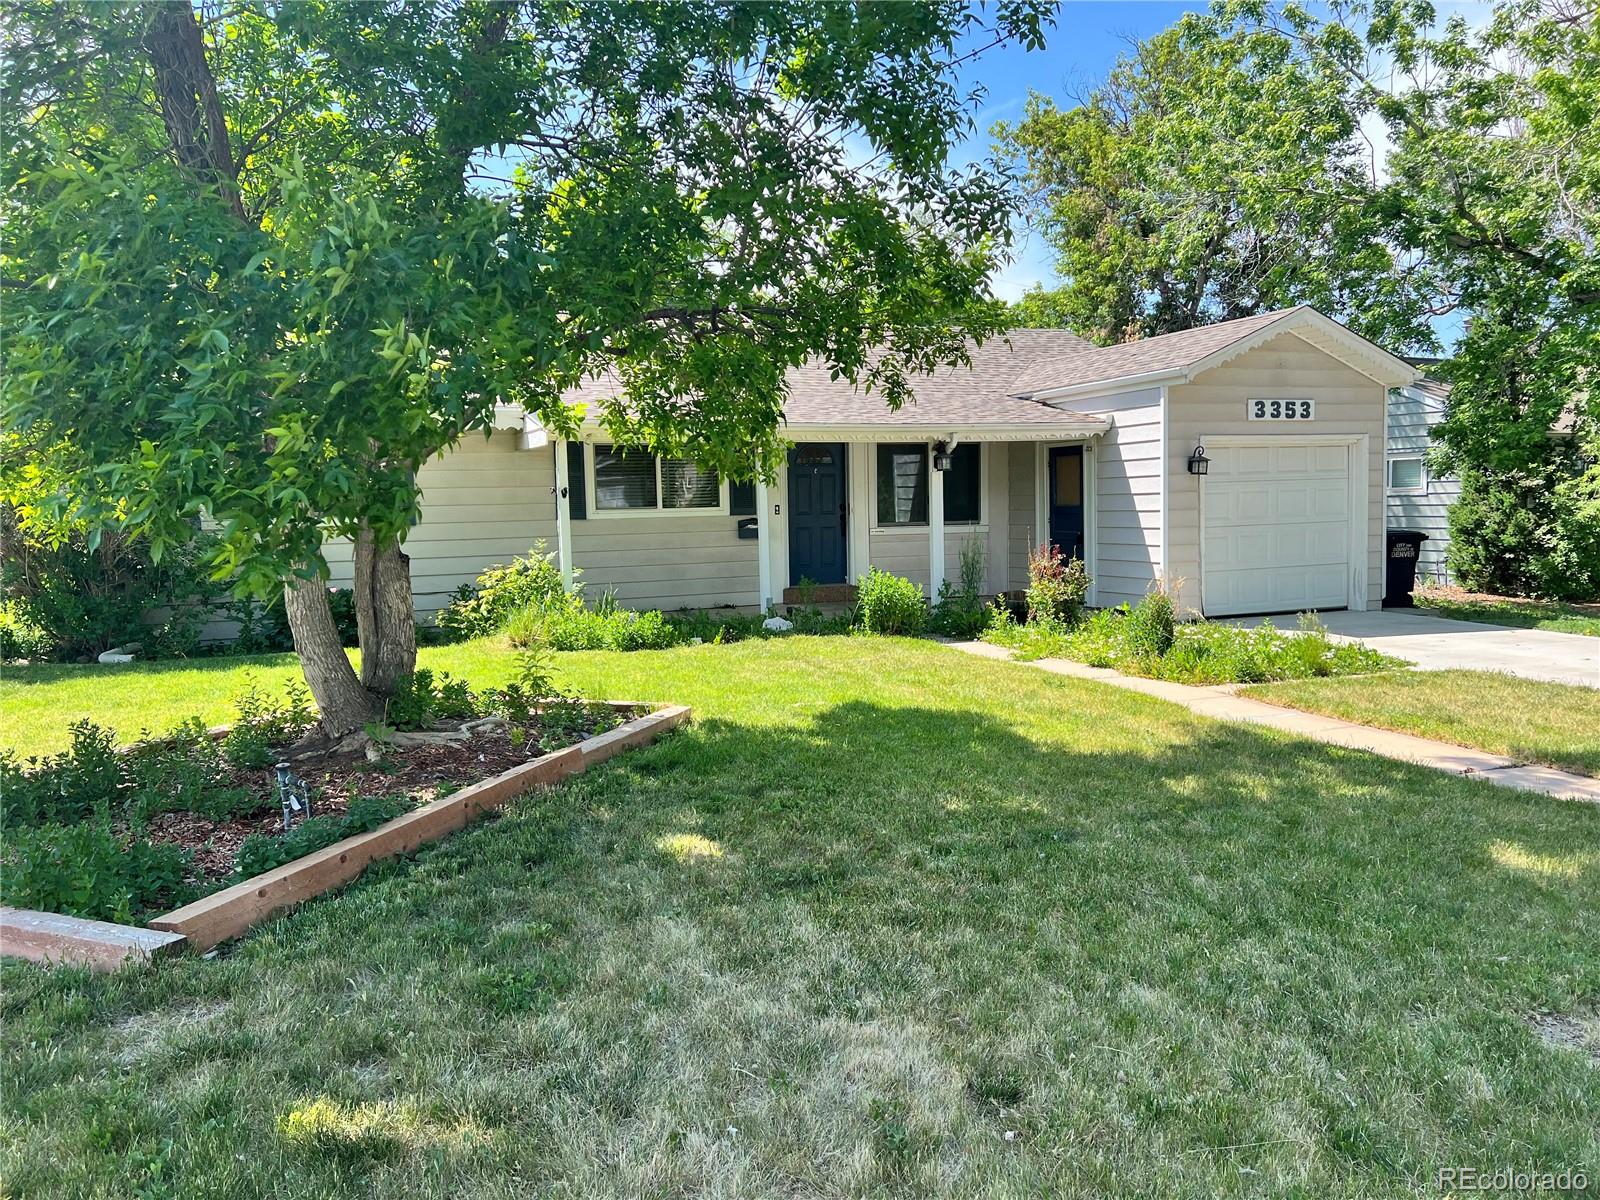
Active
$574,900
2
bds
|
2
ba
|
1,839
sqft
|
built
1953
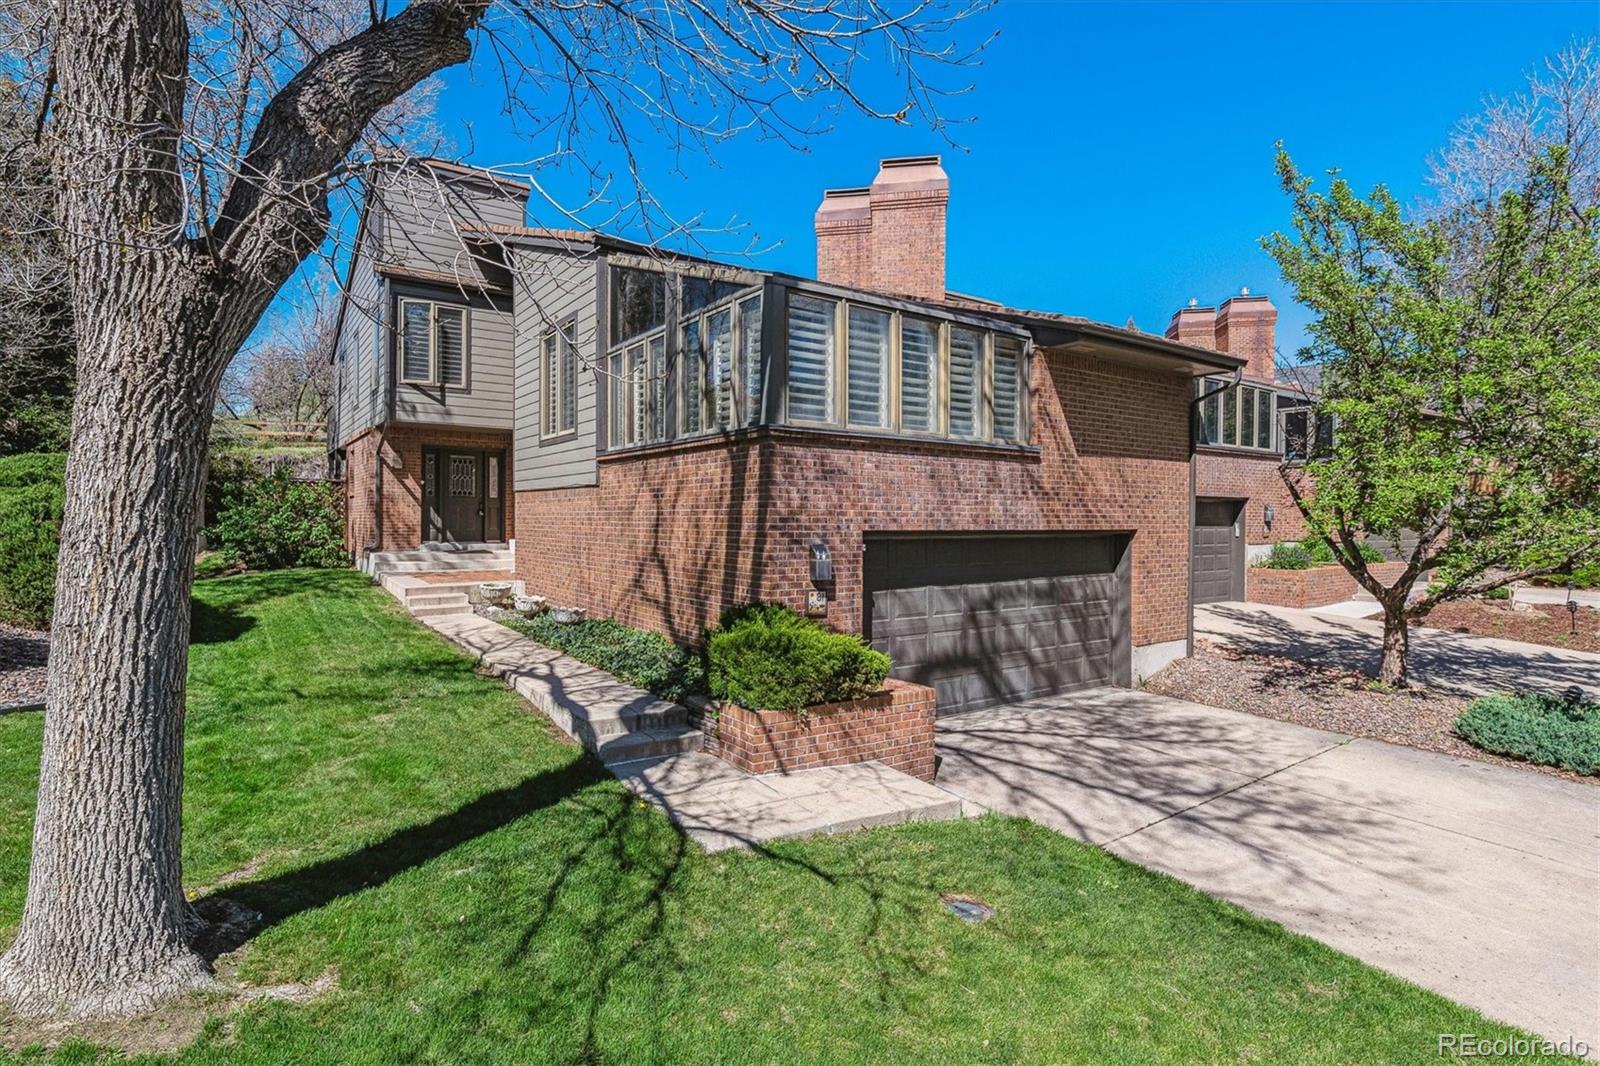
3353 S Glencoe St, Denver, CO 80222
$-988
Cash flow
-9.0%
Cash-on-Cash Return
4.2%
Cap rate
0.6%
Rent to Value Ratio
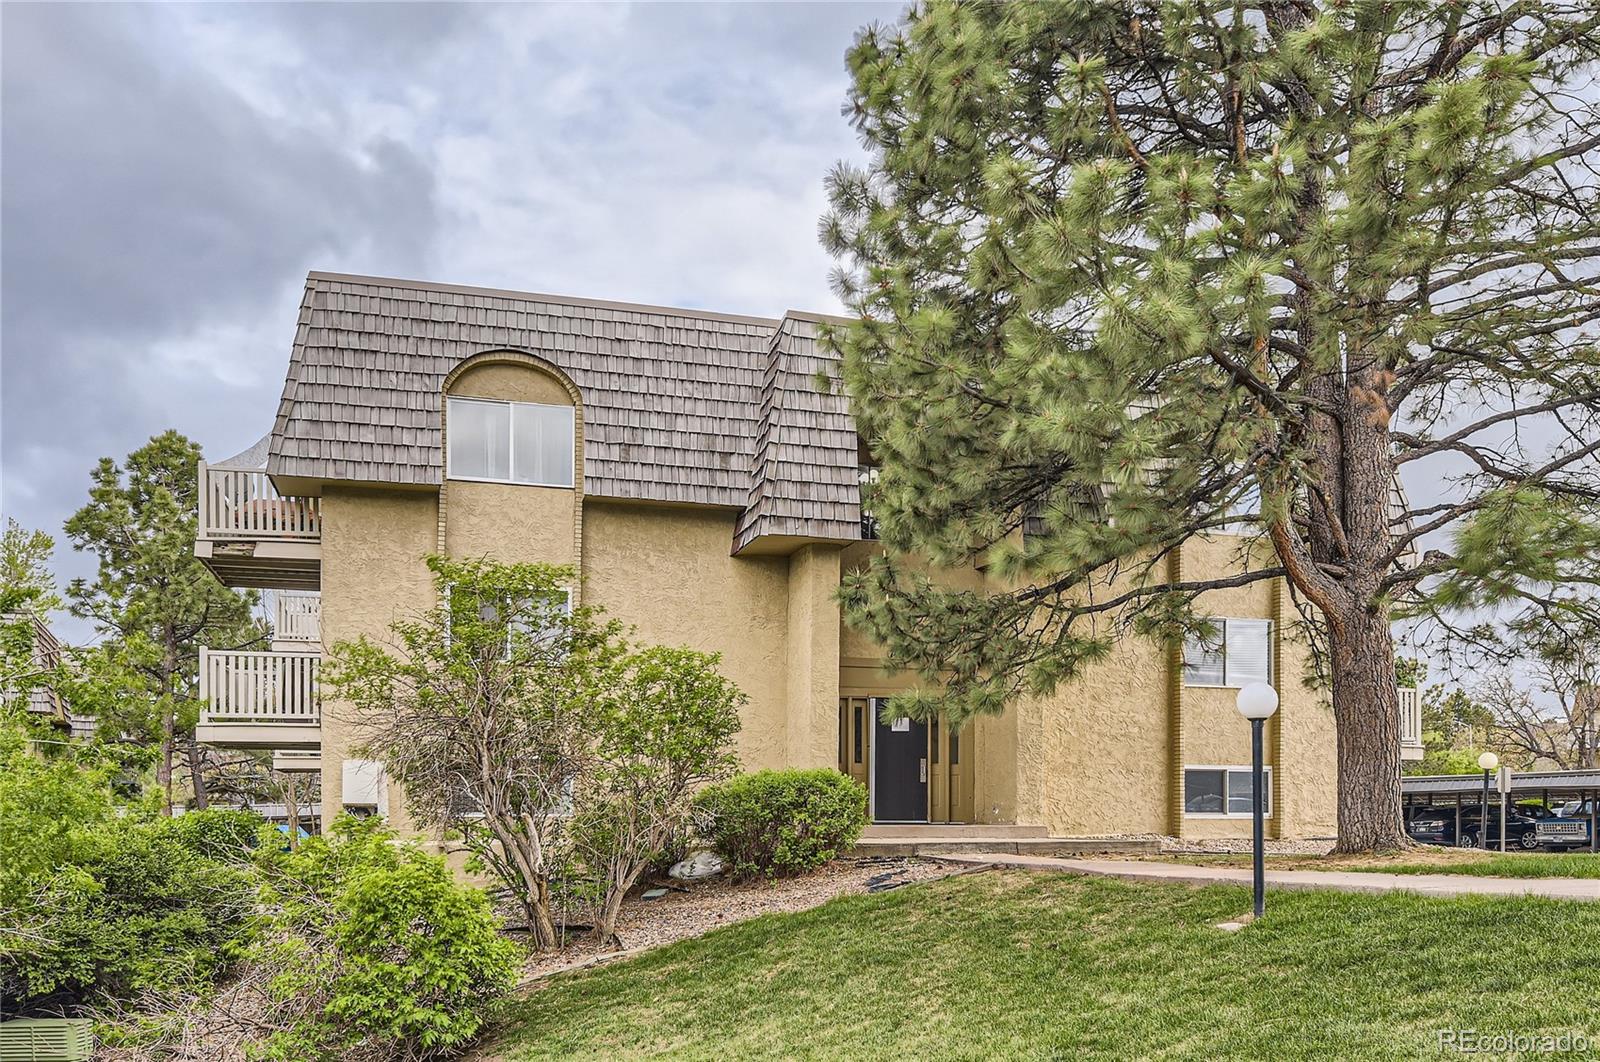
Active
$589,900
2
bds
|
3
ba
|
2,869
sqft
|
built
1983
6969 W Yale Ave, Denver, CO 80227
$-1,765
Cash flow
-15.6%
Cash-on-Cash Return
2.7%
Cap rate
0.5%
Rent to Value Ratio

Active
$230,000
1
bds
|
1
ba
|
437
sqft
|
built
1967
36 N Emerson St, Denver, CO 80218
$-485
Cash flow
-11.0%
Cash-on-Cash Return
3.8%
Cap rate
0.7%
Rent to Value Ratio
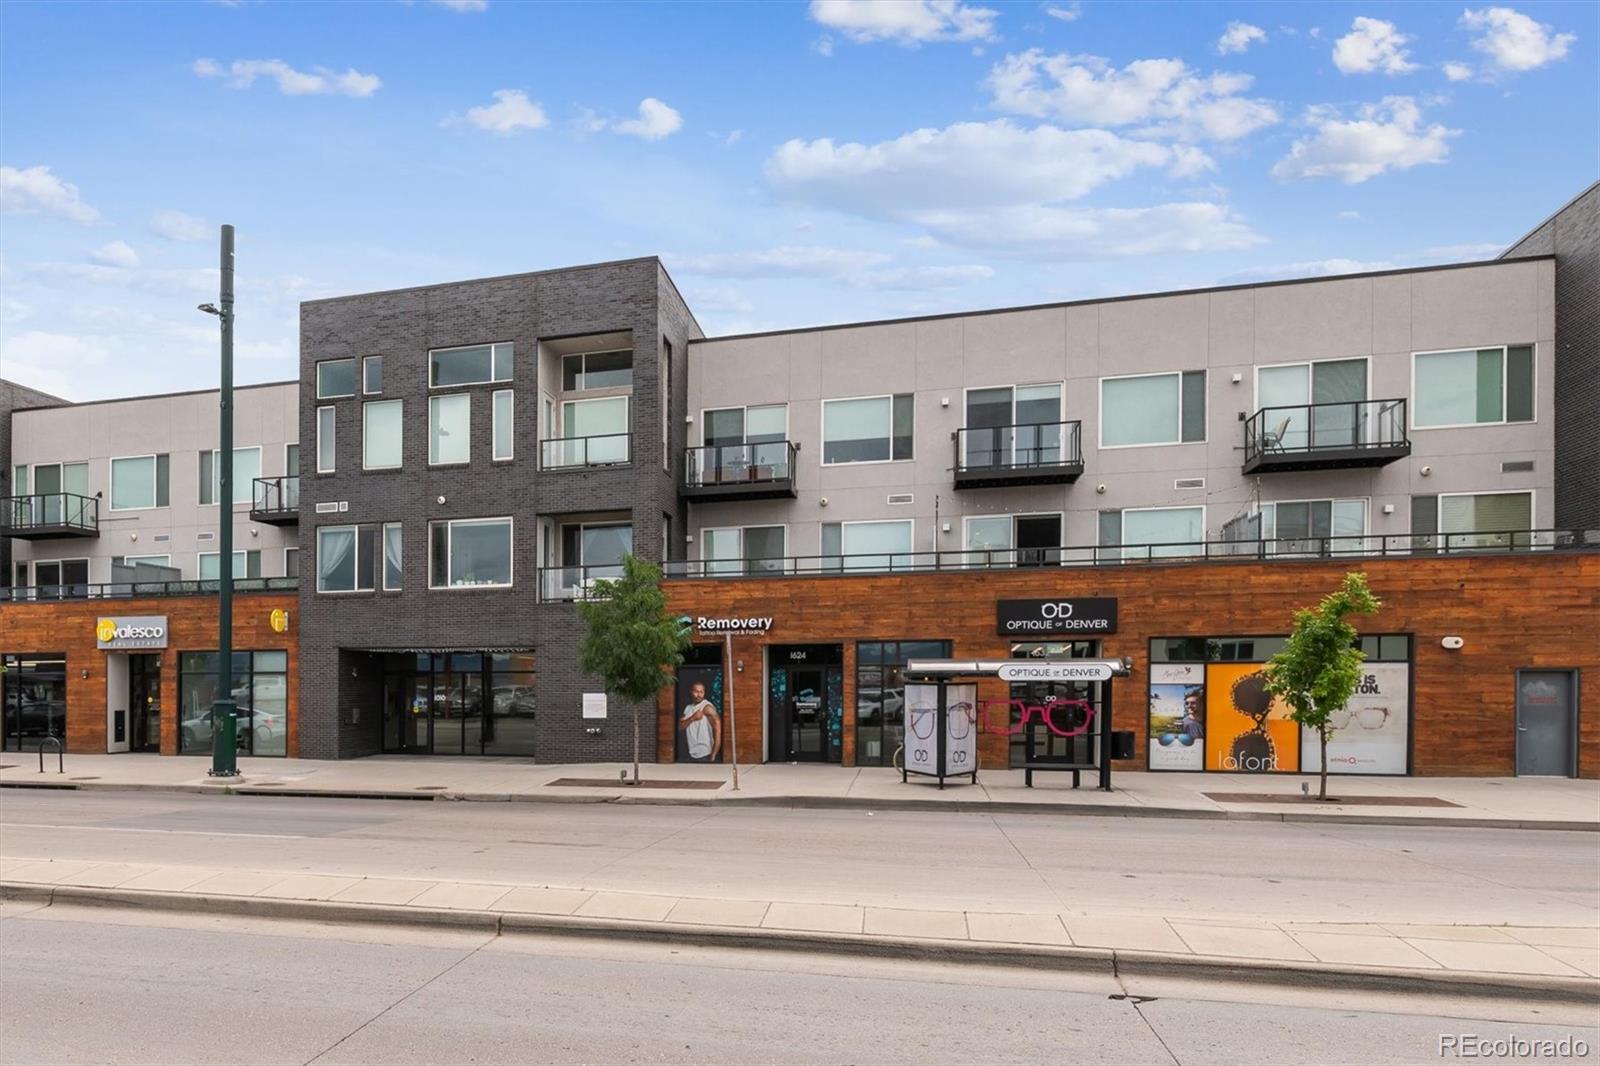
Active
$580,000
2
bds
|
2
ba
|
1,250
sqft
|
built
2019
1616 S Broadway, Denver, CO 80210
$-1,604
Cash flow
-14.4%
Cash-on-Cash Return
3.0%
Cap rate
0.5%
Rent to Value Ratio
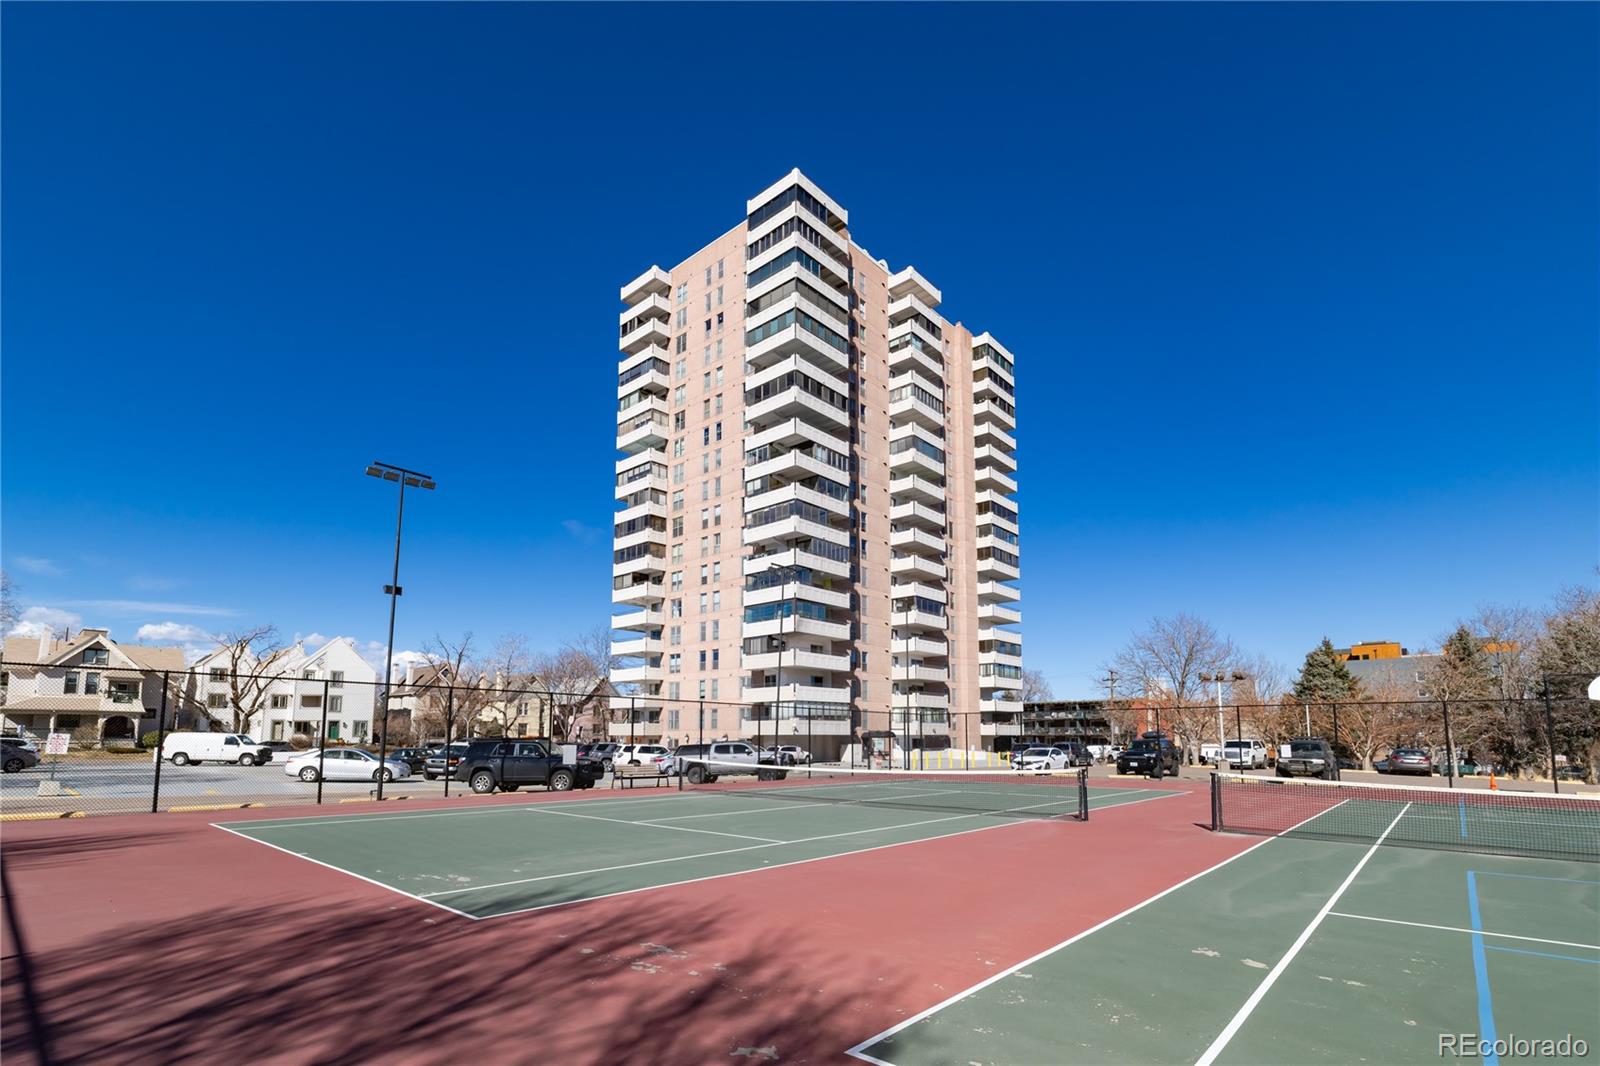
Active
$825,000
3
bds
|
3
ba
|
2,092
sqft
|
built
1969
130 N Pearl St, Denver, CO 80203
$-3,144
Cash flow
-19.9%
Cash-on-Cash Return
1.7%
Cap rate
0.5%
Rent to Value Ratio
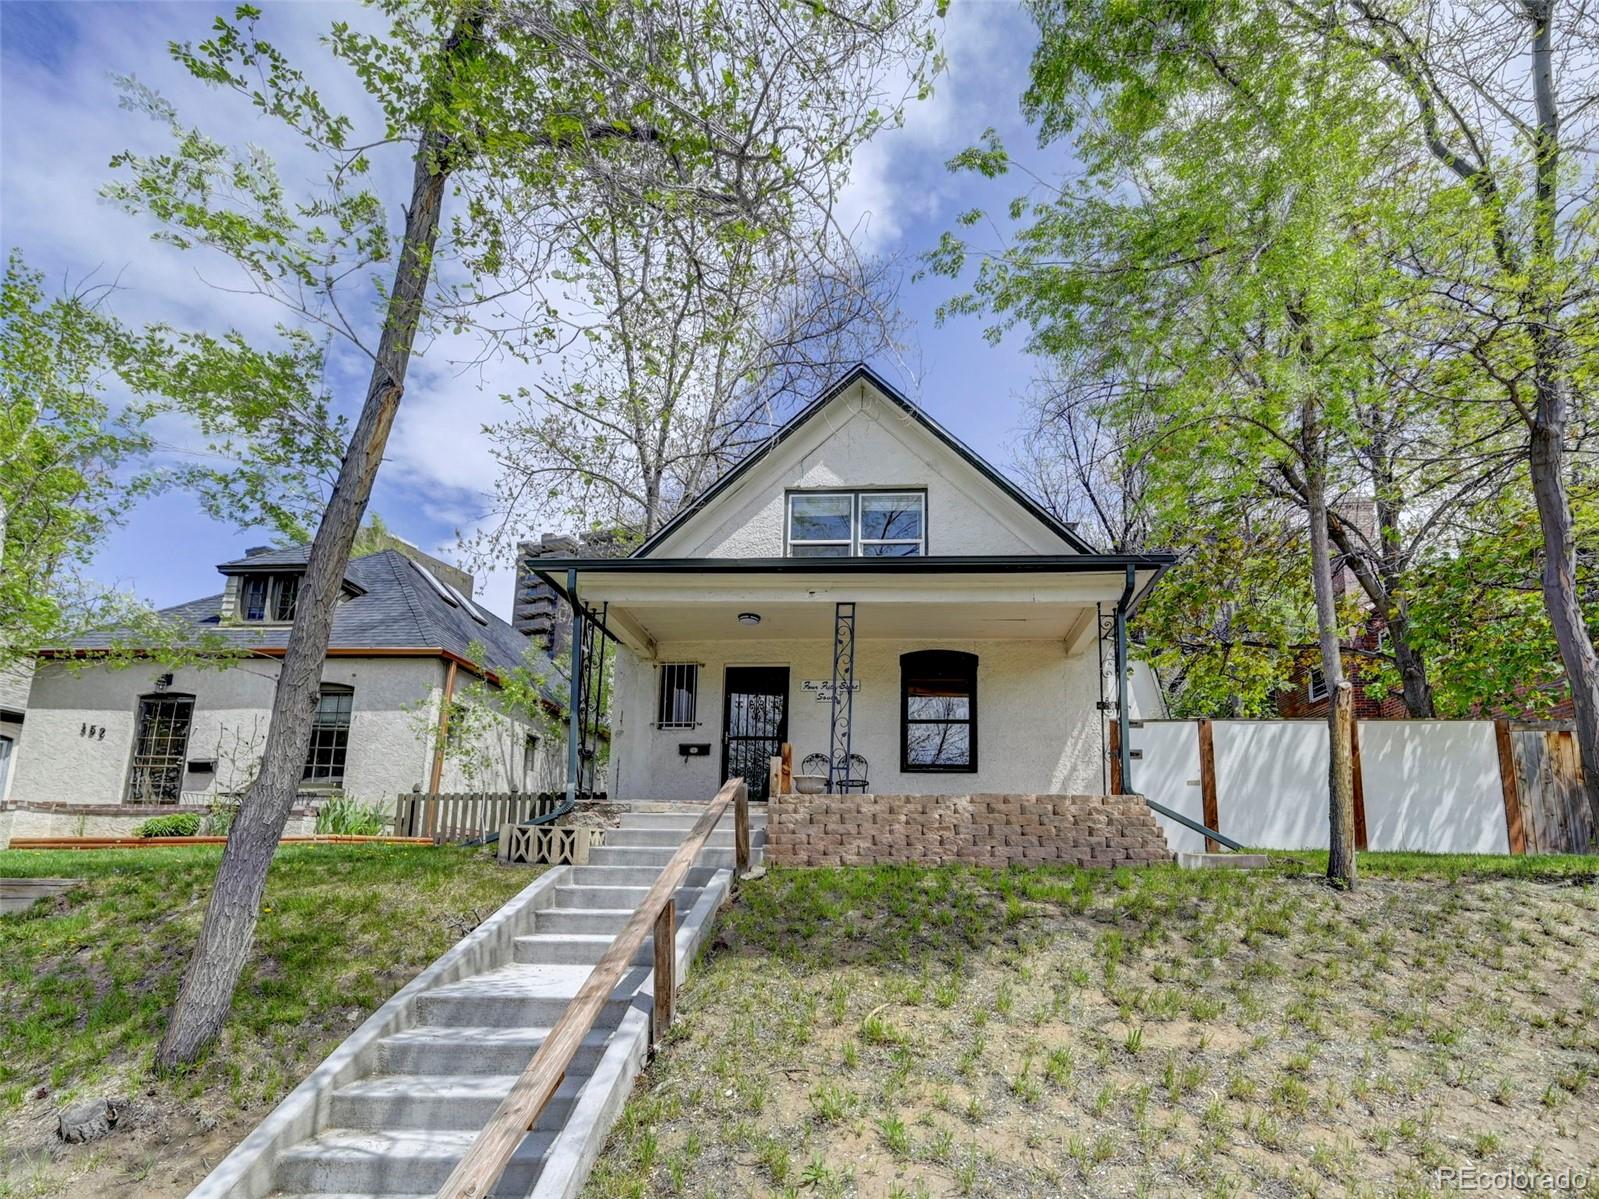
Active
$1,150,000
4
bds
|
3
ba
|
1,986
sqft
|
built
1913
458 S Downing St, Denver, CO 80209
$-3,012
Cash flow
-13.7%
Cash-on-Cash Return
3.1%
Cap rate
0.4%
Rent to Value Ratio
Active
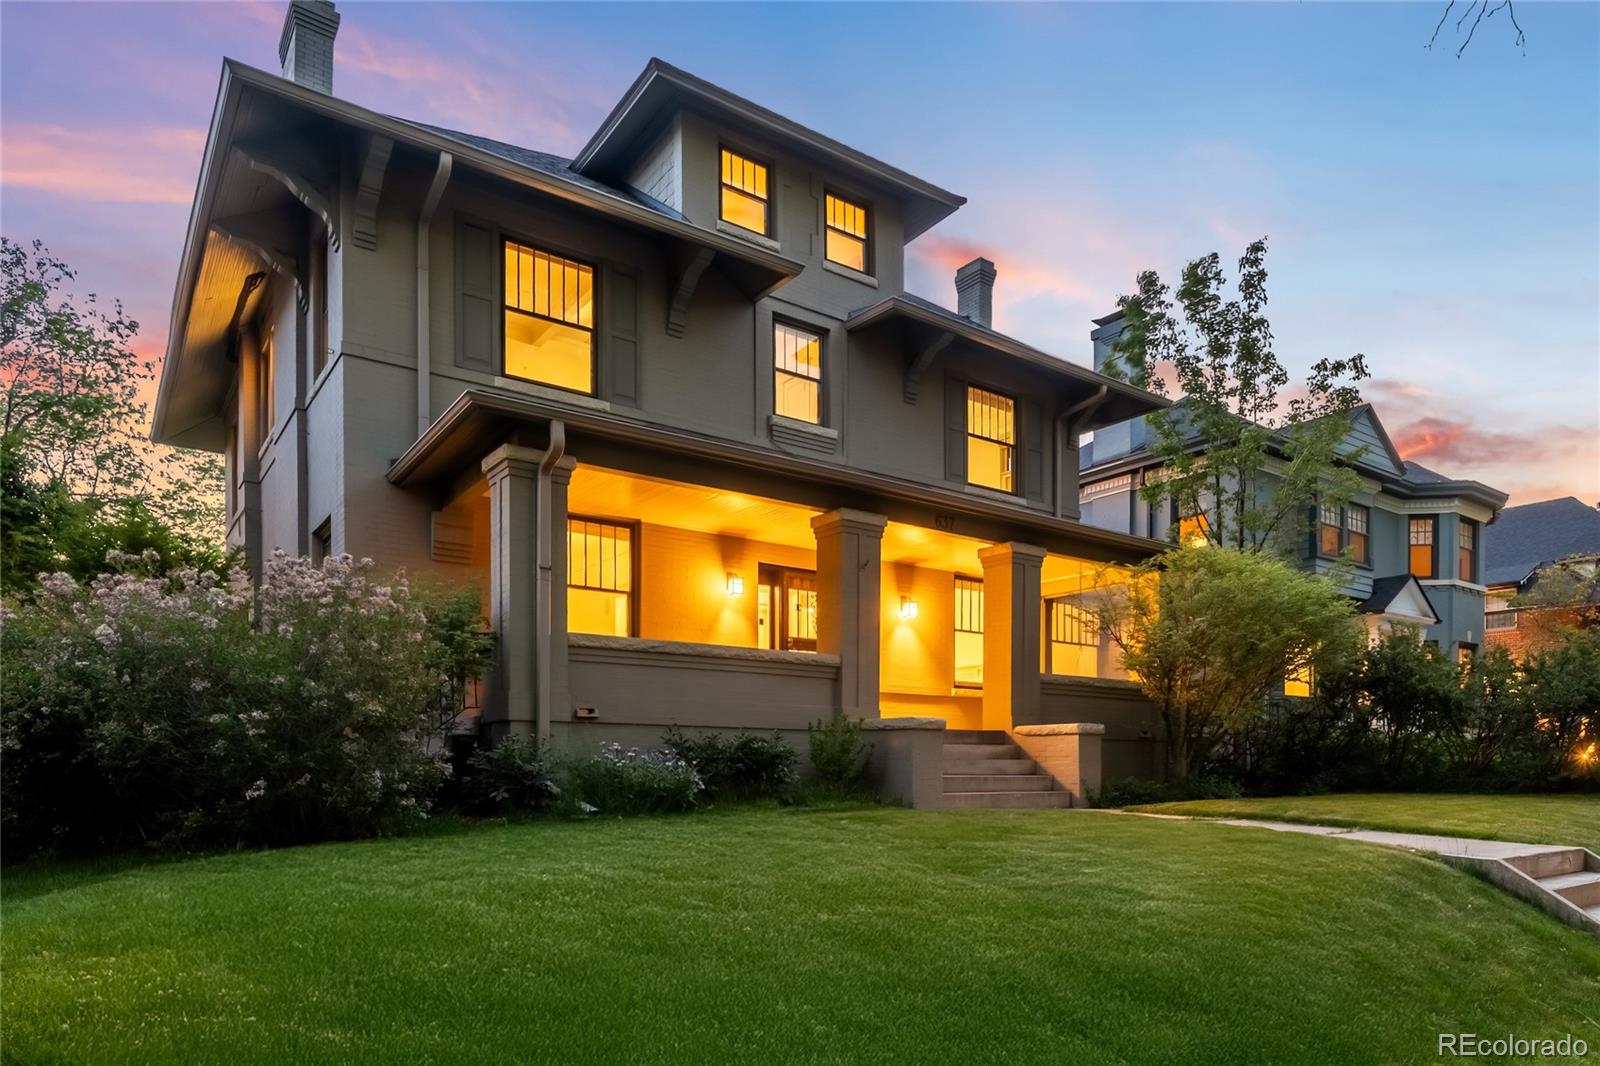
$2,495,000
6
bds
|
5
ba
|
5,193
sqft
|
built
1910
637 N Franklin St, Denver, CO 80218
$-8,853
Cash flow
-18.5%
Cash-on-Cash Return
2.0%
Cap rate
0.3%
Rent to Value Ratio
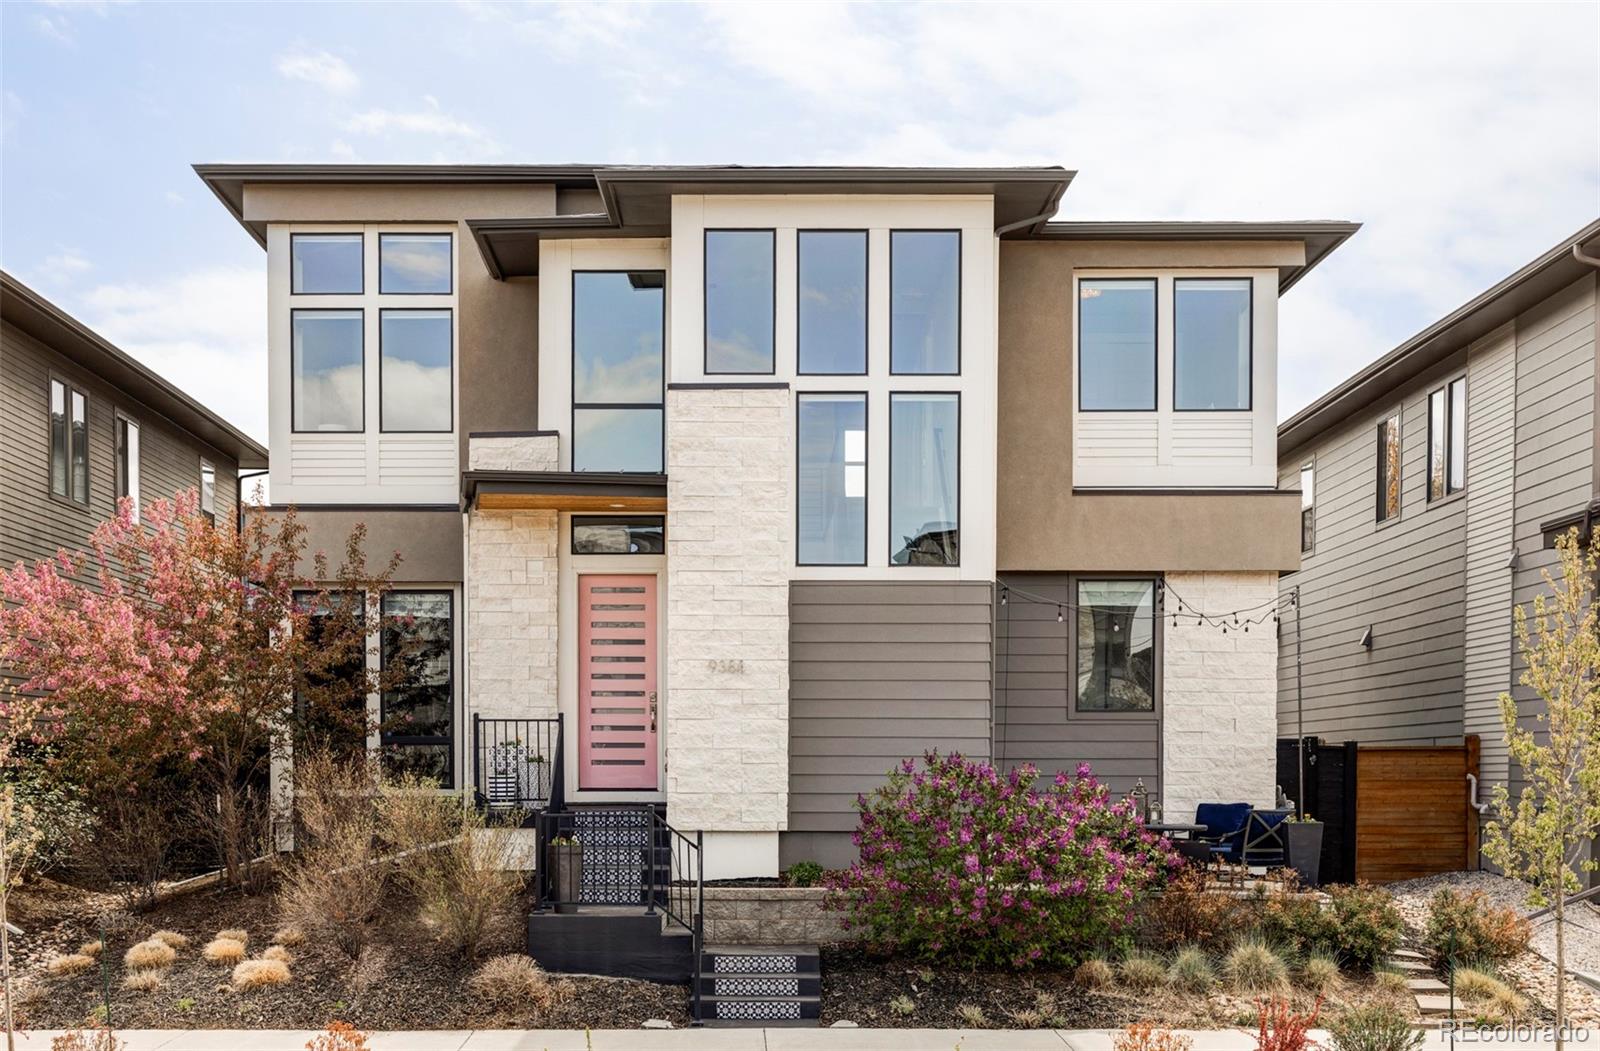
Active
$1,450,000
5
bds
|
5
ba
|
4,447
sqft
|
built
2018
9388 E 59th Pl, Denver, CO 80238
$-5,351
Cash flow
-19.3%
Cash-on-Cash Return
1.9%
Cap rate
0.3%
Rent to Value Ratio
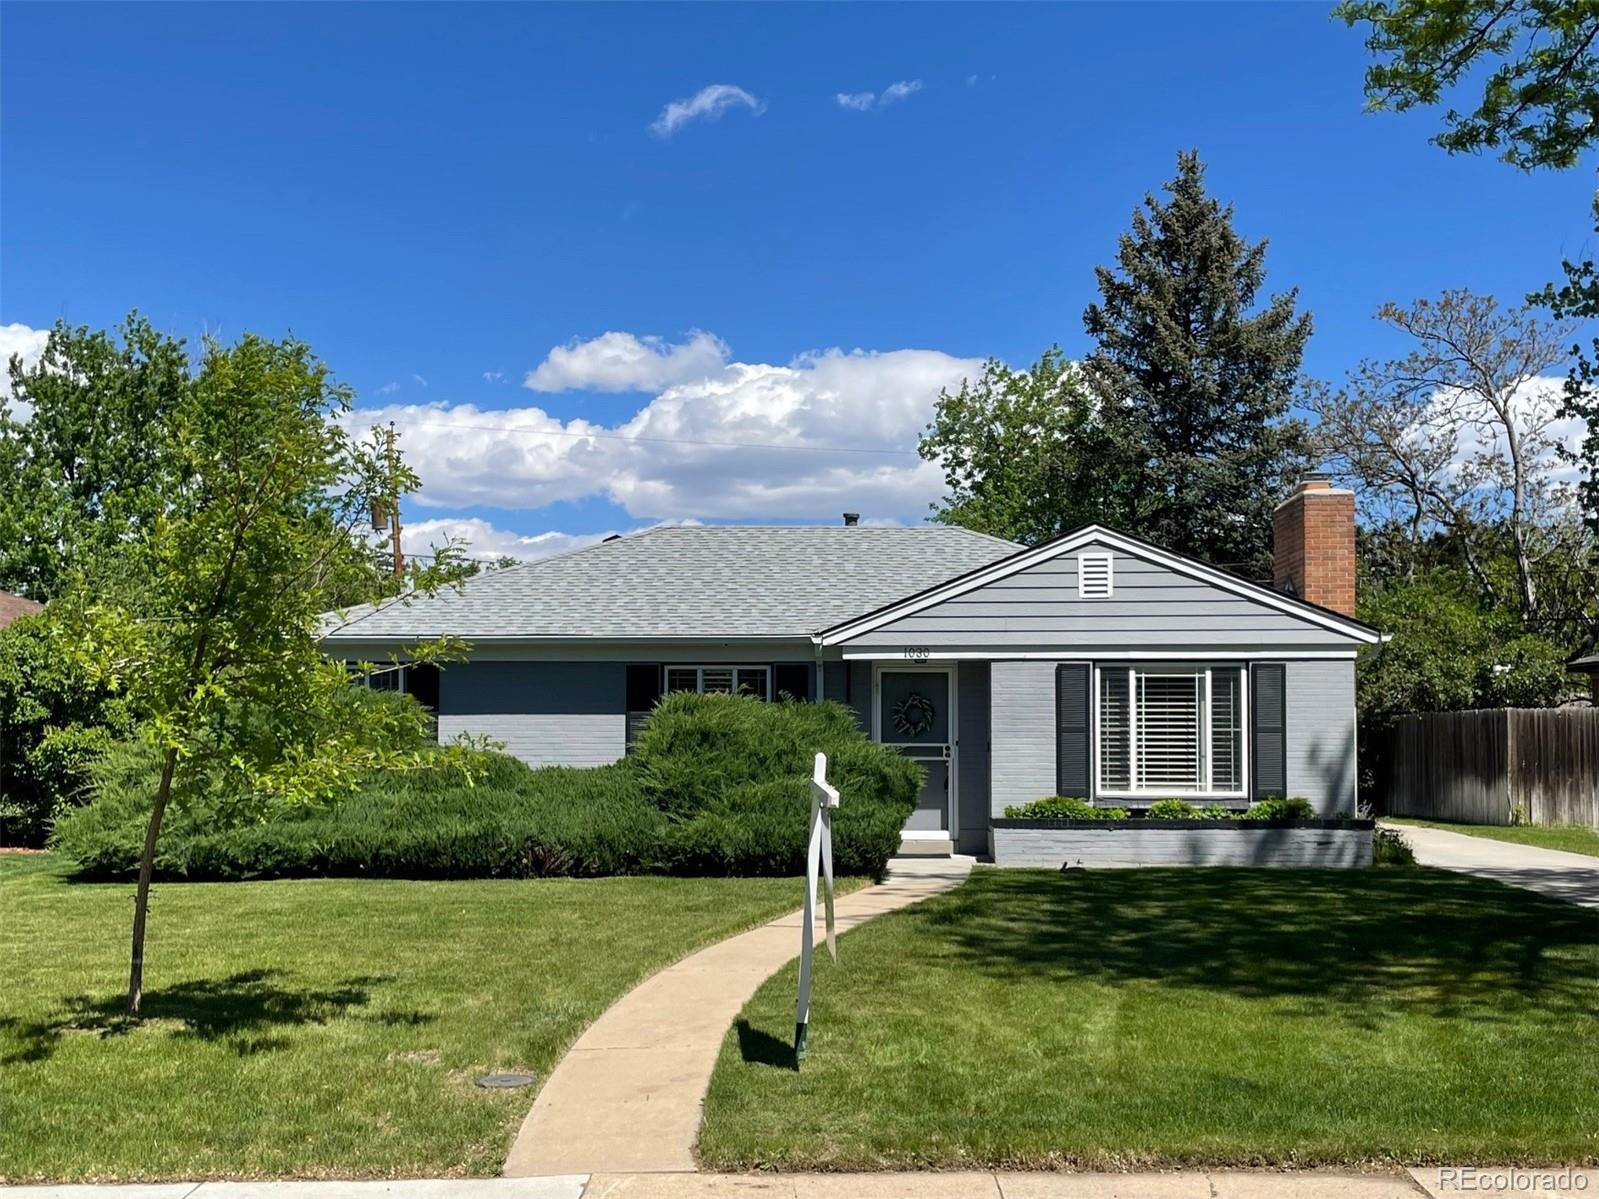
Active
$725,000
3
bds
|
1
ba
|
1,158
sqft
|
built
1951
1030 Krameria St, Denver, CO 80220
$-1,823
Cash flow
-13.1%
Cash-on-Cash Return
3.3%
Cap rate
0.4%
Rent to Value Ratio
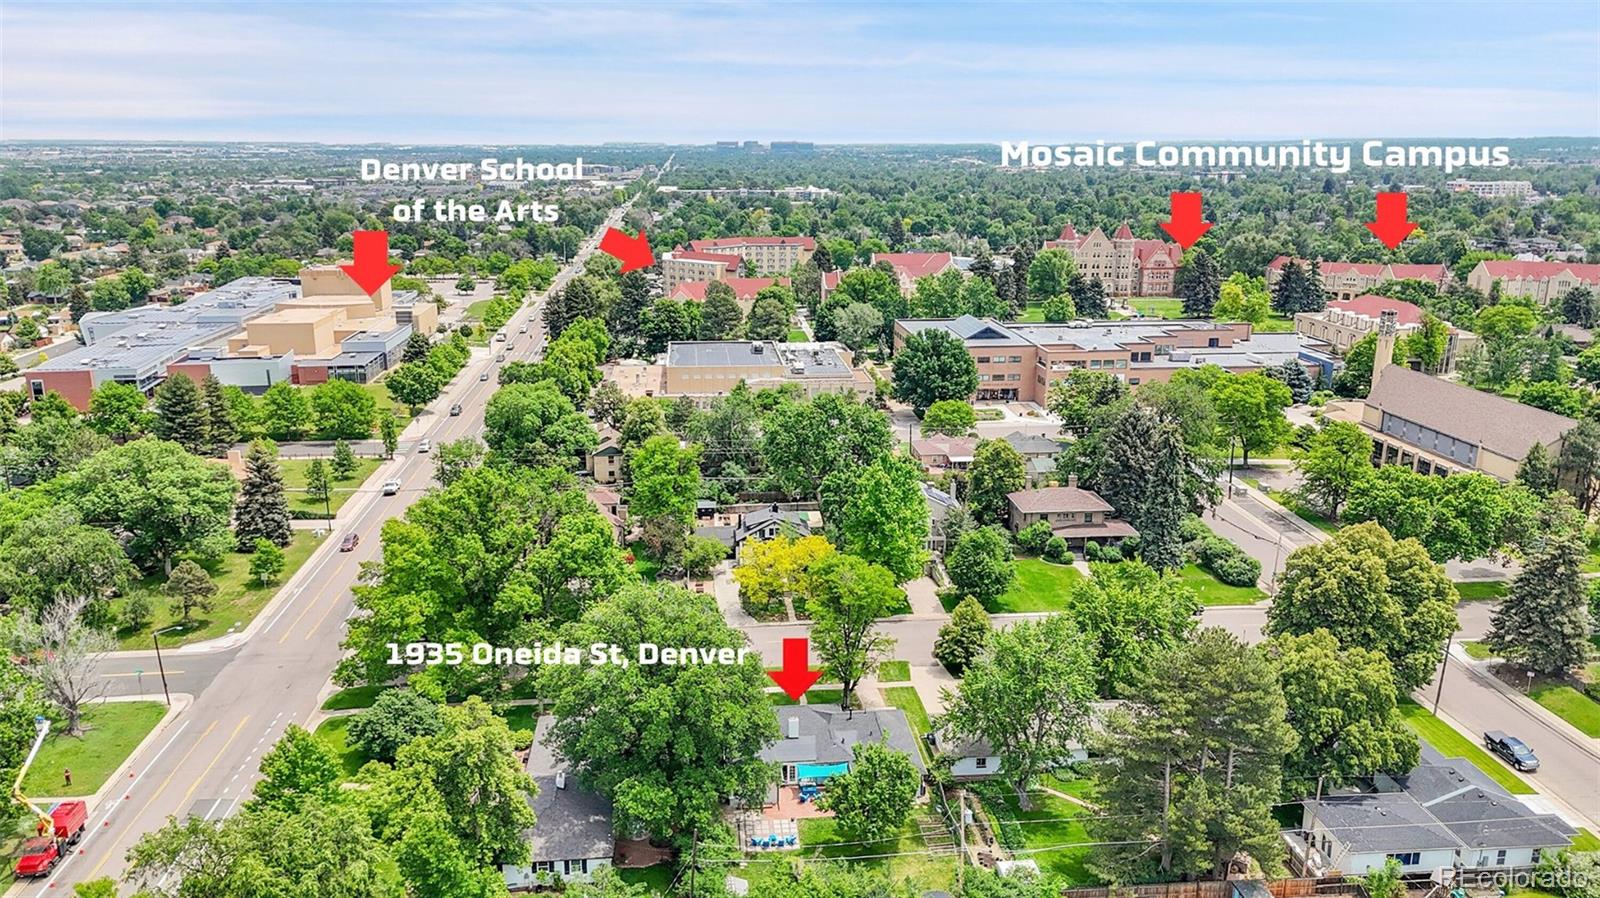
Active
$750,000
4
bds
|
2
ba
|
2,037
sqft
|
built
1947
1935 Oneida St, Denver, CO 80220
$-1,852
Cash flow
-12.9%
Cash-on-Cash Return
3.3%
Cap rate
0.5%
Rent to Value Ratio
Active
$824,000
3
bds
|
4
ba
|
2,041
sqft
|
built
2004
2319 Decatur St, Denver, CO 80211
$-2,267
Cash flow
-14.4%
Cash-on-Cash Return
3.0%
Cap rate
0.5%
Rent to Value Ratio
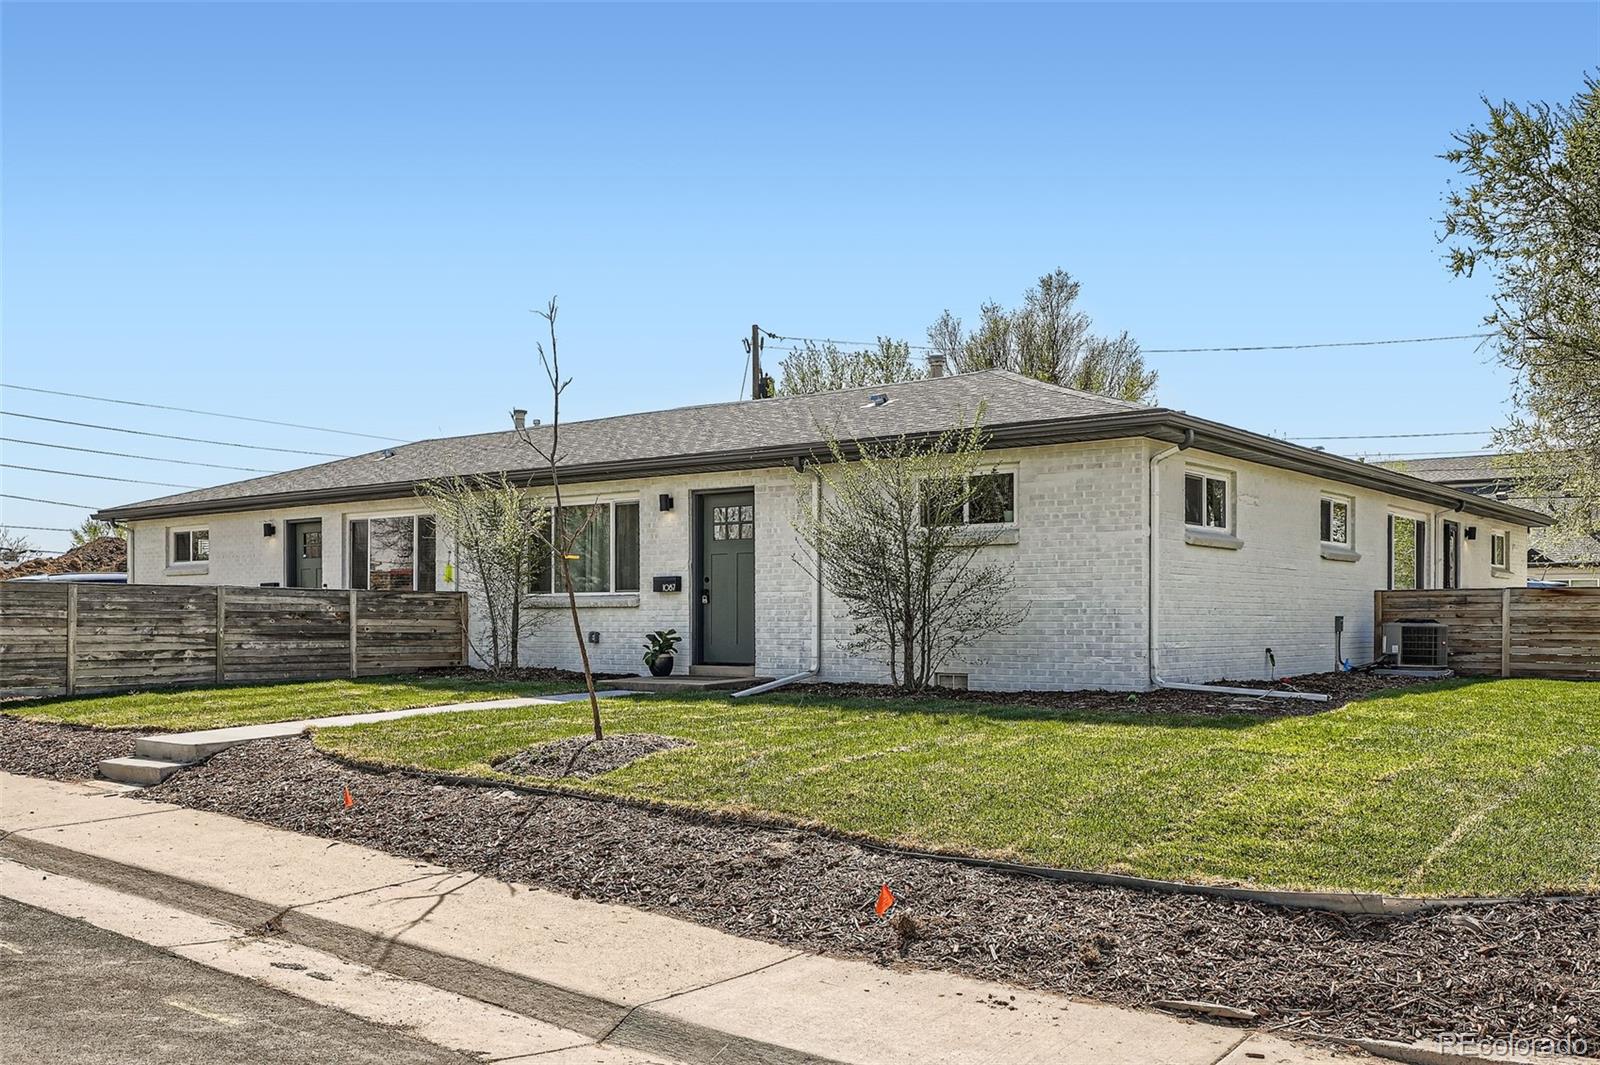
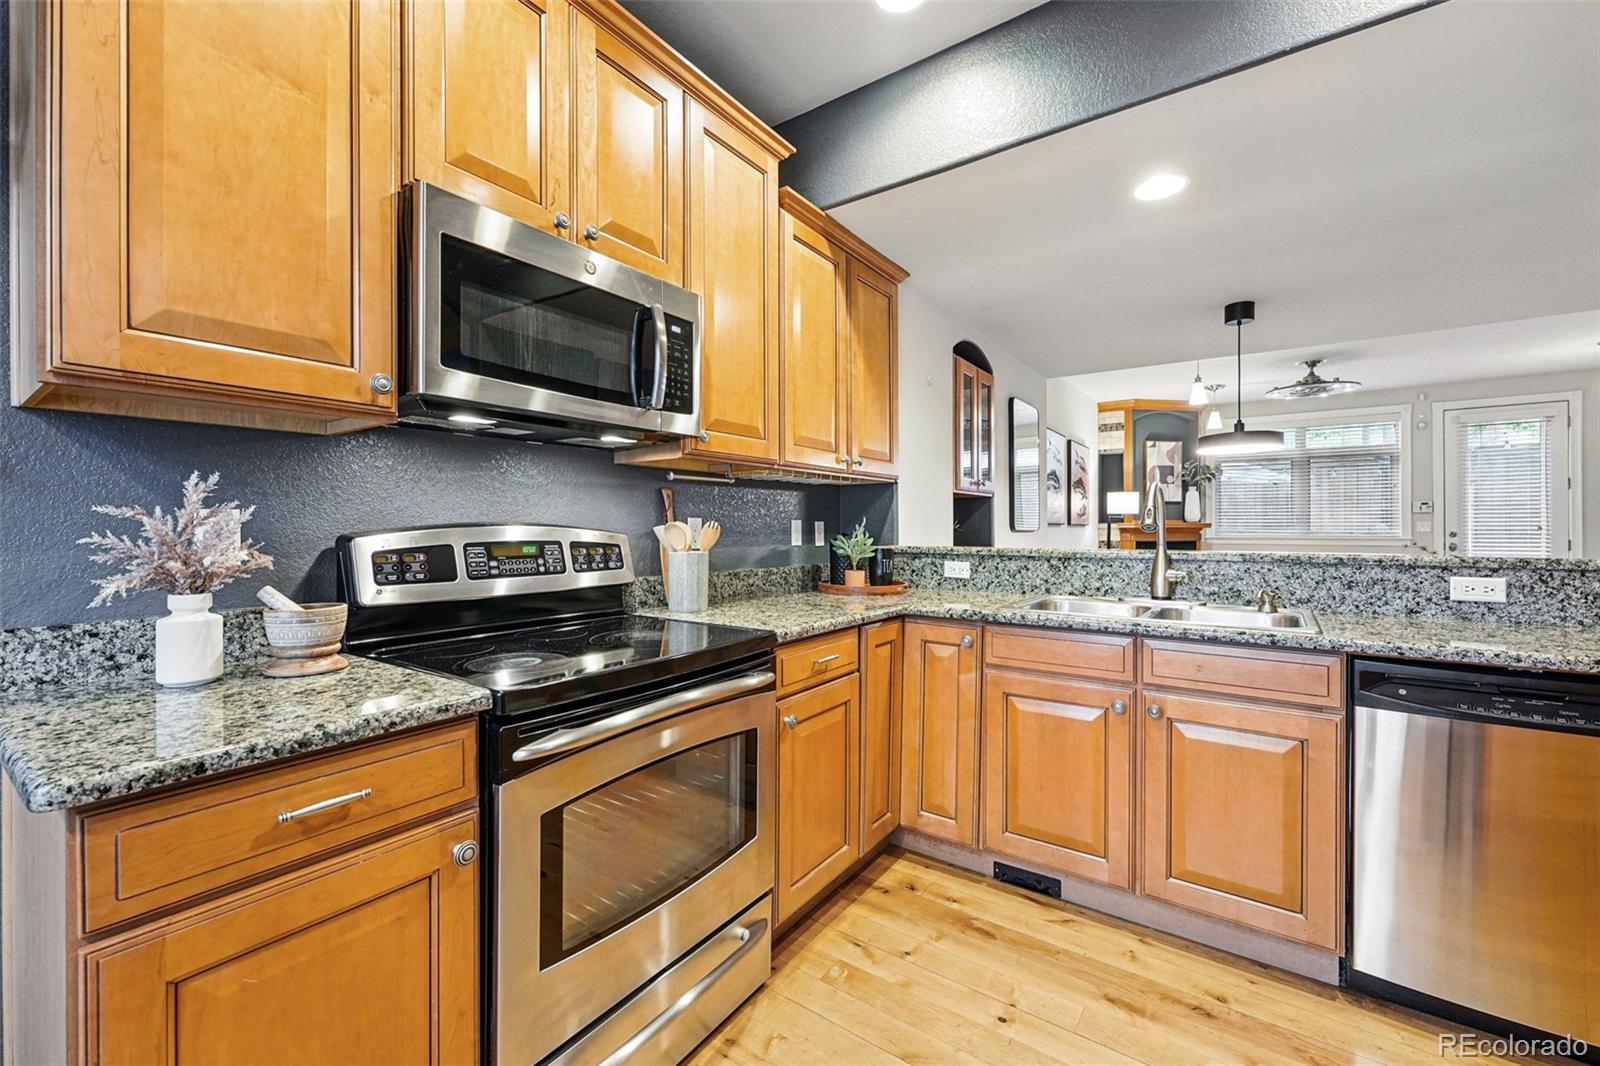
Active
$427,500
2
bds
|
1
ba
|
780
sqft
|
built
1961
1087 Wolff St, Denver, CO 80204
$-751
Cash flow
-9.2%
Cash-on-Cash Return
4.2%
Cap rate
0.6%
Rent to Value Ratio
Active
$355,000
2
bds
|
2
ba
|
1,509
sqft
|
built
1970
2815 S Locust St, Denver, CO 80222
$-723
Cash flow
-10.6%
Cash-on-Cash Return
3.8%
Cap rate
0.7%
Rent to Value Ratio
Active
$340,000
2
bds
|
2
ba
|
1,628
sqft
|
built
1974
7865 E Mississippi Ave, Denver, CO 80247
$-916
Cash flow
-14.1%
Cash-on-Cash Return
3.0%
Cap rate
0.7%
Rent to Value Ratio
Active
$339,900
2
bds
|
1
ba
|
704
sqft
|
built
1953
2621 S Federal Blvd, Denver, CO 80219
$-320
Cash flow
-4.9%
Cash-on-Cash Return
5.2%
Cap rate
0.7%
Rent to Value Ratio
Active
$787,500
2
bds
|
3
ba
|
1,941
sqft
|
built
1981
1350 Lawrence St, Denver, CO 80204
$-3,144
Cash flow
-20.8%
Cash-on-Cash Return
1.5%
Cap rate
0.5%
Rent to Value Ratio

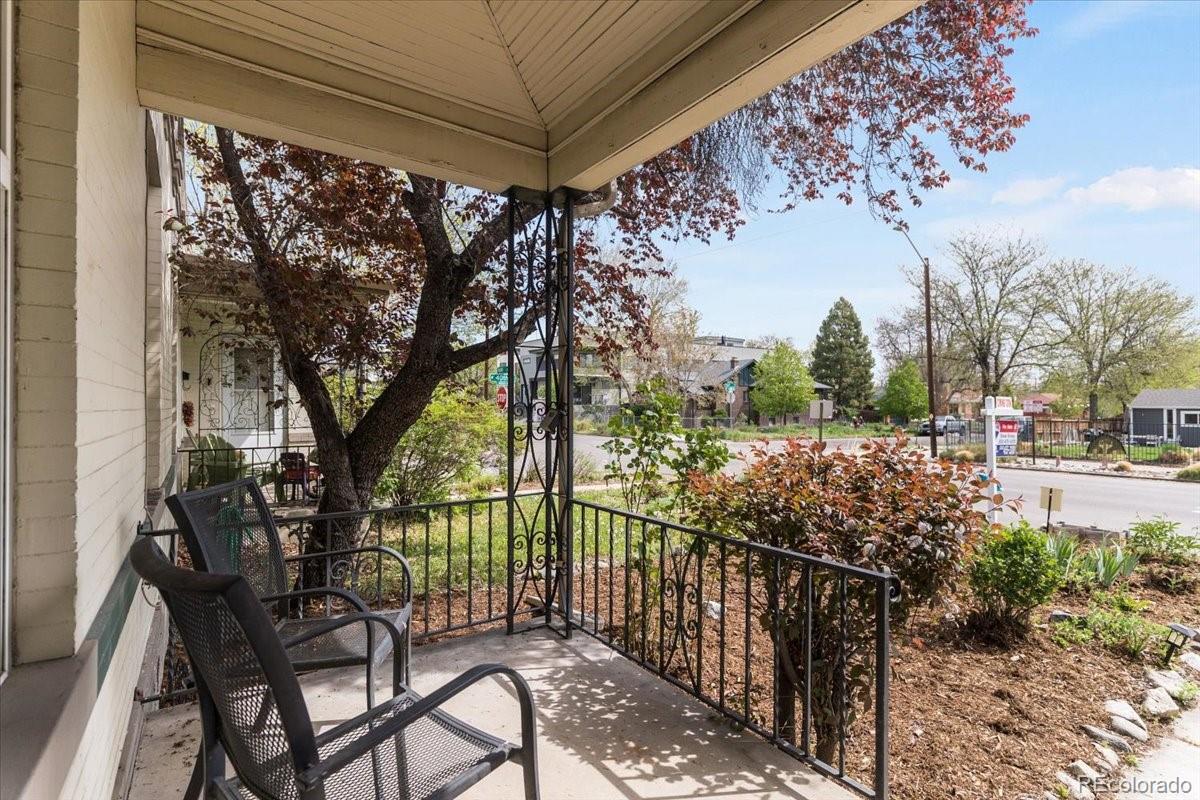
Active
$625,000
2
bds
|
2
ba
|
1,473
sqft
|
built
1896
1143 Auraria Pkwy, Denver, CO 80204
$-1,951
Cash flow
-16.3%
Cash-on-Cash Return
2.5%
Cap rate
0.6%
Rent to Value Ratio
Active
$320,000
3
bds
|
3
ba
|
2,014
sqft
|
built
1973
7755 E Quincy Ave, Denver, CO 80237
$-637
Cash flow
-10.4%
Cash-on-Cash Return
3.9%
Cap rate
0.8%
Rent to Value Ratio

Active
$829,900
5
bds
|
2
ba
|
3,600
sqft
|
built
1954
940 S Geneva St, Aurora, CO 80247
$-2,527
Cash flow
-15.9%
Cash-on-Cash Return
2.6%
Cap rate
0.3%
Rent to Value Ratio

Active
$730,000
3
bds
|
2
ba
|
1,799
sqft
|
built
1942
3532 N Fillmore St, Denver, CO 80205
$-2,494
Cash flow
-17.8%
Cash-on-Cash Return
2.2%
Cap rate
0.3%
Rent to Value Ratio
Active
$635,000
3
bds
|
4
ba
|
1,536
sqft
|
built
2019
1336 Sheridan Blvd, Denver, CO 80214
$-1,433
Cash flow
-11.8%
Cash-on-Cash Return
3.6%
Cap rate
0.5%
Rent to Value Ratio
Active
$535,000
2
bds
|
2
ba
|
1,507
sqft
|
built
1998
837 E 17th Ave, Denver, CO 80218
$-1,343
Cash flow
-13.1%
Cash-on-Cash Return
3.3%
Cap rate
0.6%
Rent to Value Ratio
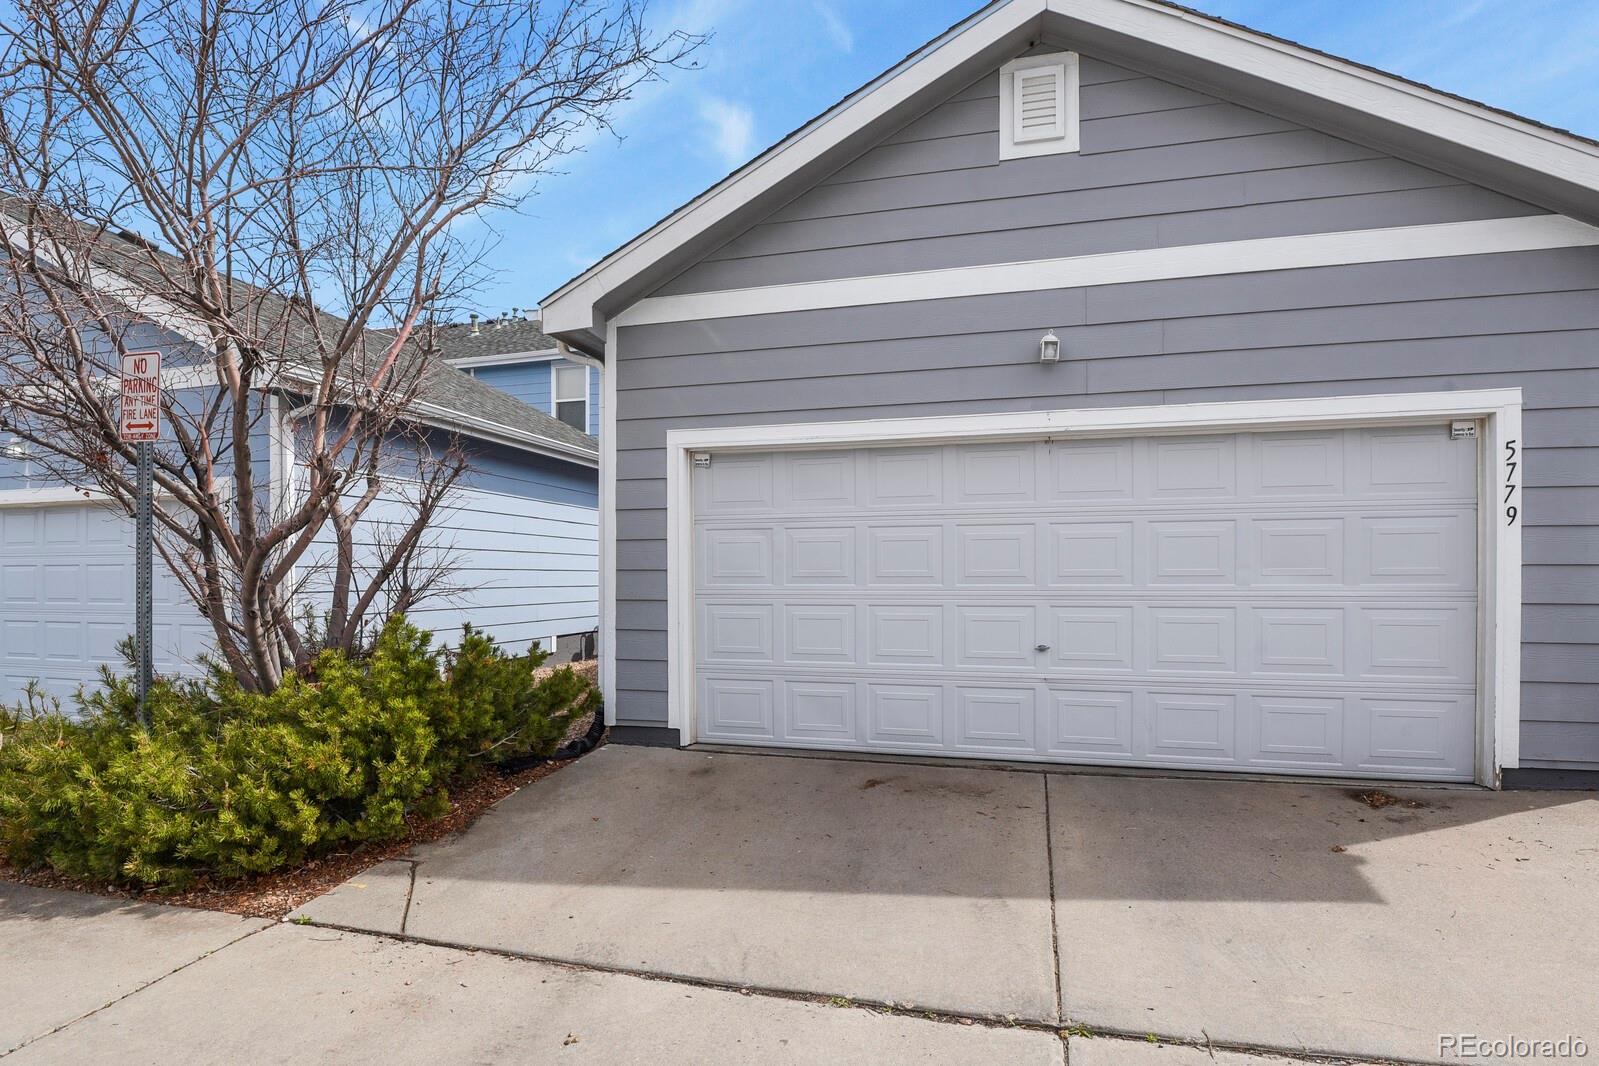
Active
$399,000
3
bds
|
3
ba
|
1,716
sqft
|
built
2005
5779 Ceylon St, Denver, CO 80249
$-802
Cash flow
-10.5%
Cash-on-Cash Return
3.9%
Cap rate
0.6%
Rent to Value Ratio
Active
$215,000
1
bds
|
1
ba
|
560
sqft
|
built
1961
1045 N Clarkson St, Denver, CO 80218
$-366
Cash flow
-8.9%
Cash-on-Cash Return
4.2%
Cap rate
0.8%
Rent to Value Ratio
Active
$220,000
1
bds
|
1
ba
|
714
sqft
|
built
1978
3141 S Tamarac Dr, Denver, CO 80231
$-471
Cash flow
-11.2%
Cash-on-Cash Return
3.7%
Cap rate
0.7%
Rent to Value Ratio
Active
$550,000
1
bds
|
1
ba
|
963
sqft
|
built
2000
2500 E Cherry Creek South Dr, Denver, CO 80209
$-1,765
Cash flow
-16.7%
Cash-on-Cash Return
2.4%
Cap rate
0.5%
Rent to Value Ratio
Active
$444,000
3
bds
|
1
ba
|
836
sqft
|
built
1954
4507 W 2nd Ave, Denver, CO 80219
$-817
Cash flow
-9.6%
Cash-on-Cash Return
4.1%
Cap rate
0.5%
Rent to Value Ratio

Active
$1,039,000
3
bds
|
4
ba
|
2,317
sqft
|
built
2016
4390 Osage St, Denver, CO 80211
$-2,124
Cash flow
-10.7%
Cash-on-Cash Return
3.8%
Cap rate
0.5%
Rent to Value Ratio
Active
$375,000
2
bds
|
1
ba
|
1,119
sqft
|
built
1903
1555 California St, Denver, CO 80202
$-1,375
Cash flow
-19.1%
Cash-on-Cash Return
1.9%
Cap rate
0.7%
Rent to Value Ratio
Active
$255,999
2
bds
|
1
ba
|
808
sqft
|
built
2001
15475 Andrews Dr, Denver, CO 80239
$-615
Cash flow
-12.5%
Cash-on-Cash Return
3.4%
Cap rate
0.7%
Rent to Value Ratio
Active
$720,000
1
bds
|
2
ba
|
1,002
sqft
|
built
2021
4200 W 17th Ave, Denver, CO 80204
$-2,602
Cash flow
-18.9%
Cash-on-Cash Return
1.9%
Cap rate
0.5%
Rent to Value Ratio

Active
$475,000
2
bds
|
1
ba
|
804
sqft
|
built
1910
1000 N Ogden St, Denver, CO 80218
$-1,389
Cash flow
-15.3%
Cash-on-Cash Return
2.8%
Cap rate
0.5%
Rent to Value Ratio
Active
$286,000
2
bds
|
2
ba
|
948
sqft
|
built
1980
8335 Fairmount Dr, Denver, CO 80247
$-702
Cash flow
-12.8%
Cash-on-Cash Return
3.3%
Cap rate
0.7%
Rent to Value Ratio

Active
$490,000
2
bds
|
2
ba
|
1,080
sqft
|
built
1974
2 Adams St, Denver, CO 80206
$-1,690
Cash flow
-18.0%
Cash-on-Cash Return
2.1%
Cap rate
0.5%
Rent to Value Ratio
Active
$499,000
3
bds
|
0
ba
|
1,328
sqft
|
built
1945
1245 Leyden St, Denver, CO 80220
$-1,008
Cash flow
-10.5%
Cash-on-Cash Return
3.9%
Cap rate
0.6%
Rent to Value Ratio
Active
$219,000
bds
|
1
ba
|
354
sqft
|
built
1965
909 N Logan St, Denver, CO 80203
$-552
Cash flow
-13.2%
Cash-on-Cash Return
3.3%
Cap rate
0.6%
Rent to Value Ratio
Active
$449,900
1
bds
|
1
ba
|
964
sqft
|
built
2006
2460 W 29th Ave, Denver, CO 80211
$-1,310
Cash flow
-15.2%
Cash-on-Cash Return
2.8%
Cap rate
0.6%
Rent to Value Ratio
Active
$669,500
2
bds
|
3
ba
|
1,478
sqft
|
built
2016
2426 Welton St, Denver, CO 80205
$-1,779
Cash flow
-13.9%
Cash-on-Cash Return
3.1%
Cap rate
0.5%
Rent to Value Ratio