Coral Gables, FL Investment Properties for Sale
Browse homes for sale and investment properties in Coral Gables, FL. Refine your search by price, property type, or more.
Best cash flowing properties in Coral Gables, FL

Active
$214,000
bds
|
1
ba
|
420
sqft
|
built
1963
700 Biltmore Way, Coral Gables, FL 33134
$-580
Cash flow
-14.1%
Cash-on-Cash Return
2.9%
Cap rate
0.9%
Rent to Value Ratio
Active
$950,000
4
bds
|
3
ba
|
1,204
sqft
|
built
1946
4861 SW 5th St, Coral Gables, FL 33134
$-760
Cash flow
-4.2%
Cash-on-Cash Return
5.2%
Cap rate
0.7%
Rent to Value Ratio
334 out of 350 properties for sale in Coral Gables, FL
Limited Results Shown
Create a free account, or log in to reveal all property listings and enjoy the complete experience.

Active
$2,695,000
3
bds
|
4
ba
|
2,537
sqft
|
built
1952
537 Marmore Ave, Coral Gables, FL 33146
$-9,025
Cash flow
-17.5%
Cash-on-Cash Return
2.1%
Cap rate
0.3%
Rent to Value Ratio
Active
$349,900
1
bds
|
1
ba
|
760
sqft
|
built
1963
700 Biltmore Way, Coral Gables, FL 33134
$-1,440
Cash flow
-21.5%
Cash-on-Cash Return
1.2%
Cap rate
0.8%
Rent to Value Ratio

Active
$485,000
2
bds
|
2
ba
|
1,113
sqft
|
built
2003
3000 Coral Way, Coral Gables, FL 33145
$-1,828
Cash flow
-19.7%
Cash-on-Cash Return
1.6%
Cap rate
0.7%
Rent to Value Ratio

Active
$1,450,000
3
bds
|
3
ba
|
2,160
sqft
|
built
2000
13627 Deering Bay Dr, Coral Gables, FL 33158
$-3,697
Cash flow
-13.3%
Cash-on-Cash Return
3.1%
Cap rate
0.5%
Rent to Value Ratio

Active
$3,199,999
5
bds
|
6
ba
|
3,996
sqft
|
built
2025
4231 SW 11th St, Coral Gables, FL 33134
$-14,860
Cash flow
-24.2%
Cash-on-Cash Return
0.6%
Cap rate
0.1%
Rent to Value Ratio
Active
$975,000
3
bds
|
2
ba
|
1,395
sqft
|
built
1971
1240 La Mancha Ave, Coral Gables, FL 33134
$-2,207
Cash flow
-11.8%
Cash-on-Cash Return
3.4%
Cap rate
0.5%
Rent to Value Ratio
Active
$1,680,000
3
bds
|
2
ba
|
2,056
sqft
|
built
1952
5620 Alhambra Cir, Coral Gables, FL 33146
$-4,827
Cash flow
-15.0%
Cash-on-Cash Return
2.7%
Cap rate
0.4%
Rent to Value Ratio

Active
$1,099,000
2
bds
|
3
ba
|
1,090
sqft
|
built
1979
725 Biltmore Ct, Coral Gables, FL 33134
$-3,447
Cash flow
-16.4%
Cash-on-Cash Return
2.4%
Cap rate
0.4%
Rent to Value Ratio
Active
$2,000,000
4
bds
|
3
ba
|
1,869
sqft
|
built
1926
447 Giralda Ave, Coral Gables, FL 33134
$-6,123
Cash flow
-16.0%
Cash-on-Cash Return
2.5%
Cap rate
0.4%
Rent to Value Ratio

Active
$695,000
2
bds
|
2
ba
|
1,066
sqft
|
built
2008
4100 Salzedo St, Coral Gables, FL 33146
$-2,402
Cash flow
-18.0%
Cash-on-Cash Return
2.0%
Cap rate
0.6%
Rent to Value Ratio

Active
$10,500,000
6
bds
|
8
ba
|
5,077
sqft
|
built
2025
3883 Wood Ave, Coral Gables, FL 33133
$-52,716
Cash flow
-26.2%
Cash-on-Cash Return
0.1%
Cap rate
0.1%
Rent to Value Ratio
Active
$1,975,000
3
bds
|
2
ba
|
2,291
sqft
|
built
1953
1136 Placetas Ave, Coral Gables, FL 33146
$-6,691
Cash flow
-17.7%
Cash-on-Cash Return
2.1%
Cap rate
0.3%
Rent to Value Ratio
Active
$623,900
2
bds
|
2
ba
|
970
sqft
|
built
2008
4100 Salzedo St, Coral Gables, FL 33146
$-2,492
Cash flow
-20.8%
Cash-on-Cash Return
1.4%
Cap rate
0.6%
Rent to Value Ratio

Active
$735,000
2
bds
|
3
ba
|
1,171
sqft
|
built
2009
1300 Ponce De Leon Blvd, Coral Gables, FL 33134
$-2,865
Cash flow
-20.3%
Cash-on-Cash Return
1.5%
Cap rate
0.6%
Rent to Value Ratio
Active
$3,400,000
3
bds
|
4
ba
|
3,048
sqft
|
built
1939
2224 Segovia Cir, Coral Gables, FL 33134
$-13,596
Cash flow
-20.9%
Cash-on-Cash Return
1.3%
Cap rate
0.2%
Rent to Value Ratio

Active
$520,000
2
bds
|
2
ba
|
1,477
sqft
|
built
2002
1650 Coral Way, Coral Gables, FL 33145
$-1,866
Cash flow
-18.7%
Cash-on-Cash Return
1.8%
Cap rate
0.7%
Rent to Value Ratio
Active
$690,000
2
bds
|
2
ba
|
1,181
sqft
|
built
2008
1607 Ponce De Leon Blvd, Coral Gables, FL 33134
$-2,901
Cash flow
-21.9%
Cash-on-Cash Return
1.1%
Cap rate
0.6%
Rent to Value Ratio
Active
$375,000
1
bds
|
2
ba
|
910
sqft
|
built
1969
90 Edgewater Dr, Coral Gables, FL 33133
$-1,687
Cash flow
-23.5%
Cash-on-Cash Return
0.7%
Cap rate
0.7%
Rent to Value Ratio
Active
$1,900,000
4
bds
|
2
ba
|
1,537
sqft
|
built
1940
421 Zamora Ave, Coral Gables, FL 33134
$-5,530
Cash flow
-15.2%
Cash-on-Cash Return
2.7%
Cap rate
0.4%
Rent to Value Ratio

Active
$370,000
1
bds
|
1
ba
|
816
sqft
|
built
2003
3000 Coral Way, Coral Gables, FL 33145
$-1,414
Cash flow
-19.9%
Cash-on-Cash Return
1.6%
Cap rate
0.7%
Rent to Value Ratio

Active
$4,295,000
4
bds
|
0
ba
|
2,110
sqft
|
built
1953
3621 Ponce De Leon Blvd, Coral Gables, FL 33134
$-21,727
Cash flow
-26.4%
Cash-on-Cash Return
0.1%
Cap rate
0.1%
Rent to Value Ratio
Active
$3,650,000
5
bds
|
5
ba
|
3,703
sqft
|
built
1997
7250 SW 47th Ave, Coral Gables, FL 33143
$-13,193
Cash flow
-18.9%
Cash-on-Cash Return
1.8%
Cap rate
0.3%
Rent to Value Ratio

Active
$1,625,000
3
bds
|
4
ba
|
2,980
sqft
|
built
1995
13637 Deering Bay Dr, Coral Gables, FL 33158
$-4,122
Cash flow
-13.2%
Cash-on-Cash Return
3.1%
Cap rate
0.5%
Rent to Value Ratio
Active
$7,950,000
5
bds
|
5
ba
|
4,809
sqft
|
built
1979
1051 San Pedro Ave, Coral Gables, FL 33156
$-40,847
Cash flow
-26.8%
Cash-on-Cash Return
0.0%
Cap rate
0.1%
Rent to Value Ratio
Active
$7,950,000
5
bds
|
7
ba
|
5,176
sqft
|
built
1983
7120 Mira Flores Ave, Coral Gables, FL 33143
$-39,837
Cash flow
-26.1%
Cash-on-Cash Return
0.1%
Cap rate
0.1%
Rent to Value Ratio
Active
$7,995,000
6
bds
|
8
ba
|
4,662
sqft
|
built
2013
7710 SW 47th Ave, Coral Gables, FL 33143
$-38,420
Cash flow
-25.1%
Cash-on-Cash Return
0.4%
Cap rate
0.1%
Rent to Value Ratio
Active
$1,845,000
3
bds
|
3
ba
|
2,615
sqft
|
built
2012
622 Malaga Ave, Coral Gables, FL 33134
$-4,149
Cash flow
-11.7%
Cash-on-Cash Return
3.4%
Cap rate
0.5%
Rent to Value Ratio

Active
$17,999,888
8
bds
|
11
ba
|
8,360
sqft
|
built
2007
9320 Gallardo St, Coral Gables, FL 33156
$-101,391
Cash flow
-29.4%
Cash-on-Cash Return
-0.6%
Cap rate
0.1%
Rent to Value Ratio

Active
$619,900
2
bds
|
2
ba
|
1,369
sqft
|
built
1969
625 Biltmore Way, Coral Gables, FL 33134
$-3,116
Cash flow
-26.2%
Cash-on-Cash Return
0.1%
Cap rate
0.6%
Rent to Value Ratio

Active
$1,655,000
3
bds
|
2
ba
|
1,492
sqft
|
built
1952
1526 Dorado Ave, Coral Gables, FL 33146
$-4,036
Cash flow
-12.7%
Cash-on-Cash Return
3.2%
Cap rate
0.5%
Rent to Value Ratio
Active
$408,000
2
bds
|
1
ba
|
1,013
sqft
|
built
2002
50 Menores Ave, Coral Gables, FL 33134
$-1,527
Cash flow
-19.5%
Cash-on-Cash Return
1.7%
Cap rate
0.7%
Rent to Value Ratio

Active
$450,000
1
bds
|
1
ba
|
697
sqft
|
built
2008
1805 Ponce De Leon Blvd, Coral Gables, FL 33134
$-1,388
Cash flow
-16.1%
Cash-on-Cash Return
2.4%
Cap rate
0.6%
Rent to Value Ratio
Active
$1,650,000
3
bds
|
2
ba
|
2,277
sqft
|
built
1925
1103 Genoa St, Coral Gables, FL 33134
$-4,956
Cash flow
-15.7%
Cash-on-Cash Return
2.5%
Cap rate
0.3%
Rent to Value Ratio

Active
$364,999
2
bds
|
2
ba
|
970
sqft
|
built
2006
5271 SW 8th St, Coral Gables, FL 33134
$-1,066
Cash flow
-15.2%
Cash-on-Cash Return
2.6%
Cap rate
0.7%
Rent to Value Ratio

Active
$2,348,000
3
bds
|
2
ba
|
1,996
sqft
|
built
1966
6809 Mentone St, Coral Gables, FL 33146
$-7,622
Cash flow
-16.9%
Cash-on-Cash Return
2.3%
Cap rate
0.3%
Rent to Value Ratio

Active
$3,250,000
4
bds
|
5
ba
|
3,566
sqft
|
built
2017
1415 Madrid St, Coral Gables, FL 33134
$-10,617
Cash flow
-17.0%
Cash-on-Cash Return
2.2%
Cap rate
0.3%
Rent to Value Ratio
Active
$535,000
2
bds
|
2
ba
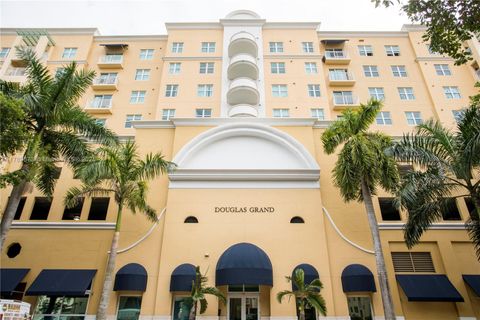
|
1,152
sqft
|
built
2007
888 S Douglas Rd, Coral Gables, FL 33134
$-2,381
Cash flow
-23.2%
Cash-on-Cash Return
0.8%
Cap rate
0.7%
Rent to Value Ratio

Active
$9,995,000
5
bds
|
4
ba
|
3,762
sqft
|
built
1961
9000 School House Rd, Coral Gables, FL 33156
$-54,150
Cash flow
-28.3%
Cash-on-Cash Return
-0.4%
Cap rate
0.1%
Rent to Value Ratio