Coral Springs, FL Investment Properties for Sale
Browse homes for sale and investment properties in Coral Springs, FL. Refine your search by price, property type, or more.
Best cash flowing properties in Coral Springs, FL
Active
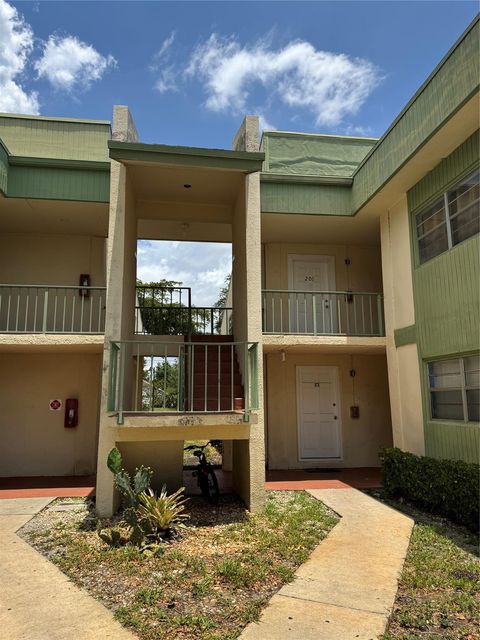
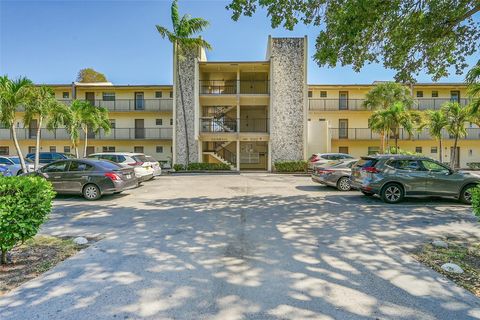
$129,999
1
bds
|
1
ba
|
610
sqft
|
built
1974
4116 NW 88th Ave, Coral Springs, FL 33065
$20
Cash flow
0.8%
Cash-on-Cash Return
6.3%
Cap rate
1.2%
Rent to Value Ratio
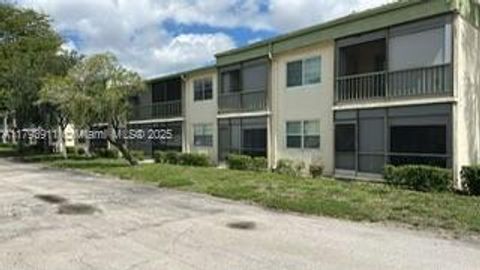
Active
$135,000
1
bds
|
2
ba
|
690
sqft
|
built
1979
4159 NW 90th Ave, Coral Springs, FL 33065
$15
Cash flow
0.6%
Cash-on-Cash Return
6.3%
Cap rate
1.2%
Rent to Value Ratio
614 out of 718 properties for sale in Coral Springs, FL
Limited Results Shown
Create a free account, or log in to reveal all property listings and enjoy the complete experience.

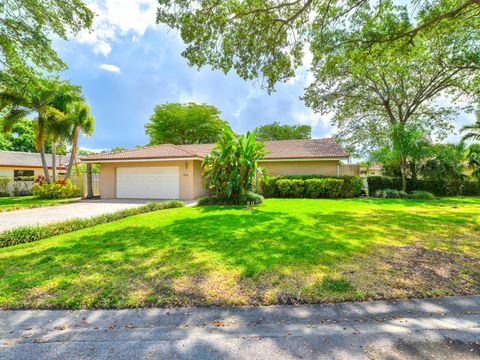
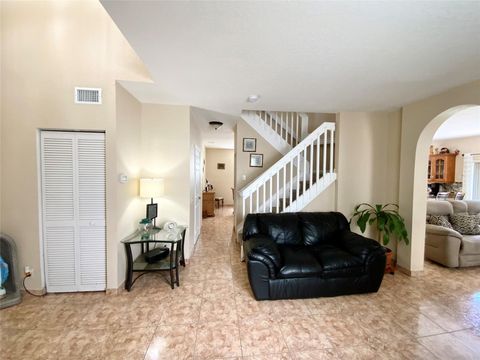
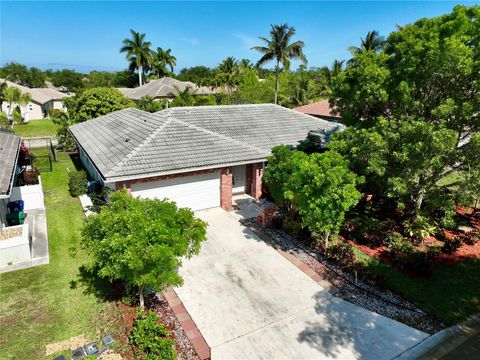
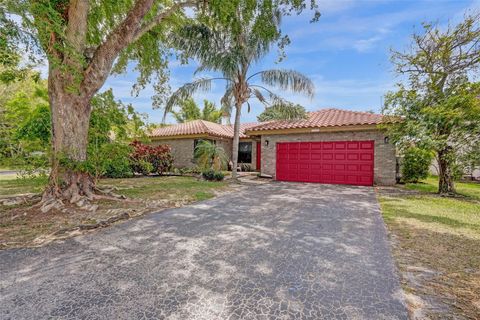
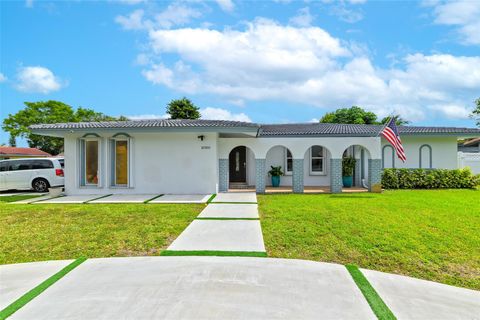
Active
$749,999
4
bds
|
2
ba
|
1,836
sqft
|
built
1976
1350 NW 84th Dr, Coral Springs, FL 33071
$-2,053
Cash flow
-14.3%
Cash-on-Cash Return
2.9%
Cap rate
0.4%
Rent to Value Ratio

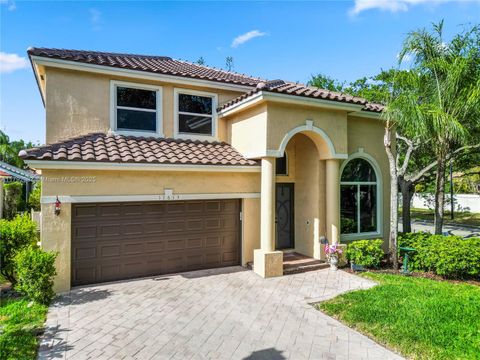
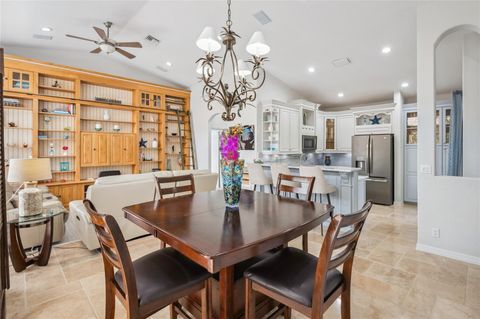
Active
$974,000
5
bds
|
4
ba
|
2,767
sqft
|
built
1997
512 NW 120th Dr, Coral Springs, FL 33071
$-1,443
Cash flow
-7.7%
Cash-on-Cash Return
4.4%
Cap rate
0.7%
Rent to Value Ratio

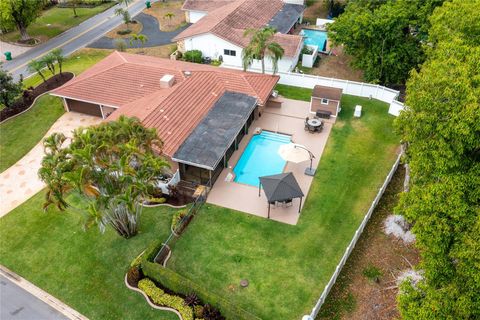
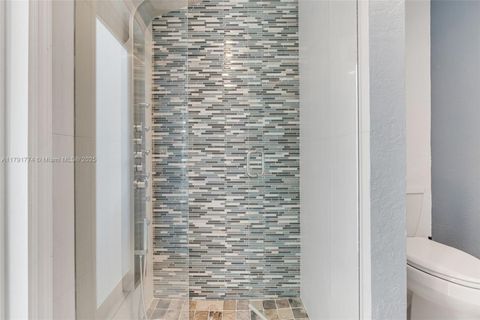
Active
$975,000
4
bds
|
3
ba
|
2,183
sqft
|
built
1968
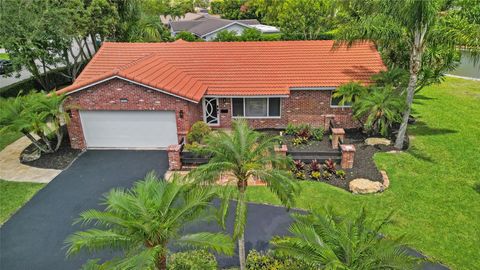
3705 NW 82nd Ave, Coral Springs, FL 33065
$-3,518
Cash flow
-18.8%
Cash-on-Cash Return
1.8%
Cap rate
0.5%
Rent to Value Ratio
Active
$620,000
3
bds
|
2
ba
|
2,158
sqft
|
built
1978
215 NW 86th Ter, Coral Springs, FL 33071
$-1,128
Cash flow
-9.5%
Cash-on-Cash Return
4.0%
Cap rate
0.6%
Rent to Value Ratio
Active
$129,999
1
bds
|
1
ba
|
610
sqft
|
built
1974
4116 NW 88th Ave, Coral Springs, FL 33065
$20
Cash flow
0.8%
Cash-on-Cash Return
6.3%
Cap rate
1.2%
Rent to Value Ratio

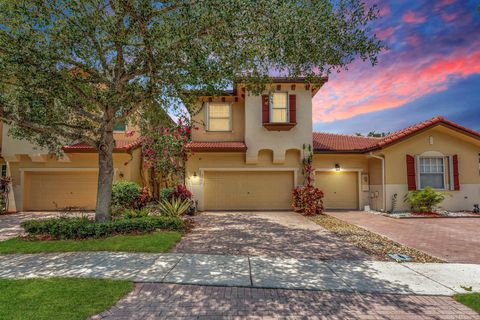
Active
$660,000
4
bds
|
3
ba
|
2,273
sqft
|
built
1983
295 NW 107th Ave, Coral Springs, FL 33071
$-970
Cash flow
-7.7%
Cash-on-Cash Return
4.4%
Cap rate
0.7%
Rent to Value Ratio
Active
$590,000
3
bds
|
3
ba
|
2,160
sqft
|
built
2000
11182 NW 34th Ct, Coral Springs, FL 33065
$-1,505
Cash flow
-13.3%
Cash-on-Cash Return
3.1%
Cap rate
0.5%
Rent to Value Ratio
Active
$615,000
4
bds
|
3
ba
|
2,274
sqft
|
built
1987
5321 NW 58th Ter, Coral Springs, FL 33067
$-1,052
Cash flow
-8.9%
Cash-on-Cash Return
4.1%
Cap rate
0.7%
Rent to Value Ratio
Active
$575,000
4
bds
|
3
ba
|
2,265
sqft
|
built
2001
5742 NW 119th Ter, Coral Springs, FL 33076
$-1,452
Cash flow
-13.2%
Cash-on-Cash Return
3.1%
Cap rate
0.8%
Rent to Value Ratio

Active
$759,000
3
bds
|
3
ba
|
2,816
sqft
|
built
1973
2730 NW 105th Ter, Coral Springs, FL 33065
$-923
Cash flow
-6.3%
Cash-on-Cash Return
4.7%
Cap rate
0.7%
Rent to Value Ratio
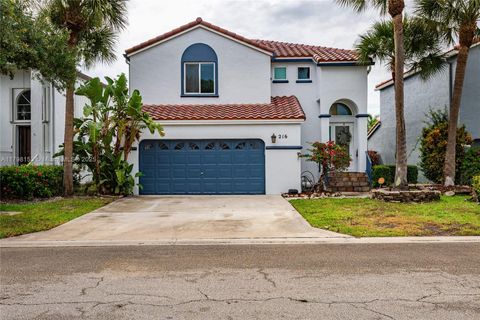
Active
$590,000
3
bds
|
3
ba
|
1,738
sqft
|
built
1993
216 NW 118th Dr, Coral Springs, FL 33071
$-1,602
Cash flow
-14.2%
Cash-on-Cash Return
2.9%
Cap rate
0.6%
Rent to Value Ratio

Active
$730,000
4
bds
|
2
ba
|
2,033
sqft
|
built
1986
11377 NW 21st Ct, Coral Springs, FL 33071
$-1,346
Cash flow
-9.6%
Cash-on-Cash Return
3.9%
Cap rate
0.6%
Rent to Value Ratio
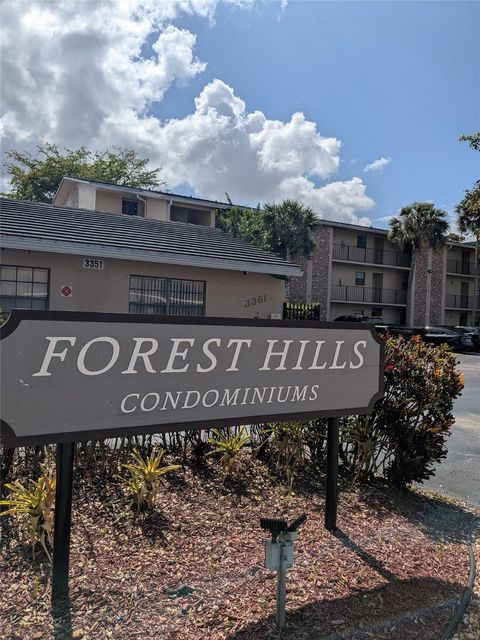
Active
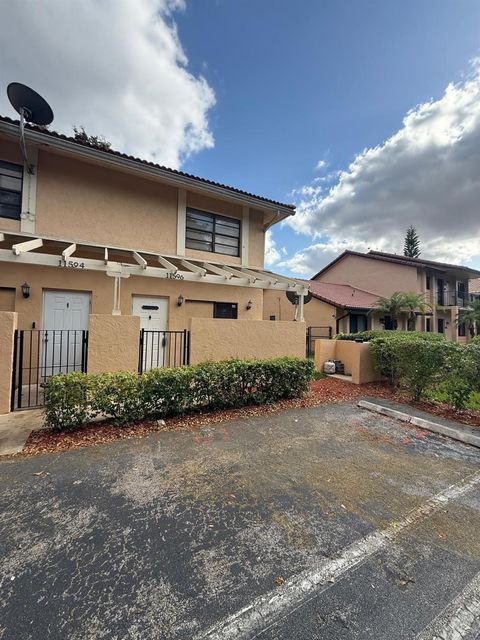
$199,000
2
bds
|
2
ba
|
925
sqft
|
built
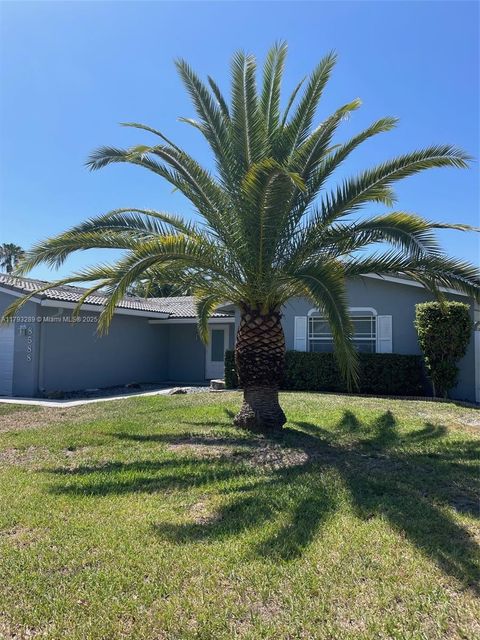
1977
3351 NW 85th Ave, Coral Springs, FL 33065
$-672
Cash flow
-17.6%
Cash-on-Cash Return
2.1%
Cap rate
0.9%
Rent to Value Ratio

Active
$729,900
4
bds
|
3
ba
|
2,459
sqft
|
built
1977
3215 NW 114th Ln, Coral Springs, FL 33065
$-1,653
Cash flow
-11.8%
Cash-on-Cash Return
3.4%
Cap rate
0.5%
Rent to Value Ratio

Active
$839,999
4
bds
|
3
ba
|
2,394
sqft
|
built
1994
4964 NW 108th Ter, Coral Springs, FL 33076
$-1,971
Cash flow
-12.2%
Cash-on-Cash Return
3.3%
Cap rate
0.6%
Rent to Value Ratio
Active
$699,000
4
bds
|
2
ba
|
2,426
sqft
|
built
1985
5165 NW 66th Dr, Coral Springs, FL 33067
$-1,040
Cash flow
-7.8%
Cash-on-Cash Return
4.4%
Cap rate
0.6%
Rent to Value Ratio
Active
$749,000
4
bds
|
3
ba
|
2,180
sqft
|
built
1995
11613 NW 11th Pl, Coral Springs, FL 33071
$-2,400
Cash flow
-16.7%
Cash-on-Cash Return
2.3%
Cap rate
0.5%
Rent to Value Ratio
Active
$310,000
2
bds
|
3
ba
|
1,140
sqft
|
built
1983
11596 NW 45th St, Coral Springs, FL 33065
$-1,097
Cash flow
-18.5%
Cash-on-Cash Return
1.9%
Cap rate
0.6%
Rent to Value Ratio
Active
$824,999
4
bds
|
2
ba
|
2,684
sqft
|
built
1978
9903 NW 19th St, Coral Springs, FL 33071
$-1,970
Cash flow
-12.5%
Cash-on-Cash Return
3.3%
Cap rate
0.5%
Rent to Value Ratio

Active
$536,000
3
bds
|
2
ba
|
1,611
sqft
|
built
1971
4109 NW 79th Ave, Coral Springs, FL 33065
$-1,304
Cash flow
-12.7%
Cash-on-Cash Return
3.2%
Cap rate
0.6%
Rent to Value Ratio

Active
$634,999
4
bds
|
2
ba
|
2,137
sqft
|
built
1978
9866 NW 19th St, Coral Springs, FL 33071
$-1,187
Cash flow
-9.8%
Cash-on-Cash Return
3.9%
Cap rate
0.7%
Rent to Value Ratio
Active
$699,999
4
bds
|
2
ba
|
2,038
sqft
|
built
1972
10350 NW 42nd Dr, Coral Springs, FL 33065
$-2,058
Cash flow
-15.3%
Cash-on-Cash Return
2.6%
Cap rate
0.5%
Rent to Value Ratio
Active
$675,000
4
bds
|
2
ba
|
1,853
sqft
|
built
1972
8588 NW 27th Dr, Coral Springs, FL 33065
$-1,489
Cash flow
-11.5%
Cash-on-Cash Return
3.5%
Cap rate
0.6%
Rent to Value Ratio
Active
$1,199,000
5
bds
|
3
ba
|
3,182
sqft
|
built
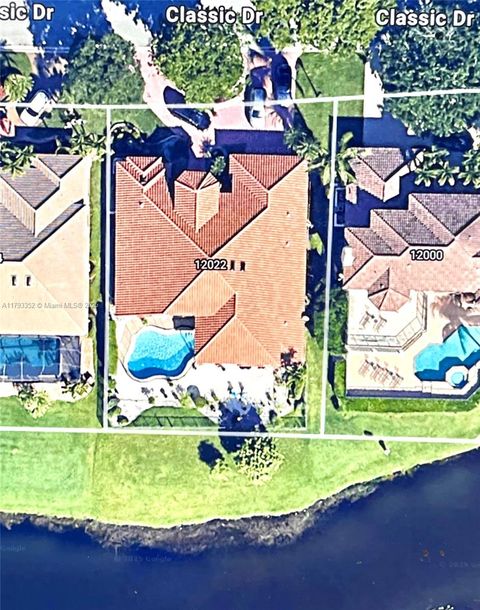
1990
12022 Classic Dr, Coral Springs, FL 33071
$-4,185
Cash flow
-18.2%
Cash-on-Cash Return
2.0%
Cap rate
0.4%
Rent to Value Ratio

Active
$270,000
3
bds
|
2
ba
|
1,260
sqft
|
built
1988
12269 Royal Palm Blvd, Coral Springs, FL 33065
$-732
Cash flow
-14.1%
Cash-on-Cash Return
2.9%
Cap rate
0.9%
Rent to Value Ratio
Active
$135,000
1
bds
|
2
ba
|
690
sqft
|
built
1979
4159 NW 90th Ave, Coral Springs, FL 33065
$15
Cash flow
0.6%
Cash-on-Cash Return
6.3%
Cap rate
1.2%
Rent to Value Ratio

Active
$845,000
4
bds
|
2
ba
|
2,157
sqft
|
built
1987
8400 NW 47th Dr, Coral Springs, FL 33067
$-1,656
Cash flow
-10.2%
Cash-on-Cash Return
3.8%
Cap rate
0.6%
Rent to Value Ratio

Active
$959,990
4
bds
|
5
ba
|
3,545
sqft
|
built
1999
6777 NW 44th Ct, Coral Springs, FL 33067
$-2,070
Cash flow
-11.3%
Cash-on-Cash Return
3.6%
Cap rate
0.6%
Rent to Value Ratio

Active
$875,000
4
bds
|
2
ba
|
2,268
sqft
|
built
2003
6017 NW 56th Cir, Coral Springs, FL 33067
$-2,503
Cash flow
-14.9%
Cash-on-Cash Return
2.7%
Cap rate
0.6%
Rent to Value Ratio
Active
$715,000
4
bds
|
3
ba
|
2,176
sqft
|
built
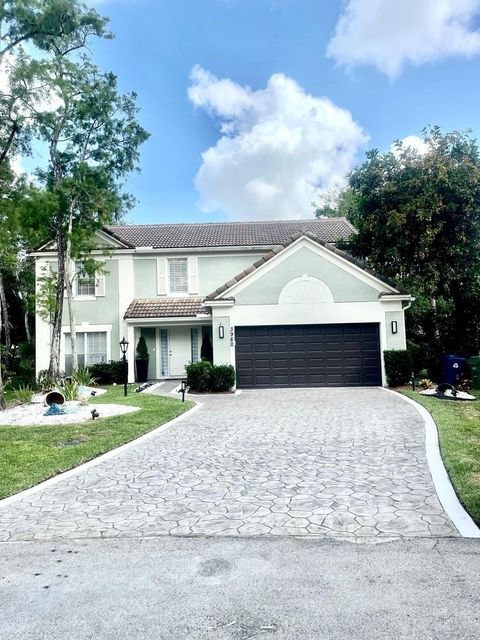
1991
3980 Wild Lime Ln, Coral Springs, FL 33065
$-1,135
Cash flow
-8.3%
Cash-on-Cash Return
4.2%
Cap rate
0.7%
Rent to Value Ratio

Active
$815,000
4
bds
|
3
ba
|
2,262
sqft
|
built
1986
5197 NW 58th Ter, Coral Springs, FL 33067
$-1,424
Cash flow
-9.1%
Cash-on-Cash Return
4.1%
Cap rate
0.6%
Rent to Value Ratio
Active
$219,999
2
bds
|
2
ba
|
1,000
sqft
|
built
1979
9150 NW 38th Dr, Coral Springs, FL 33065
$-769
Cash flow
-18.2%
Cash-on-Cash Return
2.0%
Cap rate
0.9%
Rent to Value Ratio
Active
$780,000
3
bds
|
2
ba
|
1,961
sqft
|
built
1974
10300 NW 44th St, Coral Springs, FL 33065
$-2,076
Cash flow
-13.9%
Cash-on-Cash Return
3.0%
Cap rate
0.5%
Rent to Value Ratio
Active
$624,000
3
bds
|
2
ba
|
1,644
sqft
|
built
2001
5847 NW 120th Ave, Coral Springs, FL 33076
$-1,744
Cash flow
-14.6%
Cash-on-Cash Return
2.8%
Cap rate
0.6%
Rent to Value Ratio
Active
$1,150,000
4
bds
|
3
ba
|
3,134
sqft
|
built
1989
4699 Rothschild Dr, Coral Springs, FL 33067
$-3,152
Cash flow
-14.3%
Cash-on-Cash Return
2.9%
Cap rate
0.5%
Rent to Value Ratio
Active
$210,000
2
bds
|
2
ba
|
0
sqft
|
built
1982
10068 Twin Lakes Dr, Coral Springs, FL 33071
$-747
Cash flow
-18.6%
Cash-on-Cash Return
1.9%
Cap rate
0.9%
Rent to Value Ratio

Active
$259,000
2
bds
|
2
ba
|
1,114
sqft
|
built
1990
11229 W Atlantic Blvd, Coral Springs, FL 33071
$-676
Cash flow
-13.6%
Cash-on-Cash Return
3.0%
Cap rate
0.8%
Rent to Value Ratio
Active
$1,349,000
6
bds
|
5
ba
|
3,621
sqft
|
built
2002
6600 NW 56th Dr, Coral Springs, FL 33067
$-5,268
Cash flow
-20.4%
Cash-on-Cash Return
1.5%
Cap rate
0.4%
Rent to Value Ratio
Active
$259,000
2
bds
|
2
ba
|
1,168
sqft
|
built
1981
2850 Forest Hills Blvd, Coral Springs, FL 33065
$-588
Cash flow
-11.8%
Cash-on-Cash Return
3.4%
Cap rate
0.8%
Rent to Value Ratio

Active
$185,000
2
bds
|
2
ba
|
768
sqft
|
built
1983
10106 Twin Lakes Dr, Coral Springs, FL 33071
$-565
Cash flow
-15.9%
Cash-on-Cash Return
2.5%
Cap rate
1.0%
Rent to Value Ratio