Coral Springs, FL Investment Properties for Sale
Browse homes for sale and investment properties in Coral Springs, FL. Refine your search by price, property type, or more.
Best cash flowing properties in Coral Springs, FL
Active
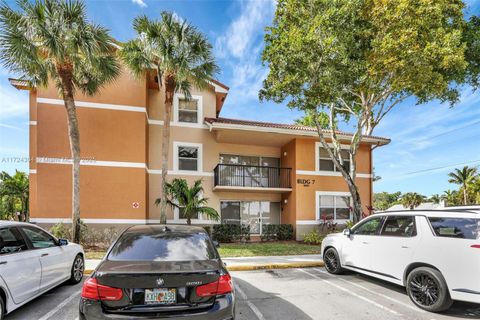
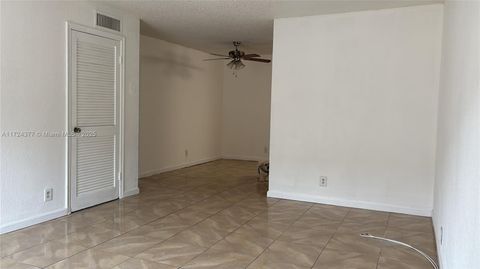
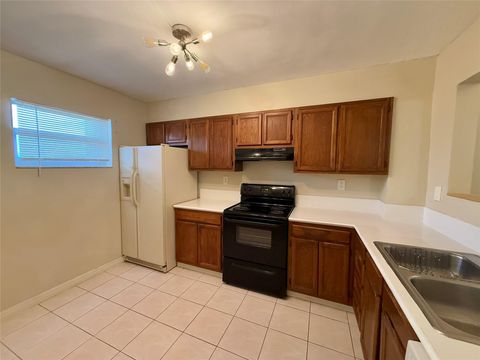
$199,999
2
bds
|
2
ba
|
1,068
sqft
|
built
1976
8421 Forest Hills Dr, Coral Springs, FL 33065
$237
Cash flow
6.2%
Cash-on-Cash Return
7.6%
Cap rate
1.0%
Rent to Value Ratio
Active
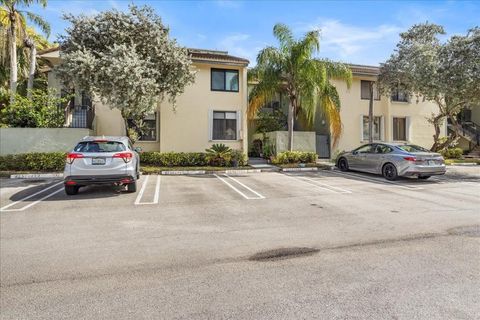
$167,990
2
bds
|
2
ba
|
1,085
sqft
|
built
1974
4125 NW 88th Ave, Coral Springs, FL 33065
$-89
Cash flow
-2.8%
Cash-on-Cash Return
5.5%
Cap rate
1.2%
Rent to Value Ratio
614 out of 718 properties for sale in Coral Springs, FL
Limited Results Shown
Create a free account, or log in to reveal all property listings and enjoy the complete experience.
Active
$225,000
2
bds
|
2
ba
|
768
sqft
|
built
1981
918 Twin Lakes Dr, Coral Springs, FL 33071
$-857
Cash flow
-19.9%
Cash-on-Cash Return
1.6%
Cap rate
0.8%
Rent to Value Ratio
Active
$250,000
3
bds
|
2
ba
|
1,073
sqft
|
built
1983
8431 Royal Palm Blvd, Coral Springs, FL 33065
$-539
Cash flow
-11.2%
Cash-on-Cash Return
3.6%
Cap rate
1.0%
Rent to Value Ratio
Active
$299,000
3
bds
|
2
ba
|
1,166
sqft
|
built
1990
8891 Wiles Rd, Coral Springs, FL 33067
$-1,071
Cash flow
-18.7%
Cash-on-Cash Return
1.9%
Cap rate
0.8%
Rent to Value Ratio
Active
$180,000
2
bds
|
1
ba
|
752
sqft
|
built
1981
10856 Royal Palm Blvd, Coral Springs, FL 33065
$-493
Cash flow
-14.3%
Cash-on-Cash Return
2.9%
Cap rate
1.0%
Rent to Value Ratio
Active
$200,000
2
bds
|
2
ba
|
990
sqft
|
built
1980
1200 NW 87th Ave, Coral Springs, FL 33071
$-457
Cash flow
-11.9%
Cash-on-Cash Return
3.4%
Cap rate
1.0%
Rent to Value Ratio

Active
$245,000
1
bds
|
1
ba
|
716
sqft
|
built
2003
6776 W Sample Rd, Coral Springs, FL 33067
$-370
Cash flow
-7.9%
Cash-on-Cash Return
4.3%
Cap rate
0.7%
Rent to Value Ratio
Active
$338,900
3
bds
|
2
ba
|
1,390
sqft
|
built
1982
9520 SW 1st Ct, Coral Springs, FL 33071
$-866
Cash flow
-13.3%
Cash-on-Cash Return
3.1%
Cap rate
0.8%
Rent to Value Ratio
Active
$199,999
2
bds
|
2
ba
|
1,068
sqft
|
built
1976
8421 Forest Hills Dr, Coral Springs, FL 33065
$237
Cash flow
6.2%
Cash-on-Cash Return
7.6%
Cap rate
1.0%
Rent to Value Ratio
Active
$230,000
3
bds
|
2
ba
|
1,138
sqft
|
built
1993
12240 Royal Palm Blvd, Coral Springs, FL 33065
$-610
Cash flow
-13.8%
Cash-on-Cash Return
3.0%
Cap rate
1.0%
Rent to Value Ratio

Active
$285,000
3
bds
|
2
ba
|
1,270
sqft
|
built
1983
2059 Coral Ridge Dr, Coral Springs, FL 33071
$-897
Cash flow
-16.4%
Cash-on-Cash Return
2.4%
Cap rate
0.8%
Rent to Value Ratio
Active
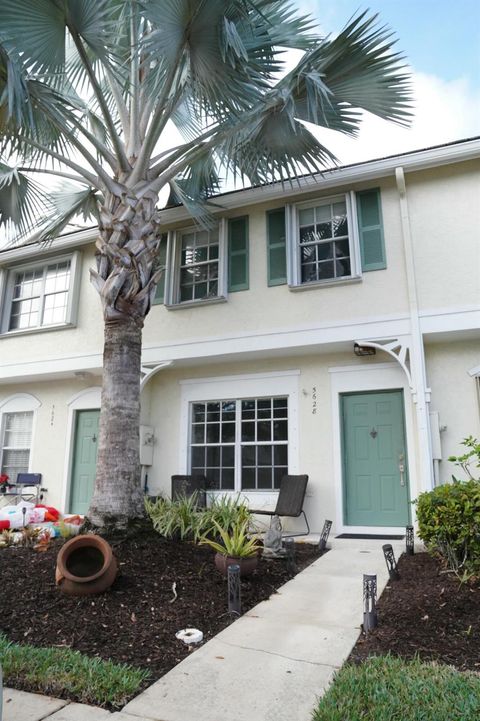
$389,000
2
bds
|
3
ba
|
1,170
sqft
|
built
1998
5628 NW 99th Ln, Coral Springs, FL 33076
$-631
Cash flow
-8.5%
Cash-on-Cash Return
4.2%
Cap rate
0.7%
Rent to Value Ratio
Active
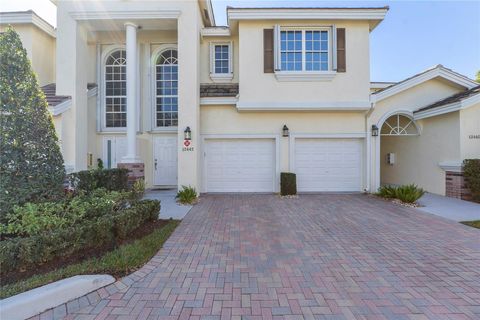
$448,500
3
bds
|
2
ba
|
1,850
sqft
|
built
1994
12442 NW 10th Ct, Coral Springs, FL 33071
$-999
Cash flow
-11.6%
Cash-on-Cash Return
3.5%
Cap rate
0.8%
Rent to Value Ratio
Active
$647,000
4
bds
|
2
ba
|
2,015
sqft
|
built
1979
2638 NW 98th Way, Coral Springs, FL 33065
$-531
Cash flow
-4.3%
Cash-on-Cash Return
5.2%
Cap rate
0.7%
Rent to Value Ratio
Active
$949,999
5
bds
|
3
ba
|
2,548
sqft
|
built
1990
5015 NW 104th Way, Coral Springs, FL 33076
$-983
Cash flow
-5.4%
Cash-on-Cash Return
4.9%
Cap rate
0.7%
Rent to Value Ratio
Active
$209,000
1
bds
|
1
ba
|
950
sqft
|
built
1987
777 Riverside Dr, Coral Springs, FL 33071
$-689
Cash flow
-17.2%
Cash-on-Cash Return
2.2%
Cap rate
0.9%
Rent to Value Ratio
Active
$789,900
4
bds
|
3
ba
|
2,896
sqft
|
built
2002
12365 NW 26th St, Coral Springs, FL 33065
$-1,544
Cash flow
-10.2%
Cash-on-Cash Return
3.8%
Cap rate
0.6%
Rent to Value Ratio
Active
$279,900
2
bds
|
2
ba
|
1,230
sqft
|
built
1974
8900 W Sample Rd, Coral Springs, FL 33065
$-787
Cash flow
-14.7%
Cash-on-Cash Return
2.8%
Cap rate
0.8%
Rent to Value Ratio
Active
$890,000
5
bds
|
4
ba
|
3,290
sqft
|
built
1996
5289 NW 112th Way, Coral Springs, FL 33076
$-2,071
Cash flow
-12.1%
Cash-on-Cash Return
3.4%
Cap rate
0.6%
Rent to Value Ratio
Active
$238,000
2
bds
|
2
ba
|
1,068
sqft
|
built
1979
8437 Forest Hills Dr, Coral Springs, FL 33065
$-686
Cash flow
-15.0%
Cash-on-Cash Return
2.7%
Cap rate
0.9%
Rent to Value Ratio
Active
$699,900
4
bds
|
2
ba
|
2,194
sqft
|
built
1982
1230 NW 110th Ter, Coral Springs, FL 33071
$-656
Cash flow
-4.9%
Cash-on-Cash Return
5.0%
Cap rate
0.7%
Rent to Value Ratio
Active
$279,000
3
bds
|
2
ba
|
1,166
sqft
|
built
2006
8871 Wiles Rd, Coral Springs, FL 33067
$-828
Cash flow
-15.5%
Cash-on-Cash Return
2.6%
Cap rate
0.9%
Rent to Value Ratio
Active
$180,000
2
bds
|
2
ba
|
1,179
sqft
|
built
1975
2960 Riverside Dr, Coral Springs, FL 33065
$-606
Cash flow
-17.6%
Cash-on-Cash Return
2.1%
Cap rate
1.0%
Rent to Value Ratio
Active
$629,000
4
bds
|
3
ba
|
2,100
sqft
|
built
2023
11831 NW 47th Mnr, Coral Springs, FL 33076
$-1,047
Cash flow
-8.7%
Cash-on-Cash Return
4.1%
Cap rate
0.7%
Rent to Value Ratio
Active
$515,000
3
bds
|
2
ba
|
1,365
sqft
|
built
1983
402 Shadow Wood Ln, Coral Springs, FL 33071
$-850
Cash flow
-8.6%
Cash-on-Cash Return
4.2%
Cap rate
0.7%
Rent to Value Ratio
Active
$209,900
2
bds
|
2
ba
|
832
sqft
|
built
1982
10571 Royal Palm Blvd, Coral Springs, FL 33065
$-434
Cash flow
-10.8%
Cash-on-Cash Return
3.7%
Cap rate
0.9%
Rent to Value Ratio
Active
$255,000
2
bds
|
2
ba
|
1,095
sqft
|
built
1977
2700 Coral Springs Dr, Coral Springs, FL 33065
$-475
Cash flow
-9.7%
Cash-on-Cash Return
3.9%
Cap rate
0.9%
Rent to Value Ratio
Active
$349,900
3
bds
|
2
ba
|
1,390
sqft
|
built
1981
9592 SW 1st Ct, Coral Springs, FL 33071
$-683
Cash flow
-10.2%
Cash-on-Cash Return
3.8%
Cap rate
0.8%
Rent to Value Ratio
Active
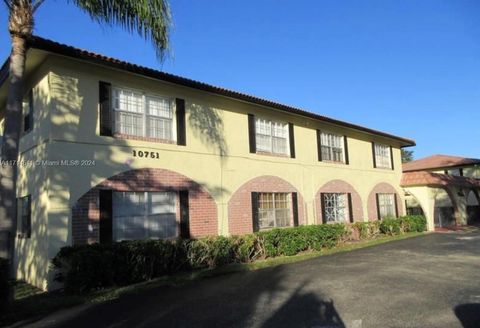
$175,000
1
bds
|
2
ba
|
855
sqft
|
built
1974
10751 Royal Palm Blvd, Coral Springs, FL 33065
$-416
Cash flow
-12.4%
Cash-on-Cash Return
3.3%
Cap rate
1.0%
Rent to Value Ratio
Active
$167,990
2
bds
|
2
ba
|
1,085
sqft
|
built
1974
4125 NW 88th Ave, Coral Springs, FL 33065
$-89
Cash flow
-2.8%
Cash-on-Cash Return
5.5%
Cap rate
1.2%
Rent to Value Ratio
Active
$200,000
2
bds
|
1
ba
|
752
sqft
|
built
1981
10916 Royal Palm Blvd, Coral Springs, FL 33065
$-742
Cash flow
-19.4%
Cash-on-Cash Return
1.7%
Cap rate
0.9%
Rent to Value Ratio
Active
$445,000
3
bds
|
2
ba
|
1,845
sqft
|
built
1994
12337 NW 10th Dr, Coral Springs, FL 33071
$-1,242
Cash flow
-14.6%
Cash-on-Cash Return
2.8%
Cap rate
0.7%
Rent to Value Ratio
Active
$924,000
4
bds
|
3
ba
|
3,066
sqft
|
built
1990
11834 Highland Pl, Coral Springs, FL 33071
$-2,028
Cash flow
-11.5%
Cash-on-Cash Return
3.5%
Cap rate
0.7%
Rent to Value Ratio
Active
$189,900
2
bds
|
2
ba
|
1,213
sqft
|
built
1982
4075 Coral Springs Dr, Coral Springs, FL 33065
$-637
Cash flow
-17.5%
Cash-on-Cash Return
2.1%
Cap rate
1.1%
Rent to Value Ratio

Active
$699,000
4
bds
|
4
ba
|
2,528
sqft
|
built
1974
11899 NW 24th St, Coral Springs, FL 33065
$-960
Cash flow
-7.2%
Cash-on-Cash Return
4.5%
Cap rate
0.7%
Rent to Value Ratio
Active
$200,000
2
bds
|
2
ba
|
1,179
sqft
|
built
1975
2960 Riverside Dr, Coral Springs, FL 33065
$-552
Cash flow
-14.4%
Cash-on-Cash Return
2.8%
Cap rate
1.0%
Rent to Value Ratio
Active
$210,000
2
bds
|
2
ba
|
768
sqft
|
built
1981
10036 Twin Lakes Dr, Coral Springs, FL 33071
$-585
Cash flow
-14.5%
Cash-on-Cash Return
2.8%
Cap rate
1.0%
Rent to Value Ratio
Active
$895,000
5
bds
|
3
ba
|
3,066
sqft
|
built
2000
9526 NW 52nd Pl, Coral Springs, FL 33076
$-1,231
Cash flow
-7.2%
Cash-on-Cash Return
4.5%
Cap rate
0.8%
Rent to Value Ratio
Active
$224,000
2
bds
|
2
ba
|
933
sqft
|
built
1984
10001 W Atlantic Blvd, Coral Springs, FL 33071
$-586
Cash flow
-13.6%
Cash-on-Cash Return
3.0%
Cap rate
0.8%
Rent to Value Ratio

Active
$775,000
5
bds
|
3
ba
|
0
sqft
|
built
2001
5606 NW 122nd Ter, Coral Springs, FL 33076
$-1,698
Cash flow
-11.4%
Cash-on-Cash Return
3.5%
Cap rate
0.7%
Rent to Value Ratio
Active
$2,175,000
6
bds
|
7
ba
|
6,684
sqft
|
built
1990
12040 Eagle Trace Blvd N, Coral Springs, FL 33071
$-6,344
Cash flow
-15.2%
Cash-on-Cash Return
2.6%
Cap rate
0.5%
Rent to Value Ratio