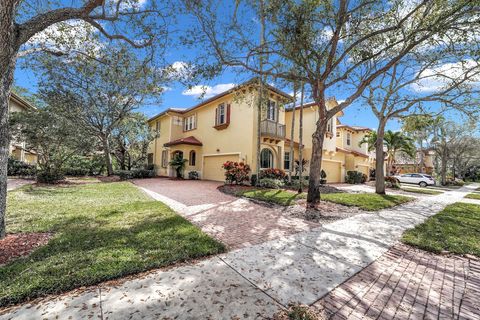
Coral Springs, FL Investment Properties for Sale
Browse homes for sale and investment properties in Coral Springs, FL. Refine your search by price, property type, or more.
Best cash flowing properties in Coral Springs, FL
Active
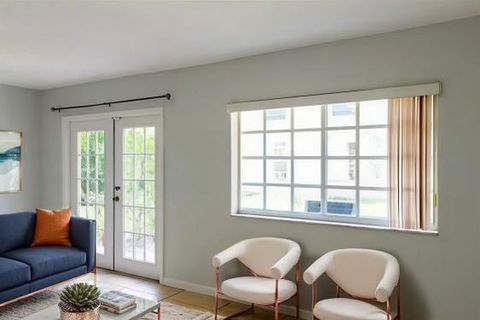
$145,000
1
bds
|
2
ba
|
690
sqft
|
built
1974
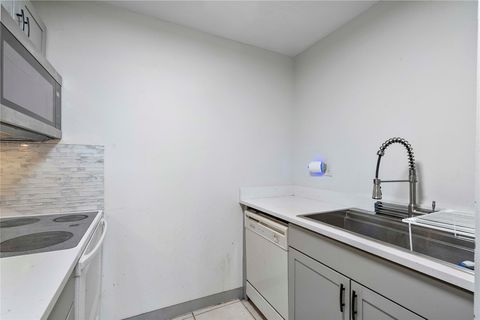
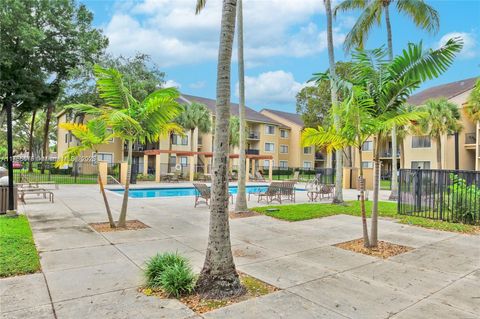
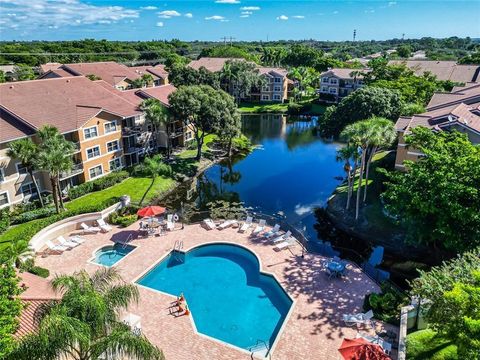
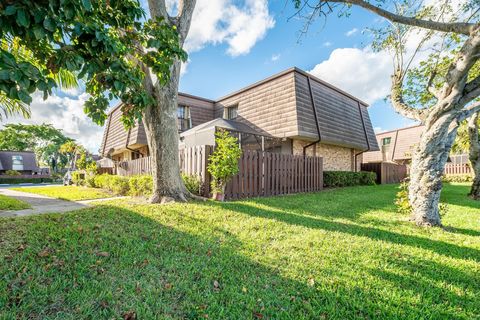
4142 NW 90th Ave, Coral Springs, FL 33065
$67
Cash flow
2.4%
Cash-on-Cash Return
6.7%
Cap rate
1.1%
Rent to Value Ratio
Active
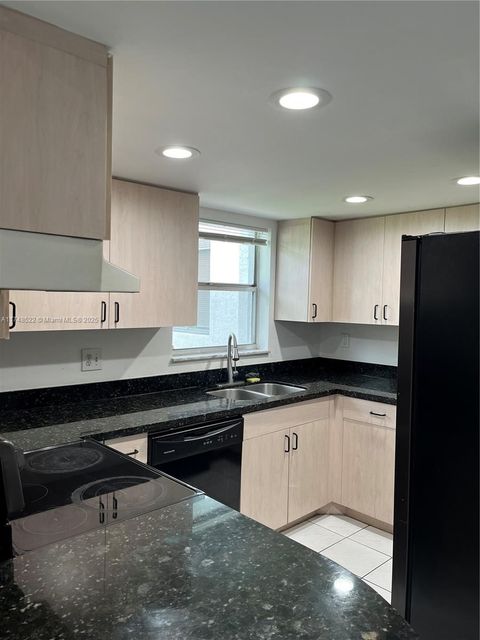
$128,000
1
bds
|
2
ba
|
680
sqft
|
built
1974
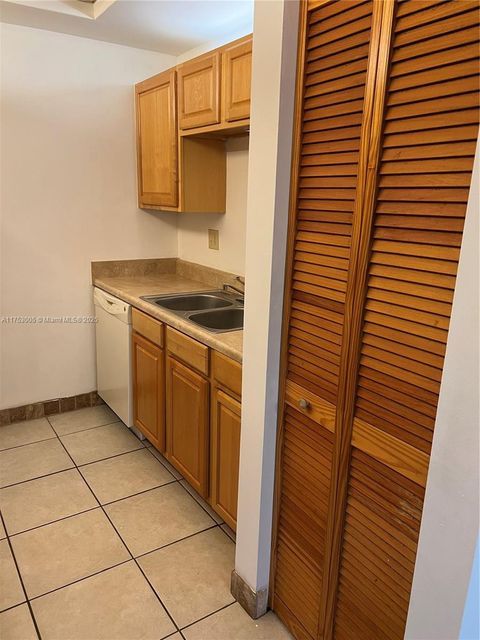
4116 NW 88th Ave, Coral Springs, FL 33065
$54
Cash flow
2.2%
Cash-on-Cash Return
6.7%
Cap rate
1.3%
Rent to Value Ratio
614 out of 718 properties for sale in Coral Springs, FL
Limited Results Shown
Create a free account, or log in to reveal all property listings and enjoy the complete experience.
Active
$694,500
3
bds
|
2
ba
|
1,916
sqft
|
built
1989
12319 NW 26th Ct, Coral Springs, FL 33065
$-1,727
Cash flow
-13.0%
Cash-on-Cash Return
3.2%
Cap rate
0.6%
Rent to Value Ratio
Active
$695,000
4
bds
|
2
ba
|
2,260
sqft
|
built
1986
6581 NW 52nd St, Coral Springs, FL 33067
$-1,215
Cash flow
-9.1%
Cash-on-Cash Return
4.0%
Cap rate
0.7%
Rent to Value Ratio
Active
$254,000
2
bds
|
2
ba
|
986
sqft
|
built
1990
9200 W Atlantic Blvd, Coral Springs, FL 33071
$-745
Cash flow
-15.3%
Cash-on-Cash Return
2.6%
Cap rate
0.8%
Rent to Value Ratio
Active
$259,900
2
bds
|
2
ba
|
989
sqft
|
built
1992
8701 Wiles Rd, Coral Springs, FL 33067
$-803
Cash flow
-16.1%
Cash-on-Cash Return
2.4%
Cap rate
0.8%
Rent to Value Ratio

Active
$200,000
2
bds
|
2
ba
|
768
sqft
|
built
1981
10004 Twin Lakes Dr, Coral Springs, FL 33071
$-679
Cash flow
-17.7%
Cash-on-Cash Return
2.1%
Cap rate
0.9%
Rent to Value Ratio
Active
$323,000
3
bds
|
2
ba
|
1,260
sqft
|
built
1988
12223 Royal Palm Blvd, Coral Springs, FL 33065
$-1,000
Cash flow
-16.2%
Cash-on-Cash Return
2.4%
Cap rate
0.8%
Rent to Value Ratio
Active
$925,000
4
bds
|
4
ba
|
3,032
sqft
|
built
1984
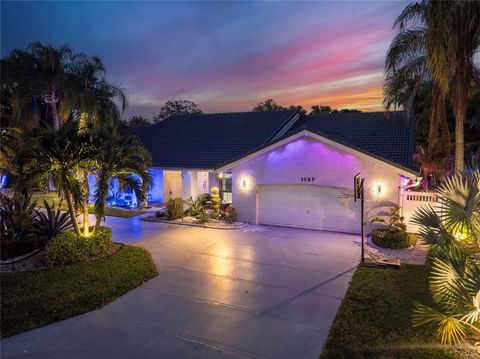
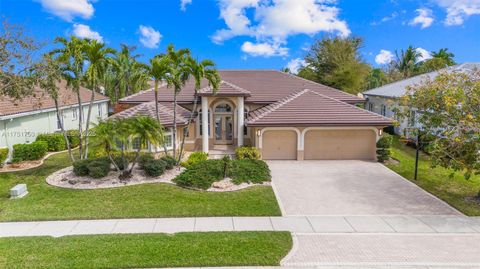
1137 NW 111th Way, Coral Springs, FL 33071
$-1,155
Cash flow
-6.5%
Cash-on-Cash Return
4.6%
Cap rate
0.8%
Rent to Value Ratio
Active
$739,900
4
bds
|
3
ba
|
2,137
sqft
|
built
1984
1348 NW 113th Ter, Coral Springs, FL 33071
$-679
Cash flow
-4.8%
Cash-on-Cash Return
5.0%
Cap rate
0.7%
Rent to Value Ratio
Active
$975,000
4
bds
|
3
ba
|
2,679
sqft
|
built
1987
8220 NW 49th Ct, Coral Springs, FL 33067
$-2,531
Cash flow
-13.5%
Cash-on-Cash Return
3.0%
Cap rate
0.6%
Rent to Value Ratio
Active
$500,000
3
bds
|
2
ba
|
1,548
sqft
|
built
2001
12625 NW 7th Ct, Coral Springs, FL 33071
$-1,045
Cash flow
-10.9%
Cash-on-Cash Return
3.6%
Cap rate
0.6%
Rent to Value Ratio
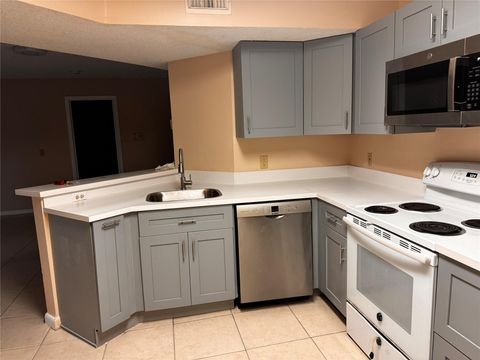
Active
$210,800
2
bds
|
2
ba
|
1,070
sqft
|
built
1978
4140 NW 90th Ave, Coral Springs, FL 33065
$-478
Cash flow
-11.8%
Cash-on-Cash Return
3.4%
Cap rate
0.9%
Rent to Value Ratio
Active
$550,000
3
bds
|
3
ba
|
2,029
sqft
|
built
2001
5747 NW 119th Dr, Coral Springs, FL 33076
$-1,676
Cash flow
-15.9%
Cash-on-Cash Return
2.5%
Cap rate
0.7%
Rent to Value Ratio

Active
$549,000
3
bds
|
2
ba
|
1,714
sqft
|
built
1973
9080 NW 23rd St, Coral Springs, FL 33065
$-1,098
Cash flow
-10.4%
Cash-on-Cash Return
3.7%
Cap rate
0.5%
Rent to Value Ratio
Active
$299,990
3
bds
|
2
ba
|
1,240
sqft
|
built
2005
5900 W Sample Rd, Coral Springs, FL 33067
$-1,075
Cash flow
-18.7%
Cash-on-Cash Return
1.8%
Cap rate
0.8%
Rent to Value Ratio
Active
$1,145,000
4
bds
|
3
ba
|
3,133
sqft
|
built
1987
8551 NW 53rd Ct, Coral Springs, FL 33067
$-2,930
Cash flow
-13.4%
Cash-on-Cash Return
3.1%
Cap rate
0.4%
Rent to Value Ratio
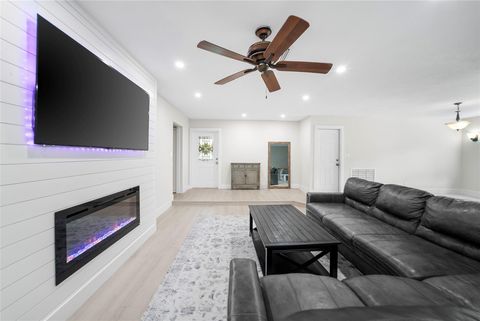
Active
$148,000
1
bds
|
2
ba
|
690
sqft
|
built
1979
4161 NW 90th Ave, Coral Springs, FL 33065
$-83
Cash flow
-2.9%
Cash-on-Cash Return
5.5%
Cap rate
1.1%
Rent to Value Ratio
Active
$334,000
2
bds
|
3
ba
|
1,284
sqft
|
built
1985
2670 NW 99th Ave, Coral Springs, FL 33065
$-878
Cash flow
-13.7%
Cash-on-Cash Return
3.0%
Cap rate
0.7%
Rent to Value Ratio

Active
$700,000
4
bds
|
3
ba
|
2,127
sqft
|
built
1973
8405 NW 38th St, Coral Springs, FL 33065
$-1,215
Cash flow
-9.1%
Cash-on-Cash Return
4.1%
Cap rate
0.7%
Rent to Value Ratio
Active
$145,000
1
bds
|
2
ba
|
690
sqft
|
built
1974
4142 NW 90th Ave, Coral Springs, FL 33065
$67
Cash flow
2.4%
Cash-on-Cash Return
6.7%
Cap rate
1.1%
Rent to Value Ratio
Active
$128,000
1
bds
|
2
ba
|
680
sqft
|
built
1974
4116 NW 88th Ave, Coral Springs, FL 33065
$54
Cash flow
2.2%
Cash-on-Cash Return
6.7%
Cap rate
1.3%
Rent to Value Ratio

Active
$405,000
3
bds
|
3
ba
|
1,449
sqft
|
built
1984
2596 NW 99th Ave, Coral Springs, FL 33065
$-954
Cash flow
-12.3%
Cash-on-Cash Return
3.3%
Cap rate
0.7%
Rent to Value Ratio
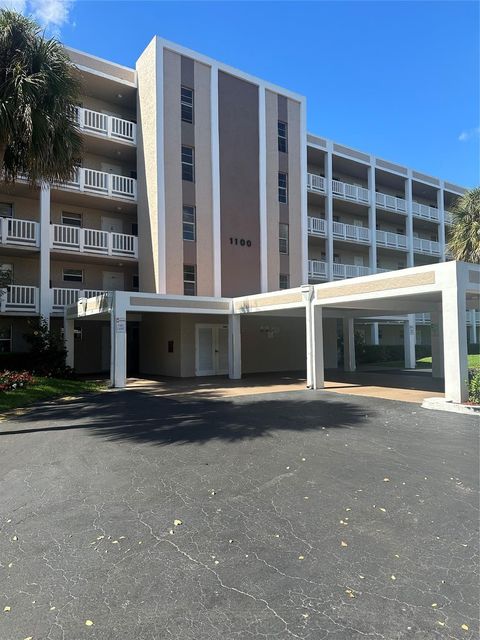
Active
$228,000
2
bds
|
2
ba
|
1,030
sqft
|
built
1975
10772 La Placida Dr, Coral Springs, FL 33065
$-684
Cash flow
-15.7%
Cash-on-Cash Return
2.5%
Cap rate
0.9%
Rent to Value Ratio
Active
$835,000
3
bds
|
2
ba
|
1,818
sqft
|
built
2001
5818 NW 119th Dr, Coral Springs, FL 33076
$-2,676
Cash flow
-16.7%
Cash-on-Cash Return
2.3%
Cap rate
0.5%
Rent to Value Ratio
Active
$1,095,000
5
bds
|
3
ba
|
2,812
sqft
|
built
1997
5135 Kensington Cir, Coral Springs, FL 33076
$-2,268
Cash flow
-10.8%
Cash-on-Cash Return
3.7%
Cap rate
0.6%
Rent to Value Ratio
Active
$275,000
3
bds
|
2
ba
|
1,073
sqft
|
built
1983
8421 Royal Palm Blvd, Coral Springs, FL 33065
$-759
Cash flow
-14.4%
Cash-on-Cash Return
2.8%
Cap rate
0.8%
Rent to Value Ratio
Active
$179,900
1
bds
|
2
ba
|
835
sqft
|
built
1980
1200 NW 87th Ave, Coral Springs, FL 33071
$-277
Cash flow
-8.0%
Cash-on-Cash Return
4.3%
Cap rate
0.9%
Rent to Value Ratio
Active
$525,000
3
bds
|
2
ba
|
1,487
sqft
|
built
1974
3798 NW 79th Ave, Coral Springs, FL 33065
$-760
Cash flow
-7.6%
Cash-on-Cash Return
4.4%
Cap rate
0.6%
Rent to Value Ratio
Active
$278,000
3
bds
|
2
ba
|
1,275
sqft
|
built
1975
3100 Riverside Dr, Coral Springs, FL 33065
$-853
Cash flow
-16.0%
Cash-on-Cash Return
2.5%
Cap rate
0.8%
Rent to Value Ratio
Active
$335,000
3
bds
|
3
ba
|
1,742
sqft
|
built
2007
11545 NW 44th St, Coral Springs, FL 33065
$-508
Cash flow
-7.9%
Cash-on-Cash Return
4.3%
Cap rate
0.9%
Rent to Value Ratio

Active
$700,000
4
bds
|
4
ba
|
2,626
sqft
|
built
1983
653 NW 110th Ave, Coral Springs, FL 33071
$-1,797
Cash flow
-13.4%
Cash-on-Cash Return
3.1%
Cap rate
0.6%
Rent to Value Ratio
Active
$147,000
1
bds
|
2
ba
|
850
sqft
|
built
1974
8404 W Sample Rd, Coral Springs, FL 33065
$-396
Cash flow
-14.1%
Cash-on-Cash Return
2.9%
Cap rate
1.2%
Rent to Value Ratio

Active
$849,000
4
bds
|
3
ba
|
2,563
sqft
|
built
1986
11266 NW 20th Dr, Coral Springs, FL 33071
$-1,744
Cash flow
-10.7%
Cash-on-Cash Return
3.7%
Cap rate
0.6%
Rent to Value Ratio
Active
$269,900
3
bds
|
2
ba
|
1,375
sqft
|
built
1983
2083 Coral Ridge Dr, Coral Springs, FL 33071
$-797
Cash flow
-15.4%
Cash-on-Cash Return
2.6%
Cap rate
0.9%
Rent to Value Ratio

Active
$320,000
3
bds
|
2
ba
|
1,570
sqft
|
built
1974
3057 Coral Springs Dr, Coral Springs, FL 33065
$-649
Cash flow
-10.6%
Cash-on-Cash Return
3.7%
Cap rate
0.8%
Rent to Value Ratio
Active
$379,900
2
bds
|
2
ba
|
1,430
sqft
|
built
1993
12441 NW 10th Ct, Coral Springs, FL 33071
$-1,312
Cash flow
-18.0%
Cash-on-Cash Return
2.0%
Cap rate
0.7%
Rent to Value Ratio
Active
$216,000
2
bds
|
1
ba
|
850
sqft
|
built
1980
4164 NW 90th Ave, Coral Springs, FL 33065
$-304
Cash flow
-7.3%
Cash-on-Cash Return
4.5%
Cap rate
0.9%
Rent to Value Ratio
Active
$639,999
3
bds
|
2
ba
|
2,094
sqft
|
built
1974
1579 NW 84th Dr, Coral Springs, FL 33071
$-832
Cash flow
-6.8%
Cash-on-Cash Return
4.6%
Cap rate
0.7%
Rent to Value Ratio
Active
$239,000
2
bds
|
2
ba
|
984
sqft
|
built
1992
8701 Wiles Rd, Coral Springs, FL 33067
$-598
Cash flow
-13.1%
Cash-on-Cash Return
3.1%
Cap rate
1.0%
Rent to Value Ratio
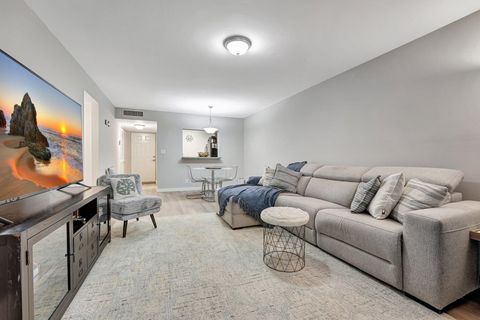
Active
$128,000
1
bds
|
2
ba
|
1,000
sqft
|
built
1980
1100 NW 87th Ave, Coral Springs, FL 33071
$-32
Cash flow
-1.3%
Cash-on-Cash Return
5.9%
Cap rate
1.3%
Rent to Value Ratio
Active
$619,900
4
bds
|
3
ba
|
2,450
sqft
|
built
1984
564 NW 113th Ter, Coral Springs, FL 33071
$-832
Cash flow
-7.0%
Cash-on-Cash Return
4.5%
Cap rate
0.7%
Rent to Value Ratio