Coral Springs, FL Investment Properties for Sale
Browse homes for sale and investment properties in Coral Springs, FL. Refine your search by price, property type, or more.
Best cash flowing properties in Coral Springs, FL
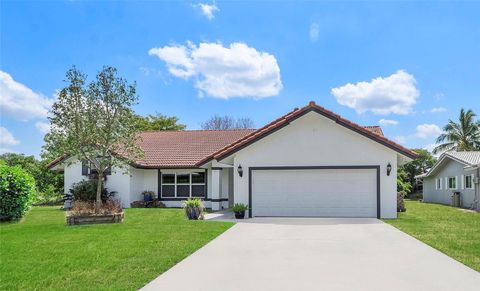
Active
$174,900
2
bds
|
2
ba
|
945
sqft
|
built
1974
8704 NW 35th St, Coral Springs, FL 33065
$-78
Cash flow
-2.3%
Cash-on-Cash Return
5.6%
Cap rate
1.1%
Rent to Value Ratio
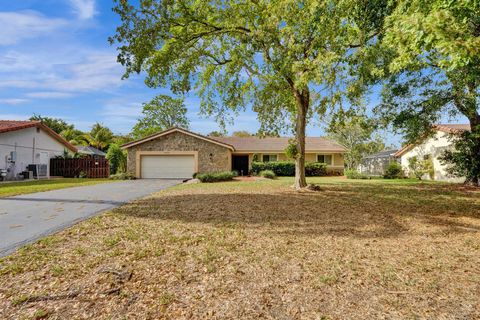
Active
$174,800
2
bds
|
1
ba
|
850
sqft
|
built
1978
4140 NW 90th Ave, Coral Springs, FL 33065
$-208
Cash flow
-6.2%
Cash-on-Cash Return
4.7%
Cap rate
1.0%
Rent to Value Ratio
614 out of 718 properties for sale in Coral Springs, FL
Limited Results Shown
Create a free account, or log in to reveal all property listings and enjoy the complete experience.

Active
$678,900
4
bds
|
2
ba
|
2,192
sqft
|
built
1996
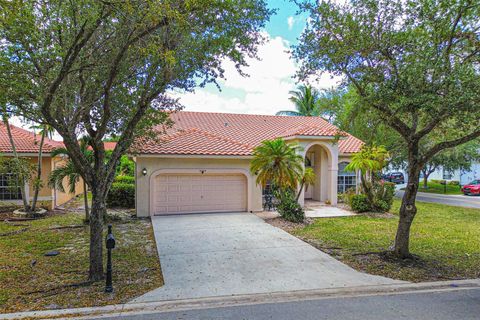
5352 NW 57th Ter, Coral Springs, FL 33067
$-2,100
Cash flow
-16.1%
Cash-on-Cash Return
2.4%
Cap rate
0.5%
Rent to Value Ratio
Active
$630,000
3
bds
|
3
ba
|
2,160
sqft
|
built
1999
922 NW 127th Ave, Coral Springs, FL 33071
$-1,695
Cash flow
-14.0%
Cash-on-Cash Return
2.9%
Cap rate
0.6%
Rent to Value Ratio

Active
$625,000
3
bds
|
3
ba
|
1,536
sqft
|
built
1979
10560 La Placida Dr, Coral Springs, FL 33065
$-1,252
Cash flow
-10.5%
Cash-on-Cash Return
3.7%
Cap rate
0.6%
Rent to Value Ratio
Active
$624,999
4
bds
|
2
ba
|
1,834
sqft
|
built
1996
11655 NW 54th St, Coral Springs, FL 33076
$-1,286
Cash flow
-10.7%
Cash-on-Cash Return
3.7%
Cap rate
0.6%
Rent to Value Ratio
Active
$625,000
3
bds
|
3
ba
|
1,788
sqft
|
built
1979
3536 NW 73rd Way, Coral Springs, FL 33065
$-1,069
Cash flow
-8.9%
Cash-on-Cash Return
4.1%
Cap rate
0.7%
Rent to Value Ratio
Active
$345,000
3
bds
|
3
ba
|
1,500
sqft
|
built
1980
9050 NW 28th St, Coral Springs, FL 33065
$-1,043
Cash flow
-15.8%
Cash-on-Cash Return
2.5%
Cap rate
0.8%
Rent to Value Ratio
Active
$415,000
3
bds
|
2
ba
|
966
sqft
|
built
1983
3161 Coral Ridge Dr, Coral Springs, FL 33065
$-1,526
Cash flow
-19.2%
Cash-on-Cash Return
1.7%
Cap rate
0.5%
Rent to Value Ratio
Active
$790,000
4
bds
|
3
ba
|
2,703
sqft
|
built
1981
940 NW 110th Ln, Coral Springs, FL 33071
$-800
Cash flow
-5.3%
Cash-on-Cash Return
4.9%
Cap rate
0.7%
Rent to Value Ratio
Active
$1,350,000
4
bds
|
4
ba
|
3,531
sqft
|
built
1985
5355 NW 77th Ter, Coral Springs, FL 33067
$-4,805
Cash flow
-18.6%
Cash-on-Cash Return
1.9%
Cap rate
0.4%
Rent to Value Ratio

Active
$685,000
4
bds
|
2
ba
|
2,343
sqft
|
built
1990
9677 N Springs Way, Coral Springs, FL 33076
$-999
Cash flow
-7.6%
Cash-on-Cash Return
4.4%
Cap rate
0.7%
Rent to Value Ratio
Active
$198,990
2
bds
|
2
ba
|
850
sqft
|
built
1984
11329 Royal Palm Blvd, Coral Springs, FL 33065
$-491
Cash flow
-12.9%
Cash-on-Cash Return
3.2%
Cap rate
1.0%
Rent to Value Ratio
Active
$190,000
2
bds
|
2
ba
|
937
sqft
|
built
1974
11651 Royal Palm Blvd, Coral Springs, FL 33065
$-462
Cash flow
-12.7%
Cash-on-Cash Return
3.2%
Cap rate
1.1%
Rent to Value Ratio
Active
$750,000
4
bds
|
3
ba
|
2,340
sqft
|
built
1996
1008 NW 116th Ave, Coral Springs, FL 33071
$-2,356
Cash flow
-16.4%
Cash-on-Cash Return
2.4%
Cap rate
0.5%
Rent to Value Ratio
Active
$675,900
3
bds
|
2
ba
|
1,838
sqft
|
built
1989
3700 NW 104th Ave, Coral Springs, FL 33065
$-1,413
Cash flow
-10.9%
Cash-on-Cash Return
3.6%
Cap rate
0.5%
Rent to Value Ratio
Active
$174,800
2
bds
|
1
ba
|
850
sqft
|
built
1978
4140 NW 90th Ave, Coral Springs, FL 33065
$-208
Cash flow
-6.2%
Cash-on-Cash Return
4.7%
Cap rate
1.0%
Rent to Value Ratio

Active
$245,000
2
bds
|
2
ba
|
1,000
sqft
|
built
1987
875 Riverside Dr, Coral Springs, FL 33071
$-891
Cash flow
-19.0%
Cash-on-Cash Return
1.8%
Cap rate
0.8%
Rent to Value Ratio
Active
$174,900
2
bds
|
2
ba
|
945
sqft
|
built
1974
8704 NW 35th St, Coral Springs, FL 33065
$-78
Cash flow
-2.3%
Cash-on-Cash Return
5.6%
Cap rate
1.1%
Rent to Value Ratio

Active
$459,000
2
bds
|
2
ba
|
1,360
sqft
|
built
1972
3820 Coral Springs Dr, Coral Springs, FL 33065
$-885
Cash flow
-10.1%
Cash-on-Cash Return
3.8%
Cap rate
0.6%
Rent to Value Ratio

Active
$870,000
4
bds
|
3
ba
|
2,286
sqft
|
built
1990
10422 NW 50th Pl, Coral Springs, FL 33076
$-2,052
Cash flow
-12.3%
Cash-on-Cash Return
3.3%
Cap rate
0.6%
Rent to Value Ratio
Active
$698,000
3
bds
|
2
ba
|
2,372
sqft
|
built
1980
8933 NW 3rd Ct, Coral Springs, FL 33071
$-1,180
Cash flow
-8.8%
Cash-on-Cash Return
4.1%
Cap rate
0.6%
Rent to Value Ratio

Active
$895,000
4
bds
|
3
ba
|
2,620
sqft
|
built
1986
8663 NW 50th Dr, Coral Springs, FL 33067
$-935
Cash flow
-5.5%
Cash-on-Cash Return
4.9%
Cap rate
0.7%
Rent to Value Ratio
Active
$359,900
3
bds
|
3
ba
|
1,500
sqft
|
built
2005
3134 Coral Ridge Dr, Coral Springs, FL 33065
$-822
Cash flow
-11.9%
Cash-on-Cash Return
3.4%
Cap rate
0.7%
Rent to Value Ratio
Active
$675,000
4
bds
|
2
ba
|
2,079
sqft
|
built
1994
5794 NW 48th Dr, Coral Springs, FL 33067
$-1,332
Cash flow
-10.3%
Cash-on-Cash Return
3.8%
Cap rate
0.6%
Rent to Value Ratio
Active
$1,060,000
4
bds
|
3
ba
|
2,696
sqft
|
built
1989
12444 Classic Dr, Coral Springs, FL 33071
$-3,486
Cash flow
-17.2%
Cash-on-Cash Return
2.2%
Cap rate
0.5%
Rent to Value Ratio
Active
$749,999
4
bds
|
3
ba
|
2,530
sqft
|
built
1986
8899 NW 47th Dr, Coral Springs, FL 33067
$-1,098
Cash flow
-7.6%
Cash-on-Cash Return
4.4%
Cap rate
0.7%
Rent to Value Ratio
Active
$785,000
4
bds
|
2
ba
|
2,130
sqft
|
built
1980
8538 NW 21st Mnr, Coral Springs, FL 33071
$-1,727
Cash flow
-11.5%
Cash-on-Cash Return
3.5%
Cap rate
0.5%
Rent to Value Ratio
Active
$220,000
2
bds
|
2
ba
|
892
sqft
|
built
1984
10724 Royal Palm Blvd, Coral Springs, FL 33065
$-697
Cash flow
-16.5%
Cash-on-Cash Return
2.3%
Cap rate
0.9%
Rent to Value Ratio
Active
$810,000
4
bds
|
2
ba
|
2,378
sqft
|
built
1995
5374 NW 57th Ave, Coral Springs, FL 33067
$-1,674
Cash flow
-10.8%
Cash-on-Cash Return
3.7%
Cap rate
0.5%
Rent to Value Ratio
Active
$594,900
3
bds
|
4
ba
|
2,593
sqft
|
built
1970
7801 NW 40th St, Coral Springs, FL 33065
$-1,266
Cash flow
-11.1%
Cash-on-Cash Return
3.6%
Cap rate
0.7%
Rent to Value Ratio
Active
$689,000
3
bds
|
2
ba
|
1,838
sqft
|
built
2001
5817 NW 120th Ave, Coral Springs, FL 33076
$-1,968
Cash flow
-14.9%
Cash-on-Cash Return
2.7%
Cap rate
0.6%
Rent to Value Ratio

Active
$599,000
3
bds
|
3
ba
|
2,006
sqft
|
built
1981
3750 NW 73rd Way, Coral Springs, FL 33065
$-891
Cash flow
-7.8%
Cash-on-Cash Return
4.4%
Cap rate
0.7%
Rent to Value Ratio
Active
$599,000
3
bds
|
3
ba
|
2,192
sqft
|
built
1997
4004 NW 61st Ter, Coral Springs, FL 33067
$-1,594
Cash flow
-13.9%
Cash-on-Cash Return
3.0%
Cap rate
0.6%
Rent to Value Ratio

Active
$349,900
3
bds
|
3
ba
|
1,604
sqft
|
built
1982
1616 Cypress Pointe Dr, Coral Springs, FL 33071
$-1,261
Cash flow
-18.8%
Cash-on-Cash Return
1.8%
Cap rate
0.7%
Rent to Value Ratio
Active
$295,000
2
bds
|
2
ba
|
1,000
sqft
|
built
1990
9977 Westview Dr, Coral Springs, FL 33076
$-633
Cash flow
-11.2%
Cash-on-Cash Return
3.6%
Cap rate
0.8%
Rent to Value Ratio
Active
$170,000
2
bds
|
2
ba
|
850
sqft
|
built
1984
11307 Royal Palm Blvd, Coral Springs, FL 33065
$-451
Cash flow
-13.8%
Cash-on-Cash Return
3.0%
Cap rate
1.1%
Rent to Value Ratio
Active
$234,800
2
bds
|
2
ba
|
937
sqft
|
built
1974
11651 Royal Palm Blvd, Coral Springs, FL 33065
$-770
Cash flow
-17.1%
Cash-on-Cash Return
2.2%
Cap rate
0.9%
Rent to Value Ratio

Active
$1,100,000
5
bds
|
3
ba
|
3,145
sqft
|
built
1989
12041 NW 2nd Dr, Coral Springs, FL 33071
$-908
Cash flow
-4.3%
Cash-on-Cash Return
5.2%
Cap rate
0.7%
Rent to Value Ratio
Active
$550,000
3
bds
|
2
ba
|
1,390
sqft
|
built
1988
2370 NW 122nd Dr, Coral Springs, FL 33065
$-1,319
Cash flow
-12.5%
Cash-on-Cash Return
3.3%
Cap rate
0.6%
Rent to Value Ratio
Active
$425,000
3
bds
|
2
ba
|
1,845
sqft
|
built
1994
12342 NW 10th Dr, Coral Springs, FL 33071
$-1,517
Cash flow
-18.6%
Cash-on-Cash Return
1.9%
Cap rate
0.7%
Rent to Value Ratio
Active
$735,000
4
bds
|
2
ba
|
2,000
sqft
|
built
1987
5940 NW 52nd St, Coral Springs, FL 33067
$-1,425
Cash flow
-10.1%
Cash-on-Cash Return
3.8%
Cap rate
0.6%
Rent to Value Ratio