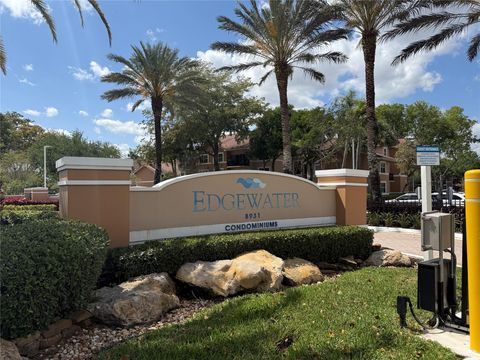
Coral Springs, FL Investment Properties for Sale
Browse homes for sale and investment properties in Coral Springs, FL. Refine your search by price, property type, or more.
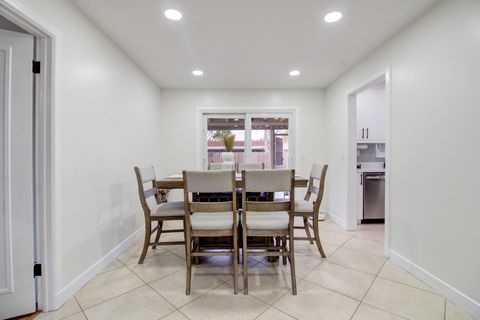
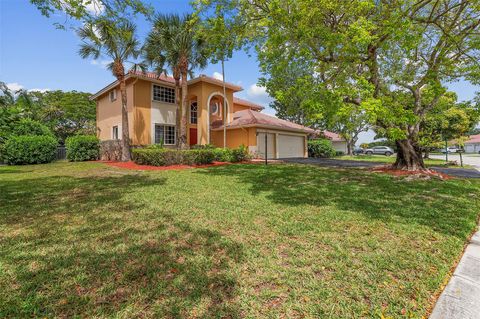
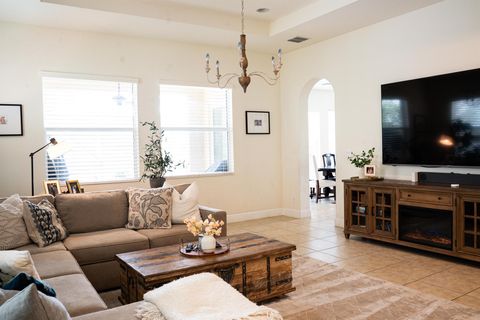
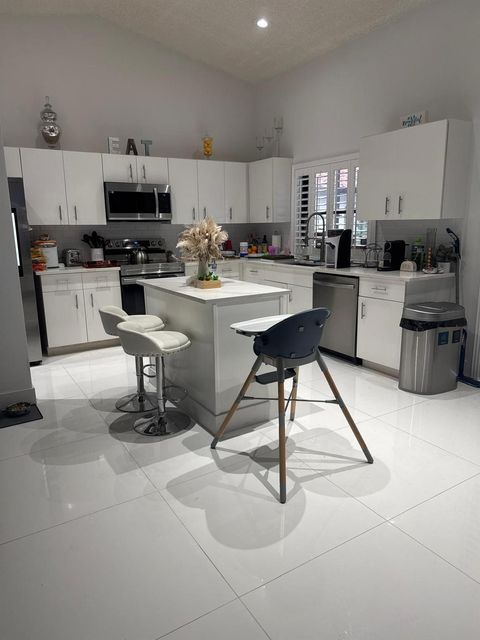
Best cash flowing properties in Coral Springs, FL
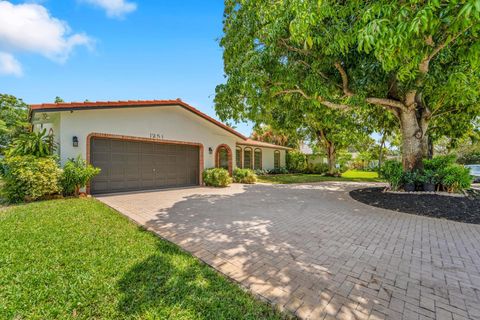
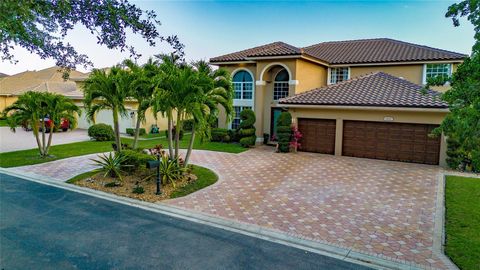
Active
$615,000
4
bds
|
2
ba
|
1,880
sqft
|
built
1975
1251 NW 85th Ter, Coral Springs, FL 33071
$-390
Cash flow
-3.3%
Cash-on-Cash Return
5.4%
Cap rate
0.7%
Rent to Value Ratio

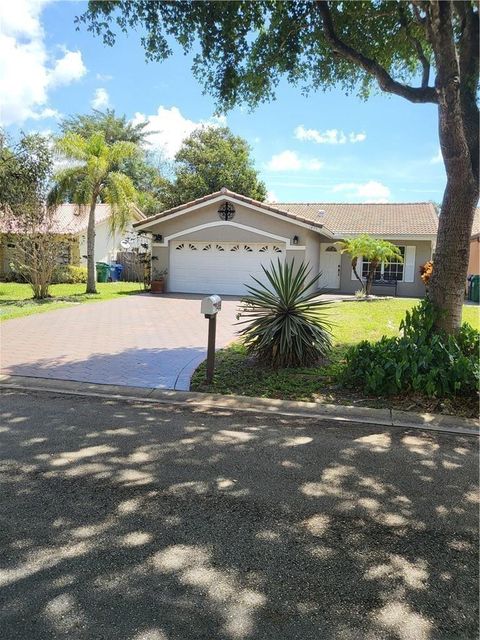
Active
$185,000
2
bds
|
2
ba
|
768
sqft
|
built
1983
10106 Twin Lakes Dr, Coral Springs, FL 33071
$-565
Cash flow
-15.9%
Cash-on-Cash Return
2.5%
Cap rate
1.0%
Rent to Value Ratio
541 out of 722 properties for sale in Coral Springs, FL
Limited Results Shown
Create a free account, or log in to reveal all property listings and enjoy the complete experience.

Active
$959,990
4
bds
|
5
ba
|
3,545
sqft
|
built
1999
6777 NW 44th Ct, Coral Springs, FL 33067
$-2,070
Cash flow
-11.3%
Cash-on-Cash Return
3.6%
Cap rate
0.6%
Rent to Value Ratio
Active
$715,000
4
bds
|
3
ba
|
2,176
sqft
|
built
1991
3980 Wild Lime Ln, Coral Springs, FL 33065
$-1,135
Cash flow
-8.3%
Cash-on-Cash Return
4.2%
Cap rate
0.7%
Rent to Value Ratio

Active
$815,000
4
bds
|
3
ba
|
2,262
sqft
|
built
1986
5197 NW 58th Ter, Coral Springs, FL 33067
$-1,424
Cash flow
-9.1%
Cash-on-Cash Return
4.1%
Cap rate
0.6%
Rent to Value Ratio
Active
$219,999
2
bds
|
2
ba
|
1,000
sqft
|
built
1979
9150 NW 38th Dr, Coral Springs, FL 33065
$-769
Cash flow
-18.2%
Cash-on-Cash Return
2.0%
Cap rate
0.9%
Rent to Value Ratio
Active
$780,000
3
bds
|
2
ba
|
1,961
sqft
|
built
1974
10300 NW 44th St, Coral Springs, FL 33065
$-2,076
Cash flow
-13.9%
Cash-on-Cash Return
3.0%
Cap rate
0.5%
Rent to Value Ratio
Active
$624,000
3
bds
|
2
ba
|
1,644
sqft
|
built
2001
5847 NW 120th Ave, Coral Springs, FL 33076
$-1,744
Cash flow
-14.6%
Cash-on-Cash Return
2.8%
Cap rate
0.6%
Rent to Value Ratio
Active
$1,150,000
4
bds
|
3
ba
|
3,134
sqft
|
built
1989
4699 Rothschild Dr, Coral Springs, FL 33067
$-3,152
Cash flow
-14.3%
Cash-on-Cash Return
2.9%
Cap rate
0.5%
Rent to Value Ratio
Active
$210,000
2
bds
|
2
ba
|
0
sqft
|
built
1982
10068 Twin Lakes Dr, Coral Springs, FL 33071
$-747
Cash flow
-18.6%
Cash-on-Cash Return
1.9%
Cap rate
0.9%
Rent to Value Ratio
Active
$259,000
2
bds
|
2
ba
|
1,168
sqft
|
built
1981
2850 Forest Hills Blvd, Coral Springs, FL 33065
$-588
Cash flow
-11.8%
Cash-on-Cash Return
3.4%
Cap rate
0.8%
Rent to Value Ratio
Active
$1,349,000
6
bds
|
5
ba
|
3,621
sqft
|
built
2002
6600 NW 56th Dr, Coral Springs, FL 33067
$-5,268
Cash flow
-20.4%
Cash-on-Cash Return
1.5%
Cap rate
0.4%
Rent to Value Ratio

Active
$259,000
2
bds
|
2
ba
|
1,114
sqft
|
built
1990
11229 W Atlantic Blvd, Coral Springs, FL 33071
$-676
Cash flow
-13.6%
Cash-on-Cash Return
3.0%
Cap rate
0.8%
Rent to Value Ratio
Active
$185,000
2
bds
|
2
ba
|
768
sqft
|
built
1983
10106 Twin Lakes Dr, Coral Springs, FL 33071
$-565
Cash flow
-15.9%
Cash-on-Cash Return
2.5%
Cap rate
1.0%
Rent to Value Ratio
Active
$599,900
4
bds
|
3
ba
|
1,725
sqft
|
built
1985
1499 NW 97th Ter, Coral Springs, FL 33071
$-1,085
Cash flow
-9.4%
Cash-on-Cash Return
4.0%
Cap rate
0.7%
Rent to Value Ratio
Active
$799,000
4
bds
|
2
ba
|
1,909
sqft
|
built
1981
1260 NW 112th Way, Coral Springs, FL 33071
$-1,611
Cash flow
-10.5%
Cash-on-Cash Return
3.7%
Cap rate
0.6%
Rent to Value Ratio

Active
$267,000
3
bds
|
2
ba
|
1,270
sqft
|
built
1983
2091 Coral Ridge Dr, Coral Springs, FL 33071
$-636
Cash flow
-12.4%
Cash-on-Cash Return
3.3%
Cap rate
0.9%
Rent to Value Ratio
Active
$844,900
4
bds
|
2
ba
|
2,352
sqft
|
built
1988
5264 NW 89th Dr, Coral Springs, FL 33067
$-2,100
Cash flow
-13.0%
Cash-on-Cash Return
3.2%
Cap rate
0.6%
Rent to Value Ratio
Active
$249,000
2
bds
|
2
ba
|
984
sqft
|
built
2005
9033 Wiles Rd, Coral Springs, FL 33067
$-880
Cash flow
-18.4%
Cash-on-Cash Return
1.9%
Cap rate
0.9%
Rent to Value Ratio
Active
$615,000
3
bds
|
2
ba
|
2,091
sqft
|
built
1987
1820 Monte Carlo Way, Coral Springs, FL 33071
$-1,679
Cash flow
-14.2%
Cash-on-Cash Return
2.9%
Cap rate
0.6%
Rent to Value Ratio
Active
$719,000
4
bds
|
2
ba
|
2,307
sqft
|
built
1979
9780 NW 5th Ct, Coral Springs, FL 33071
$-1,471
Cash flow
-10.7%
Cash-on-Cash Return
3.7%
Cap rate
0.6%
Rent to Value Ratio
Active
$699,000
4
bds
|
3
ba
|
2,219
sqft
|
built
1988
11985 NW 2nd Mnr, Coral Springs, FL 33071
$-1,496
Cash flow
-11.2%
Cash-on-Cash Return
3.6%
Cap rate
0.6%
Rent to Value Ratio
Active
$624,900
3
bds
|
2
ba
|
1,973
sqft
|
built
1970
3207 NW 89th Ter, Coral Springs, FL 33065
$-1,347
Cash flow
-11.2%
Cash-on-Cash Return
3.6%
Cap rate
0.6%
Rent to Value Ratio
Active
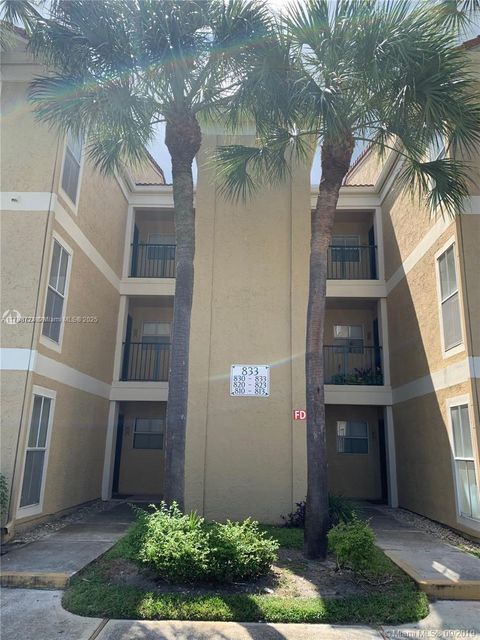
$219,900
2
bds
|
1
ba
|
980
sqft
|
built
1987
833 Riverside Dr, Coral Springs, FL 33071
$-788
Cash flow
-18.7%
Cash-on-Cash Return
1.8%
Cap rate
0.9%
Rent to Value Ratio

Active
$880,000
4
bds
|
3
ba
|
2,910
sqft
|
built
2021
8650 NW 39th Ct, Coral Springs, FL 33065
$-3,018
Cash flow
-17.9%
Cash-on-Cash Return
2.0%
Cap rate
0.5%
Rent to Value Ratio

Active
$619,950
3
bds
|
2
ba
|
1,810
sqft
|
built
1980
11430 NW 39th Ct, Coral Springs, FL 33065
$-1,070
Cash flow
-9.0%
Cash-on-Cash Return
4.1%
Cap rate
0.6%
Rent to Value Ratio
Active
$794,000
4
bds
|
2
ba
|
2,449
sqft
|
built
1979
118 SW 100th Ter, Coral Springs, FL 33071
$-1,818
Cash flow
-11.9%
Cash-on-Cash Return
3.4%
Cap rate
0.6%
Rent to Value Ratio

Active
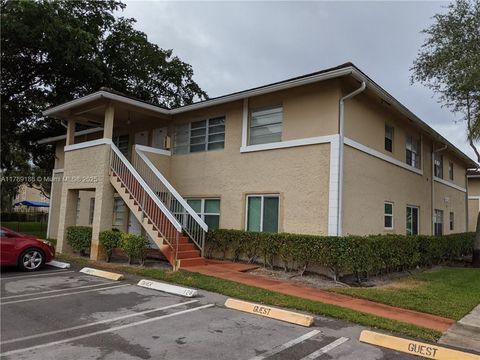
$250,000
2
bds
|
2
ba
|
1,060
sqft
|
built
1987
805 Riverside Dr, Coral Springs, FL 33071
$-799
Cash flow
-16.7%
Cash-on-Cash Return
2.3%
Cap rate
0.9%
Rent to Value Ratio

Active
$620,000
3
bds
|
2
ba
|
1,805
sqft
|
built
1971
3971 NW 108th Dr, Coral Springs, FL 33065
$-988
Cash flow
-8.3%
Cash-on-Cash Return
4.2%
Cap rate
0.6%
Rent to Value Ratio
Active
$190,000
2
bds
|
2
ba
|
768
sqft
|
built
1982
10192 Twin Lakes Dr, Coral Springs, FL 33071
$-667
Cash flow
-18.3%
Cash-on-Cash Return
1.9%
Cap rate
0.9%
Rent to Value Ratio
Active
$630,000
3
bds
|
2
ba
|
1,500
sqft
|
built
1973
11922 NW 26th Pl, Coral Springs, FL 33065
$-1,362
Cash flow
-11.3%
Cash-on-Cash Return
3.6%
Cap rate
0.6%
Rent to Value Ratio

Active
$420,000
3
bds
|
3
ba
|
1,800
sqft
|
built
1991
5001 Riverside Dr, Coral Springs, FL 33067
$-930
Cash flow
-11.6%
Cash-on-Cash Return
3.5%
Cap rate
0.9%
Rent to Value Ratio
Active
$859,000
5
bds
|
4
ba
|
2,454
sqft
|
built
1997
5408 NW 109th Ln, Coral Springs, FL 33076
$-1,687
Cash flow
-10.2%
Cash-on-Cash Return
3.8%
Cap rate
0.7%
Rent to Value Ratio

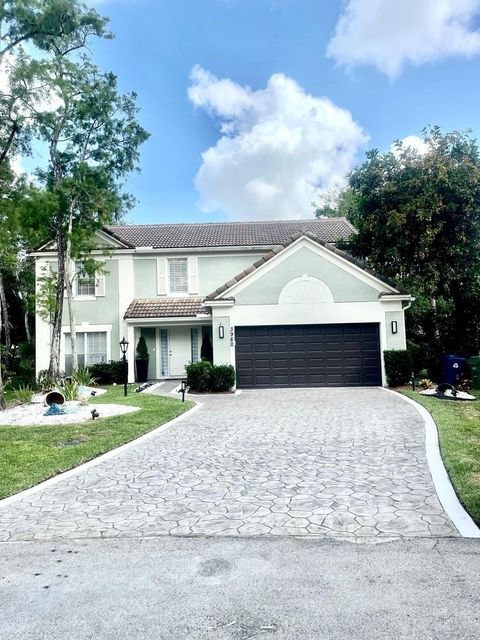
Active
$871,000
bds
|
0
ba
|
3,063
sqft
|
built
1972
11220 NW 39th St, Coral Springs, FL 33065
$-4,304
Cash flow
-25.8%
Cash-on-Cash Return
0.2%
Cap rate
0.2%
Rent to Value Ratio
Active
$1,225,000
5
bds
|
4
ba
|
3,281
sqft
|
built
2012
8213 NW 121st Way, Coral Springs, FL 33076
$-3,783
Cash flow
-16.1%
Cash-on-Cash Return
2.4%
Cap rate
0.5%
Rent to Value Ratio
Active
$900,000
4
bds
|
2
ba
|
2,230
sqft
|
built
1988
260 NW 121st Ter, Coral Springs, FL 33071
$-1,942
Cash flow
-11.3%
Cash-on-Cash Return
3.6%
Cap rate
0.6%
Rent to Value Ratio
Active
$999,999
5
bds
|
4
ba
|
3,282
sqft
|
built
2000
4835 NW 124th Way, Coral Springs, FL 33076
$-2,621
Cash flow
-13.7%
Cash-on-Cash Return
3.0%
Cap rate
0.5%
Rent to Value Ratio
Active
$615,000
4
bds
|
2
ba
|
1,880
sqft
|
built
1975
1251 NW 85th Ter, Coral Springs, FL 33071
$-390
Cash flow
-3.3%
Cash-on-Cash Return
5.4%
Cap rate
0.7%
Rent to Value Ratio
Active
$684,999
5
bds
|
3
ba
|
2,512
sqft
|
built
2001
12656 NW 6th Ct, Coral Springs, FL 33071
$-2,392
Cash flow
-18.2%
Cash-on-Cash Return
2.0%
Cap rate
0.6%
Rent to Value Ratio
Active
$550,000
3
bds
|
3
ba
|
1,803
sqft
|
built
1994
11734 NW 1st Ct, Coral Springs, FL 33071
$-1,594
Cash flow
-15.1%
Cash-on-Cash Return
2.7%
Cap rate
0.6%
Rent to Value Ratio
Active
$259,999
2
bds
|
2
ba
|
986
sqft
|
built
1991
9266 W Atlantic Blvd, Coral Springs, FL 33071
$-834
Cash flow
-16.7%
Cash-on-Cash Return
2.3%
Cap rate
0.8%
Rent to Value Ratio
Active
$678,000
4
bds
|
3
ba
|
2,328
sqft
|
built
1993
11963 Glenmore Dr, Coral Springs, FL 33071
$-1,889
Cash flow
-14.5%
Cash-on-Cash Return
2.8%
Cap rate
0.7%
Rent to Value Ratio