Coral Springs, FL Investment Properties for Sale
Browse homes for sale and investment properties in Coral Springs, FL. Refine your search by price, property type, or more.
Best cash flowing properties in Coral Springs, FL
Active
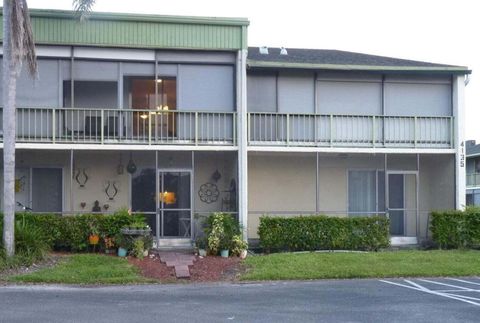
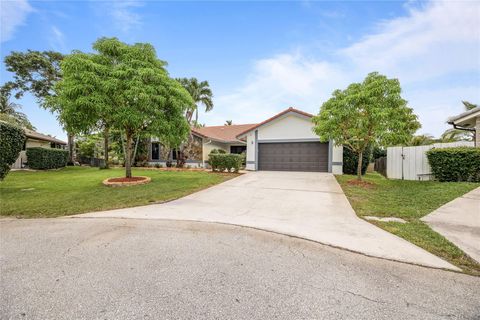
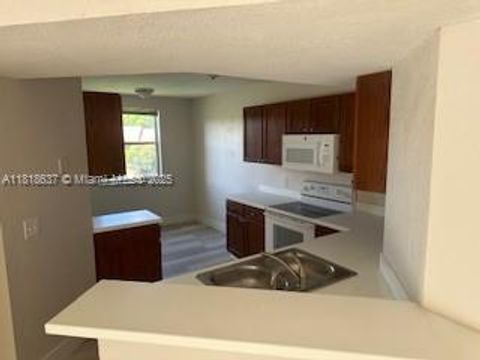
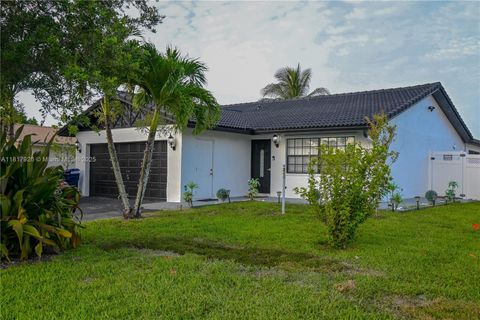
$162,000
2
bds
|
1
ba
|
850
sqft
|
built
1980
4163 NW 90th Ave, Coral Springs, FL 33065
$-159
Cash flow
-5.1%
Cash-on-Cash Return
5.0%
Cap rate
1.0%
Rent to Value Ratio
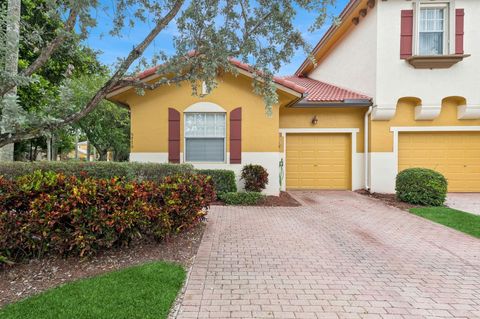
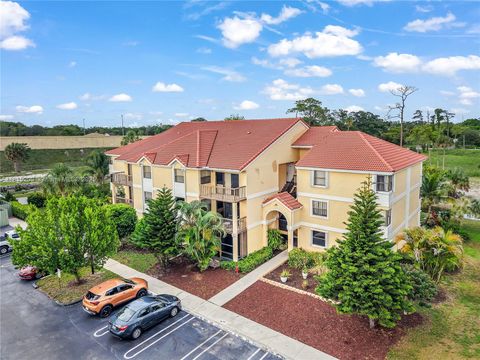
Active
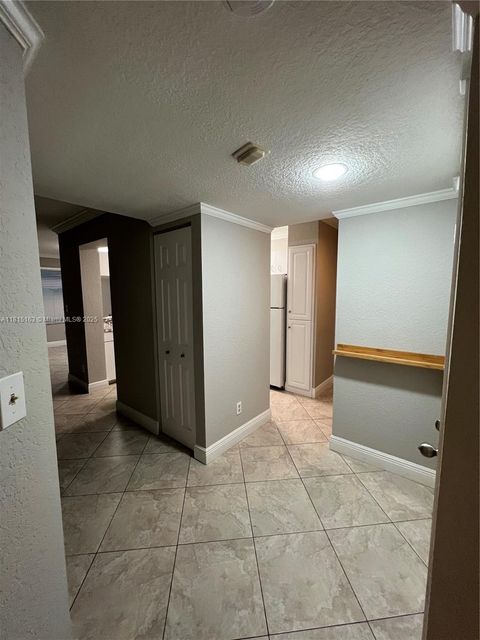
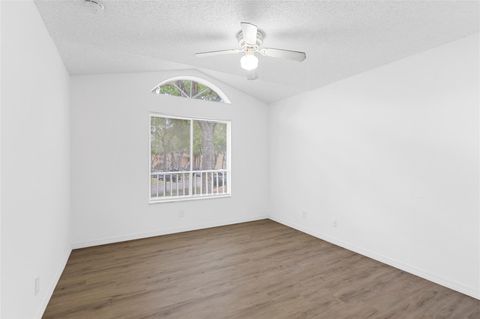
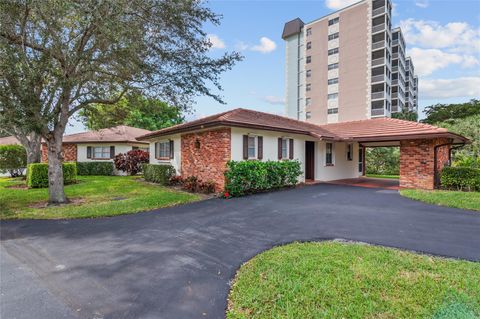
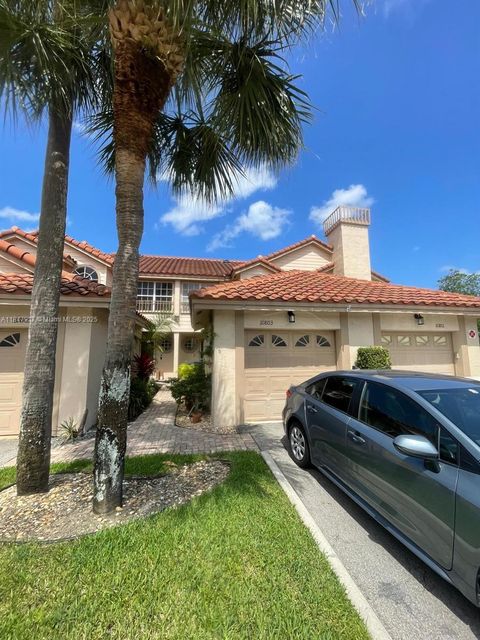
$190,000
1
bds
|
1
ba
|
816
sqft
|
built
1988
1097 Coral Club Dr, Coral Springs, FL 33071
$-313
Cash flow
-8.6%
Cash-on-Cash Return
4.2%
Cap rate
1.1%
Rent to Value Ratio
615 out of 719 properties for sale in Coral Springs, FL
Limited Results Shown
Create a free account, or log in to reveal all property listings and enjoy the complete experience.

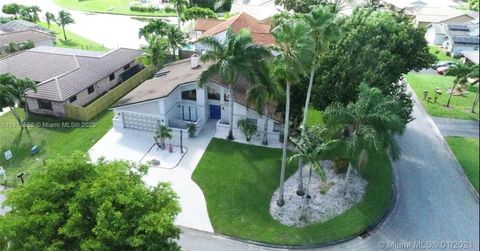
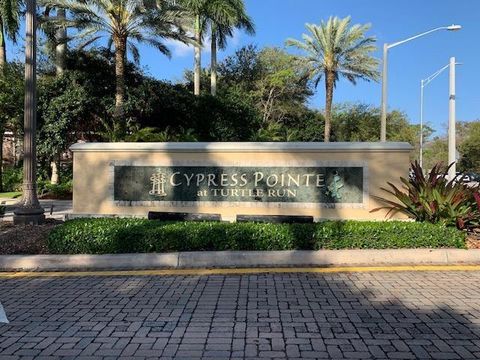
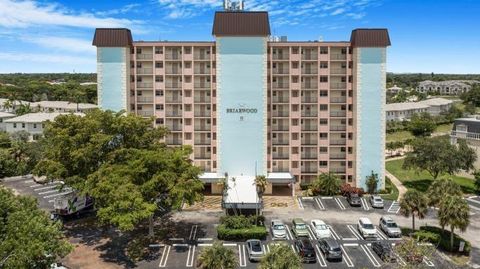
Active
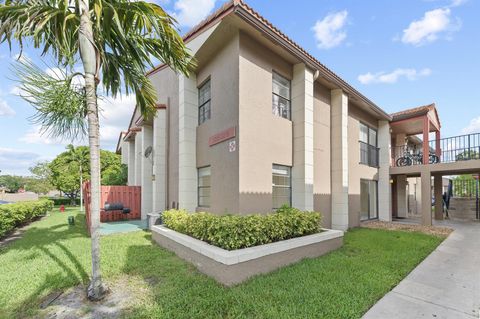
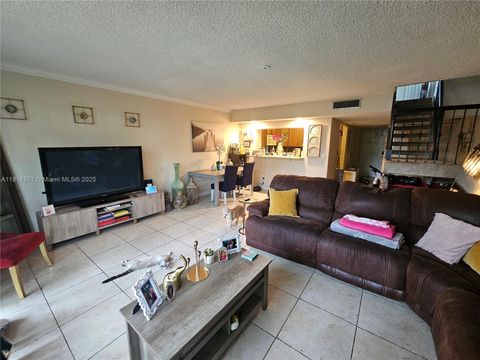
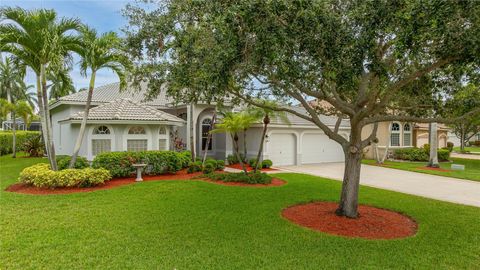
$265,000
2
bds
|
2
ba
|
1,044
sqft
|
built
1988
953 Coral Club Dr, Coral Springs, FL 33071
$-717
Cash flow
-14.1%
Cash-on-Cash Return
2.9%
Cap rate
0.8%
Rent to Value Ratio
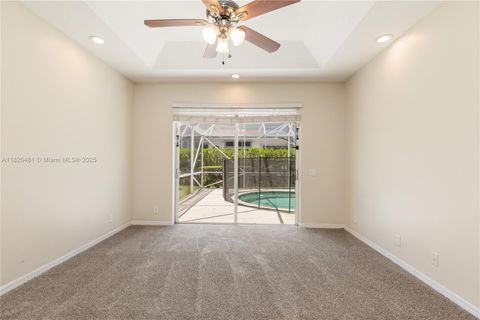
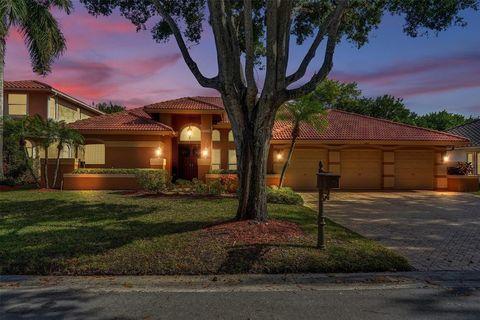
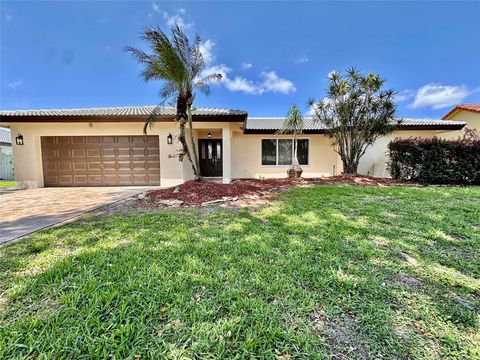
Active
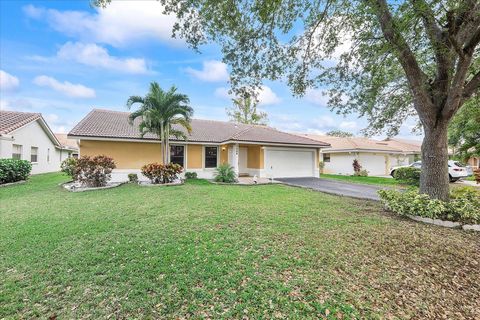
$729,995
4
bds
|
2
ba
|
2,106
sqft
|
built
1984
680 NW 111th Way, Coral Springs, FL 33071
$-1,153
Cash flow
-8.2%
Cash-on-Cash Return
4.3%
Cap rate
0.7%
Rent to Value Ratio
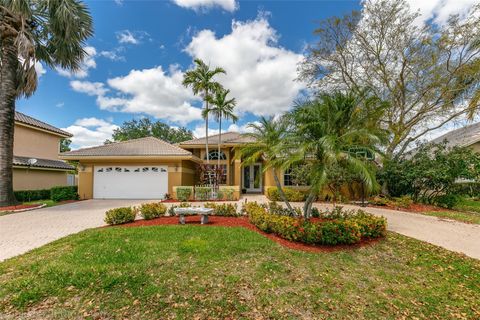
Active
$690,000
4
bds
|
2
ba
|
2,172
sqft
|
built
1996
12123 NW 15th Ct, Coral Springs, FL 33071
$-1,996
Cash flow
-15.1%
Cash-on-Cash Return
2.7%
Cap rate
0.6%
Rent to Value Ratio

Active
$685,000
4
bds
|
2
ba
|
1,954
sqft
|
built
1981
11061 NW 21st St, Coral Springs, FL 33071
$-1,490
Cash flow
-11.3%
Cash-on-Cash Return
3.5%
Cap rate
0.6%
Rent to Value Ratio
Active
$700,000
4
bds
|
3
ba
|
2,566
sqft
|
built
1987
4339 NW 73rd Way, Coral Springs, FL 33065
$-1,026
Cash flow
-7.6%
Cash-on-Cash Return
4.4%
Cap rate
0.7%
Rent to Value Ratio

Active
$680,000
3
bds
|
2
ba
|
2,002
sqft
|
built
1978
639 NW 101st Ter, Coral Springs, FL 33071
$-1,004
Cash flow
-7.7%
Cash-on-Cash Return
4.4%
Cap rate
0.6%
Rent to Value Ratio
Active
$187,000
1
bds
|
1
ba
|
816
sqft
|
built
1988
1084 Coral Club Dr, Coral Springs, FL 33071
$-430
Cash flow
-12.0%
Cash-on-Cash Return
3.4%
Cap rate
1.0%
Rent to Value Ratio
Active
$229,000
3
bds
|
2
ba
|
966
sqft
|
built
1983
3209 Coral Ridge Dr, Coral Springs, FL 33065
$-449
Cash flow
-10.2%
Cash-on-Cash Return
3.8%
Cap rate
1.0%
Rent to Value Ratio

Active
$640,000
bds
|
0
ba
|
2,367
sqft
|
built
1972
11301 NW 39th St, Coral Springs, FL 33065
$-2,312
Cash flow
-18.8%
Cash-on-Cash Return
1.8%
Cap rate
0.3%
Rent to Value Ratio

Active
$750,000
4
bds
|
2
ba
|
1,924
sqft
|
built
1971
4180 NW 103rd Dr, Coral Springs, FL 33065
$-1,791
Cash flow
-12.5%
Cash-on-Cash Return
3.3%
Cap rate
0.6%
Rent to Value Ratio
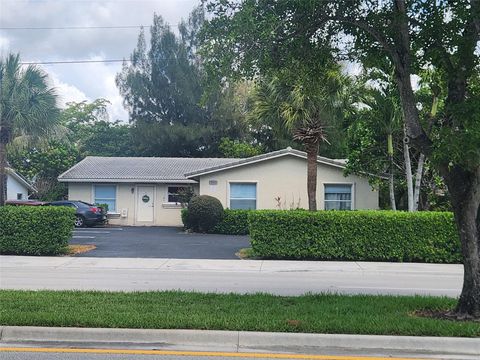
Active
$290,000
3
bds
|
3
ba
|
1,350
sqft
|
built
1975
8401 W Sample Rd, Coral Springs, FL 33065
$-750
Cash flow
-13.5%
Cash-on-Cash Return
3.0%
Cap rate
0.8%
Rent to Value Ratio
Active
$275,000
3
bds
|
2
ba
|
1,166
sqft
|
built
1991
8741 Wiles Rd, Coral Springs, FL 33067
$-962
Cash flow
-18.3%
Cash-on-Cash Return
2.0%
Cap rate
0.8%
Rent to Value Ratio
Active
$325,000
2
bds
|
2
ba
|
1,048
sqft
|
built
1968
9089 Thunderbird Dr, Coral Springs, FL 33065
$-751
Cash flow
-12.1%
Cash-on-Cash Return
3.4%
Cap rate
0.7%
Rent to Value Ratio
Active
$162,000
2
bds
|
1
ba
|
850
sqft
|
built
1980
4163 NW 90th Ave, Coral Springs, FL 33065
$-159
Cash flow
-5.1%
Cash-on-Cash Return
5.0%
Cap rate
1.0%
Rent to Value Ratio
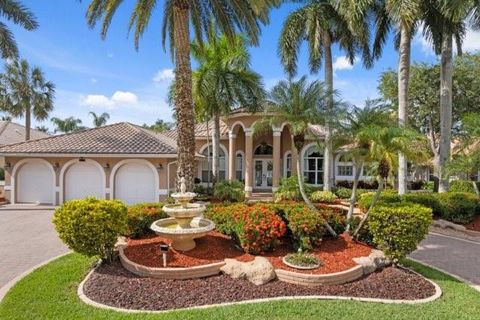
Active
$945,000
5
bds
|
3
ba
|
2,722
sqft
|
built
1995
4940 Kensington Cir, Coral Springs, FL 33076
$-1,889
Cash flow
-10.4%
Cash-on-Cash Return
3.7%
Cap rate
0.6%
Rent to Value Ratio
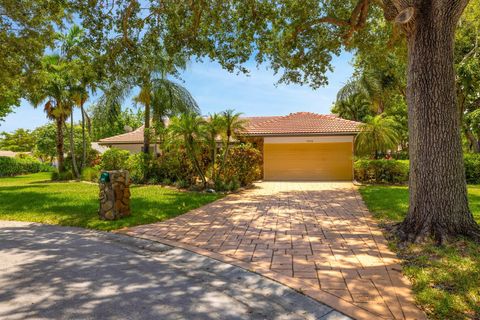
Active
$664,900
4
bds
|
3
ba
|
2,126
sqft
|
built
1989
2326 NW 96th Way, Coral Springs, FL 33065
$-1,473
Cash flow
-11.6%
Cash-on-Cash Return
3.5%
Cap rate
0.5%
Rent to Value Ratio
Active
$564,999
3
bds
|
2
ba
|
1,403
sqft
|
built
1978
9039 NW 21st Ct, Coral Springs, FL 33071
$-1,182
Cash flow
-10.9%
Cash-on-Cash Return
3.6%
Cap rate
0.6%
Rent to Value Ratio
Active
$1,297,500
4
bds
|
4
ba
|
2,911
sqft
|
built
1974
9540 NW 39th Ct, Coral Springs, FL 33065
$-3,931
Cash flow
-15.8%
Cash-on-Cash Return
2.5%
Cap rate
0.4%
Rent to Value Ratio
Active
$750,000
4
bds
|
2
ba
|
2,198
sqft
|
built
1988
6351 NW 52nd St, Coral Springs, FL 33067
$-1,180
Cash flow
-8.2%
Cash-on-Cash Return
4.3%
Cap rate
0.7%
Rent to Value Ratio

Active
$575,000
4
bds
|
2
ba
|
1,846
sqft
|
built
1984
4459 NW 113th Ln, Coral Springs, FL 33065
$-1,204
Cash flow
-10.9%
Cash-on-Cash Return
3.6%
Cap rate
0.6%
Rent to Value Ratio
Active
$649,900
3
bds
|
2
ba
|
2,200
sqft
|
built
1979
10073 NW 7th Ct, Coral Springs, FL 33071
$-1,318
Cash flow
-10.6%
Cash-on-Cash Return
3.7%
Cap rate
0.5%
Rent to Value Ratio
Active
$635,000
3
bds
|
2
ba
|
1,405
sqft
|
built
1979
2449 NW 123rd Ave, Coral Springs, FL 33065
$-1,077
Cash flow
-8.8%
Cash-on-Cash Return
4.1%
Cap rate
0.7%
Rent to Value Ratio
Active
$309,900
2
bds
|
3
ba
|
1,190
sqft
|
built
1988
10803 Cypress Glen Dr, Coral Springs, FL 33071
$-1,249
Cash flow
-21.0%
Cash-on-Cash Return
1.3%
Cap rate
0.7%
Rent to Value Ratio

Active
$819,900
5
bds
|
3
ba
|
2,803
sqft
|
built
1988
5248 NW 89th Dr, Coral Springs, FL 33067
$-1,718
Cash flow
-10.9%
Cash-on-Cash Return
3.6%
Cap rate
0.7%
Rent to Value Ratio
Active
$325,000
2
bds
|
3
ba
|
1,203
sqft
|
built
2003
6976 W Sample Rd, Coral Springs, FL 33067
$-962
Cash flow
-15.4%
Cash-on-Cash Return
2.6%
Cap rate
0.8%
Rent to Value Ratio

Active
$589,000
3
bds
|
2
ba
|
2,079
sqft
|
built
1989
10631 NW 32nd Ct, Coral Springs, FL 33065
$-959
Cash flow
-8.5%
Cash-on-Cash Return
4.2%
Cap rate
0.7%
Rent to Value Ratio
Active
$859,000
4
bds
|
3
ba
|
2,876
sqft
|
built
1988
4493 NW 67th Ave, Coral Springs, FL 33067
$-1,162
Cash flow
-7.1%
Cash-on-Cash Return
4.5%
Cap rate
0.7%
Rent to Value Ratio
Active
$489,000
3
bds
|
2
ba
|
1,532
sqft
|
built
2001
5779 NW 120th Ave, Coral Springs, FL 33076
$-856
Cash flow
-9.1%
Cash-on-Cash Return
4.0%
Cap rate
0.7%
Rent to Value Ratio
Active
$239,000
2
bds
|
2
ba
|
900
sqft
|
built
1971
3575 Broken Woods Dr, Coral Springs, FL 33065
$-562
Cash flow
-12.3%
Cash-on-Cash Return
3.3%
Cap rate
0.9%
Rent to Value Ratio
Active
$699,000
4
bds
|
3
ba
|
2,195
sqft
|
built
1979
8735 NW 1st St, Coral Springs, FL 33071
$-1,494
Cash flow
-11.2%
Cash-on-Cash Return
3.6%
Cap rate
0.5%
Rent to Value Ratio

Active
$619,900
4
bds
|
2
ba
|
1,994
sqft
|
built
1986
5024 NW 58th Ter, Coral Springs, FL 33067
$-750
Cash flow
-6.3%
Cash-on-Cash Return
4.7%
Cap rate
0.7%
Rent to Value Ratio

Active
$195,000
2
bds
|
2
ba
|
768
sqft
|
built
1981
10052 Twin Lakes Dr, Coral Springs, FL 33071
$-499
Cash flow
-13.4%
Cash-on-Cash Return
3.1%
Cap rate
0.9%
Rent to Value Ratio

Active
$1,499,999
4
bds
|
3
ba
|
2,465
sqft
|
built
1974
9550 NW 42nd Ct, Coral Springs, FL 33065
$-3,457
Cash flow
-12.0%
Cash-on-Cash Return
3.4%
Cap rate
0.6%
Rent to Value Ratio
Active
$925,000
5
bds
|
4
ba
|
2,838
sqft
|
built
1991
12655 NW 17th Pl, Coral Springs, FL 33071
$-2,560
Cash flow
-14.4%
Cash-on-Cash Return
2.8%
Cap rate
0.6%
Rent to Value Ratio
Active
$263,000
2
bds
|
2
ba
|
1,133
sqft
|
built
1987
5801 Riverside Dr, Coral Springs, FL 33067
$-921
Cash flow
-18.3%
Cash-on-Cash Return
1.9%
Cap rate
0.8%
Rent to Value Ratio
Active
$951,000
3
bds
|
0
ba
|
2,513
sqft
|
built
1973
3502 Riverside Dr, Coral Springs, FL 33065
$-4,014
Cash flow
-22.0%
Cash-on-Cash Return
1.1%
Cap rate
0.3%
Rent to Value Ratio
Active
$1,495,000
4
bds
|
3
ba
|
3,320
sqft
|
built
1997
11904 NW 9th St, Coral Springs, FL 33071
$-5,268
Cash flow
-18.4%
Cash-on-Cash Return
1.9%
Cap rate
0.4%
Rent to Value Ratio
Active
$769,000
4
bds
|
2
ba
|
2,420
sqft
|
built
1985
5044 NW 90th Ter, Coral Springs, FL 33067
$-1,607
Cash flow
-10.9%
Cash-on-Cash Return
3.6%
Cap rate
0.6%
Rent to Value Ratio
Active
$190,000
1
bds
|
1
ba
|
816
sqft
|
built
1988
1097 Coral Club Dr, Coral Springs, FL 33071
$-313
Cash flow
-8.6%
Cash-on-Cash Return
4.2%
Cap rate
1.1%
Rent to Value Ratio
Active
$775,000
4
bds
|
3
ba
|
2,476
sqft
|
built
1987
8640 NW 50th Dr, Coral Springs, FL 33067
$-1,298
Cash flow
-8.7%
Cash-on-Cash Return
4.1%
Cap rate
0.7%
Rent to Value Ratio