Danvers, MA Investment Properties for Sale
Browse homes for sale and investment properties in Danvers, MA. Refine your search by price, property type, or more.
Best cash flowing properties in Danvers, MA
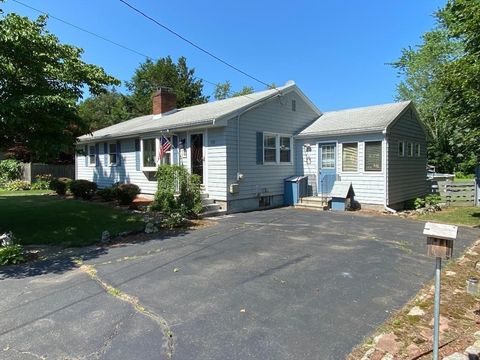
Active
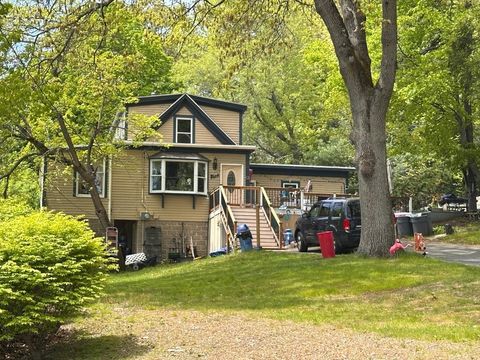
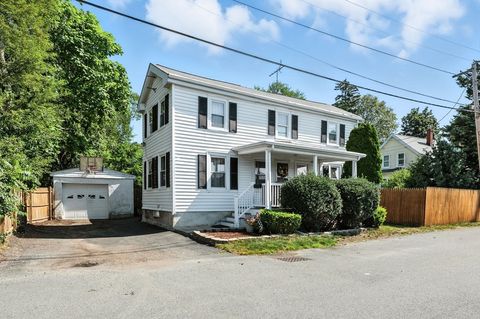
$550,000
5
bds
|
2
ba
|
1,832
sqft
|
built
1900
12 Whipple St, Danvers, MA 01923
$-389
Cash flow
-3.7%
Cash-on-Cash Return
4.8%
Cap rate
0.7%
Rent to Value Ratio
Active
$400,000
2
bds
|
1
ba
|
1,080
sqft
|
built
1900
8 Putnam St, Danvers, MA 01923
$-583
Cash flow
-7.6%
Cash-on-Cash Return
3.9%
Cap rate
0.6%
Rent to Value Ratio
14 out of 17 properties for sale in Danvers, MA
Limited Results Shown
Create a free account, or log in to reveal all property listings and enjoy the complete experience.
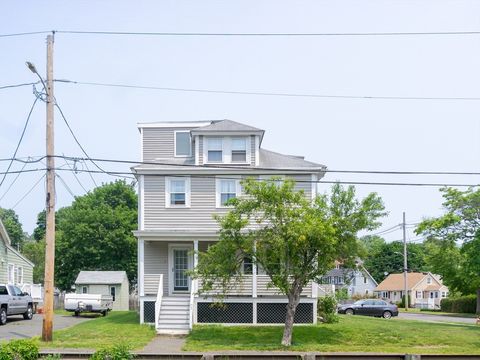
Active
$694,500
5
bds
|
3
ba
|
2,304
sqft
|
built
1880
15 Beacon St, Danvers, MA 01923
$-1,040
Cash flow
-7.8%
Cash-on-Cash Return
3.9%
Cap rate
0.6%
Rent to Value Ratio
Active
$350,000
2
bds
|
1
ba
|
855
sqft
|
built
1880
35 Locust St, Danvers, MA 01923
$-704
Cash flow
-10.5%
Cash-on-Cash Return
3.3%
Cap rate
0.7%
Rent to Value Ratio
Active
$674,900
3
bds
|
2
ba
|
1,700
sqft
|
built
1860
10 Mill St, Danvers, MA 01923
$-1,190
Cash flow
-9.2%
Cash-on-Cash Return
3.6%
Cap rate
0.5%
Rent to Value Ratio
Active
$719,900
3
bds
|
2
ba
|
1,700
sqft
|
built
1965
35 Preston St, Danvers, MA 01923
$-1,260
Cash flow
-9.1%
Cash-on-Cash Return
3.6%
Cap rate
0.6%
Rent to Value Ratio
Active
$599,900
2
bds
|
3
ba
|
1,909
sqft
|
built
2002
35 Collins St, Danvers, MA 01923
$-1,386
Cash flow
-12.1%
Cash-on-Cash Return
2.9%
Cap rate
0.6%
Rent to Value Ratio
Active
$589,900
3
bds
|
2
ba
|
1,548
sqft
|
built
1870
23 Locust St, Danvers, MA 01923
$-937
Cash flow
-8.3%
Cash-on-Cash Return
3.8%
Cap rate
0.7%
Rent to Value Ratio
Active
$659,000
3
bds
|
1
ba
|
1,284
sqft
|
built
1958
110 Forest St, Danvers, MA 01923
$-1,262
Cash flow
-10.0%
Cash-on-Cash Return
3.4%
Cap rate
0.5%
Rent to Value Ratio
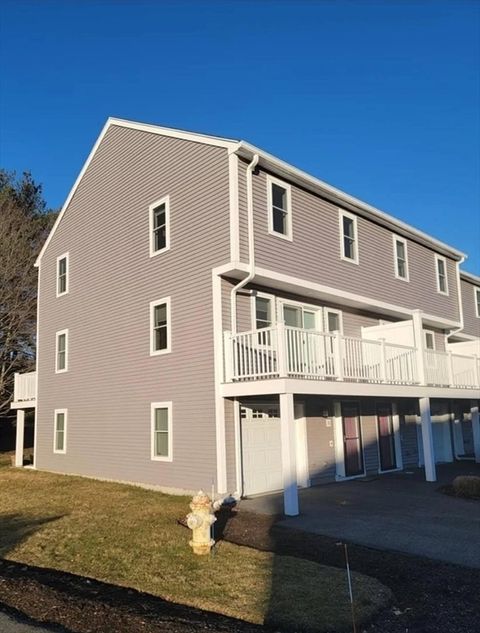
Active
$545,000
2
bds
|
2
ba
|
1,622
sqft
|
built
1988
22 Collins St, Danvers, MA 01923
$-1,293
Cash flow
-12.4%
Cash-on-Cash Return
2.8%
Cap rate
0.6%
Rent to Value Ratio
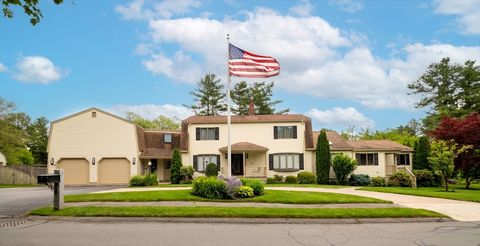
Active
$1,399,999
5
bds
|
4
ba
|
4,348
sqft
|
built
1988
7 Wildwood Rd, Danvers, MA 01923
$-4,300
Cash flow
-16.0%
Cash-on-Cash Return
2.0%
Cap rate
0.4%
Rent to Value Ratio
Active
$429,000
2
bds
|
1
ba
|
1,034
sqft
|
built
1925
21 Brookside Ave, Danvers, MA 01923
$-789
Cash flow
-9.6%
Cash-on-Cash Return
3.5%
Cap rate
0.6%
Rent to Value Ratio
Active
$975,000
3
bds
|
2
ba
|
1,872
sqft
|
built
1930
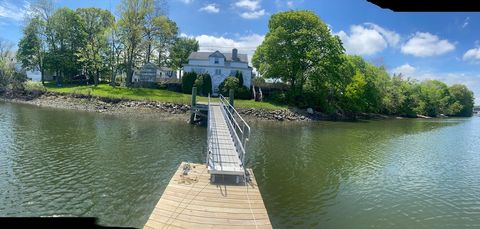
90 Water St, Danvers, MA 01923
$-2,593
Cash flow
-13.9%
Cash-on-Cash Return
2.5%
Cap rate
0.4%
Rent to Value Ratio
Active
$1,395,000
6
bds
|
8
ba
|
5,458
sqft
|
built
1810
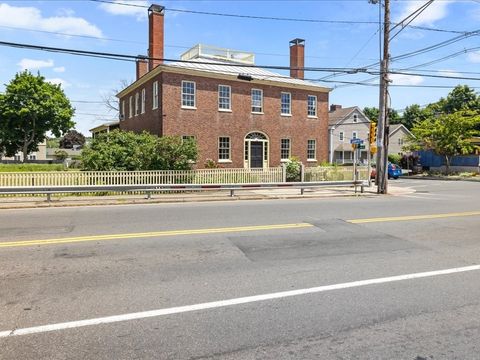
166 High St, Danvers, MA 01923
$-4,321
Cash flow
-16.2%
Cash-on-Cash Return
2.0%
Cap rate
0.3%
Rent to Value Ratio