Delray Beach, FL Investment Properties for Sale
Browse homes for sale and investment properties in Delray Beach, FL. Refine your search by price, property type, or more.
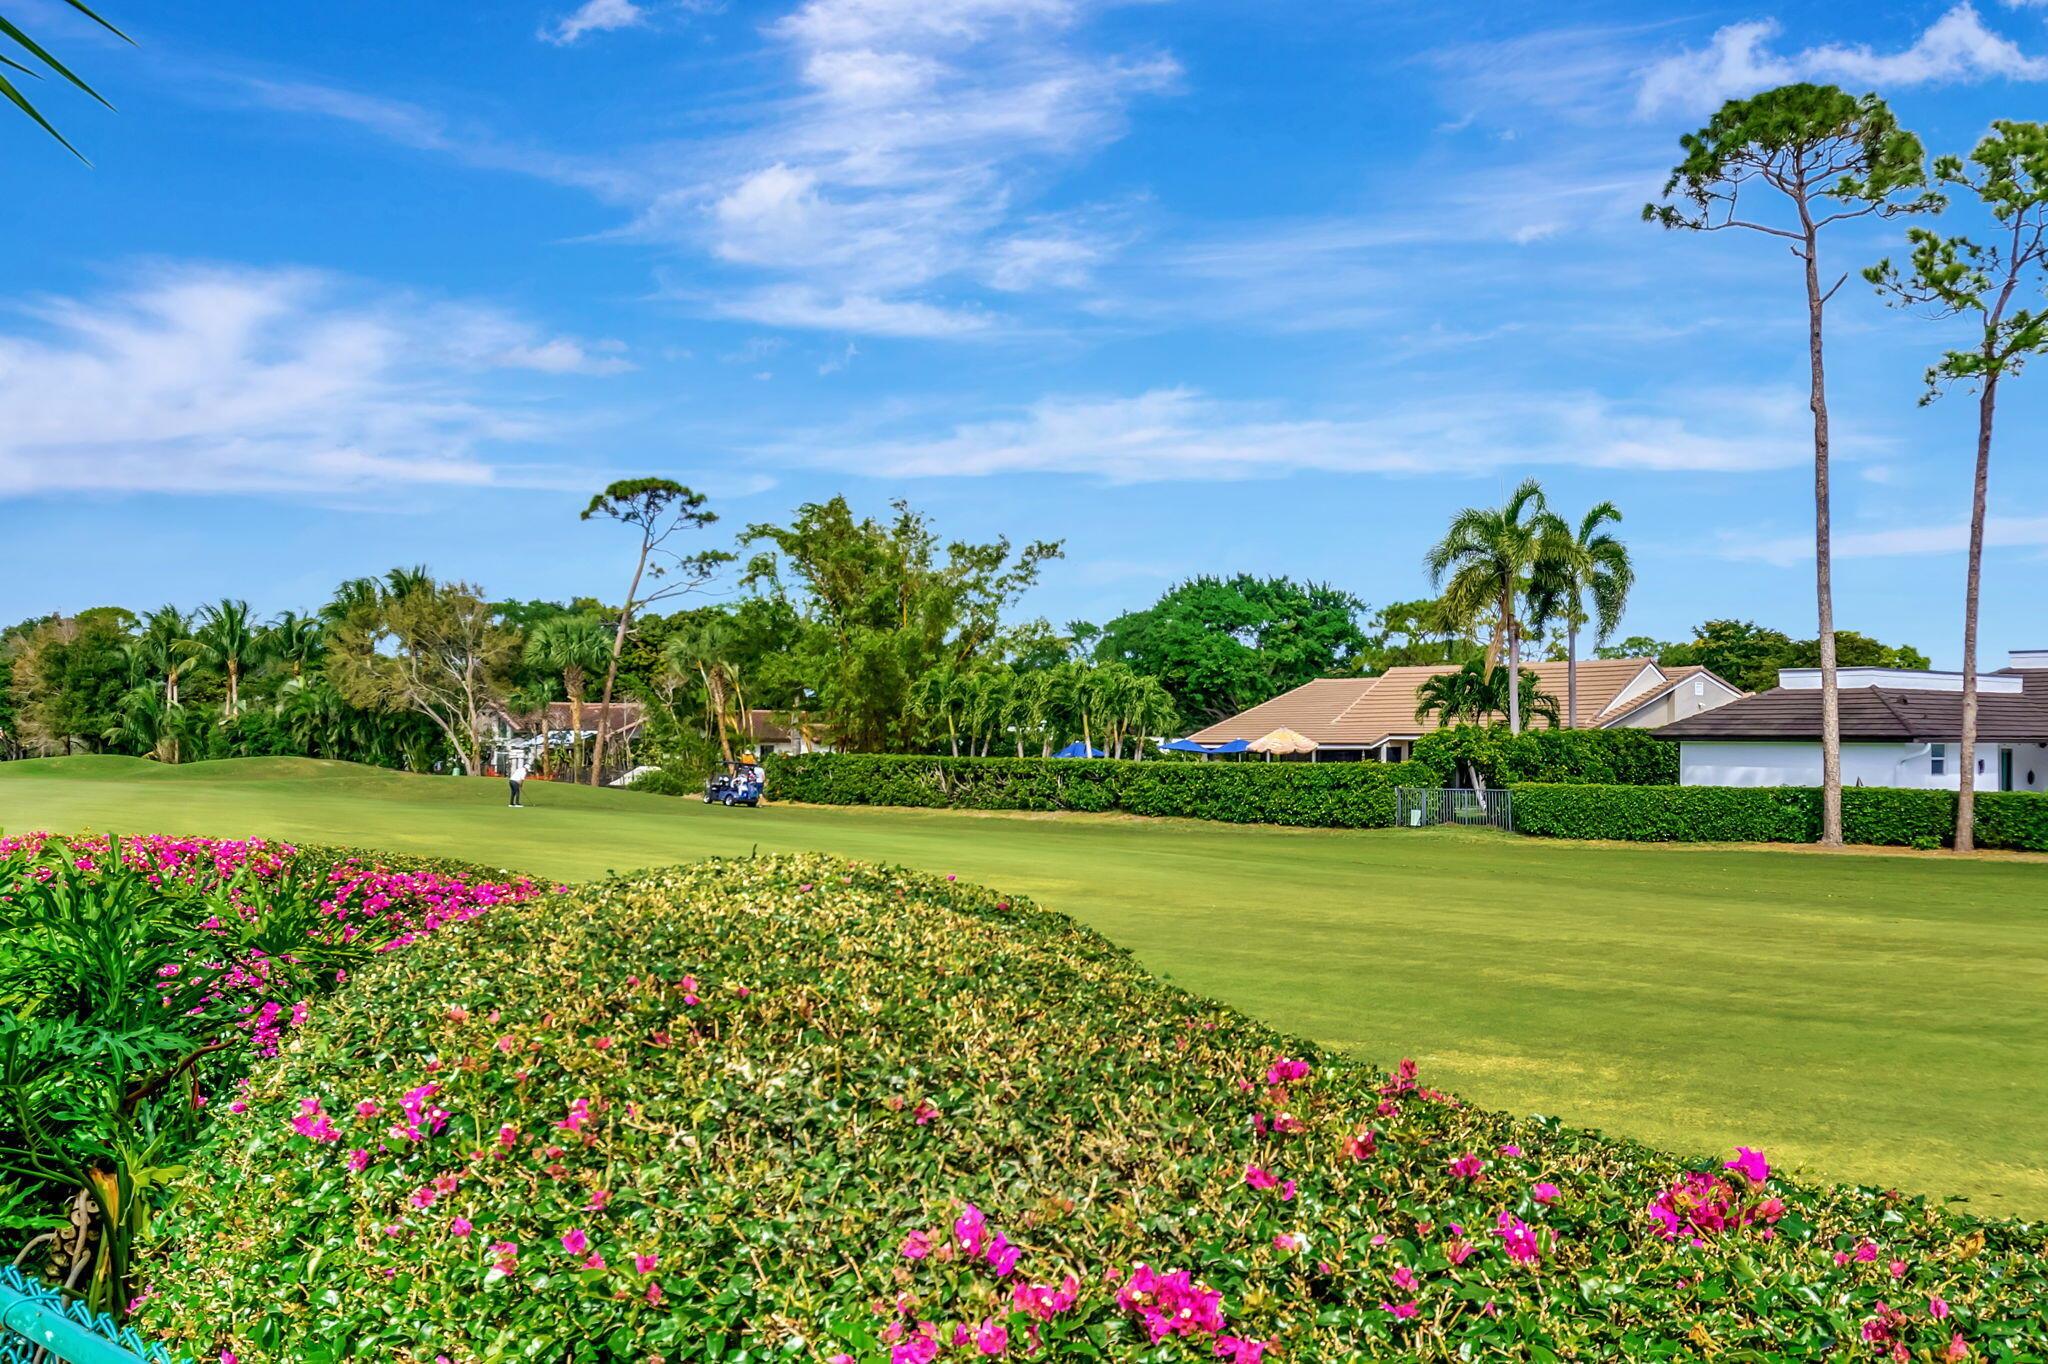
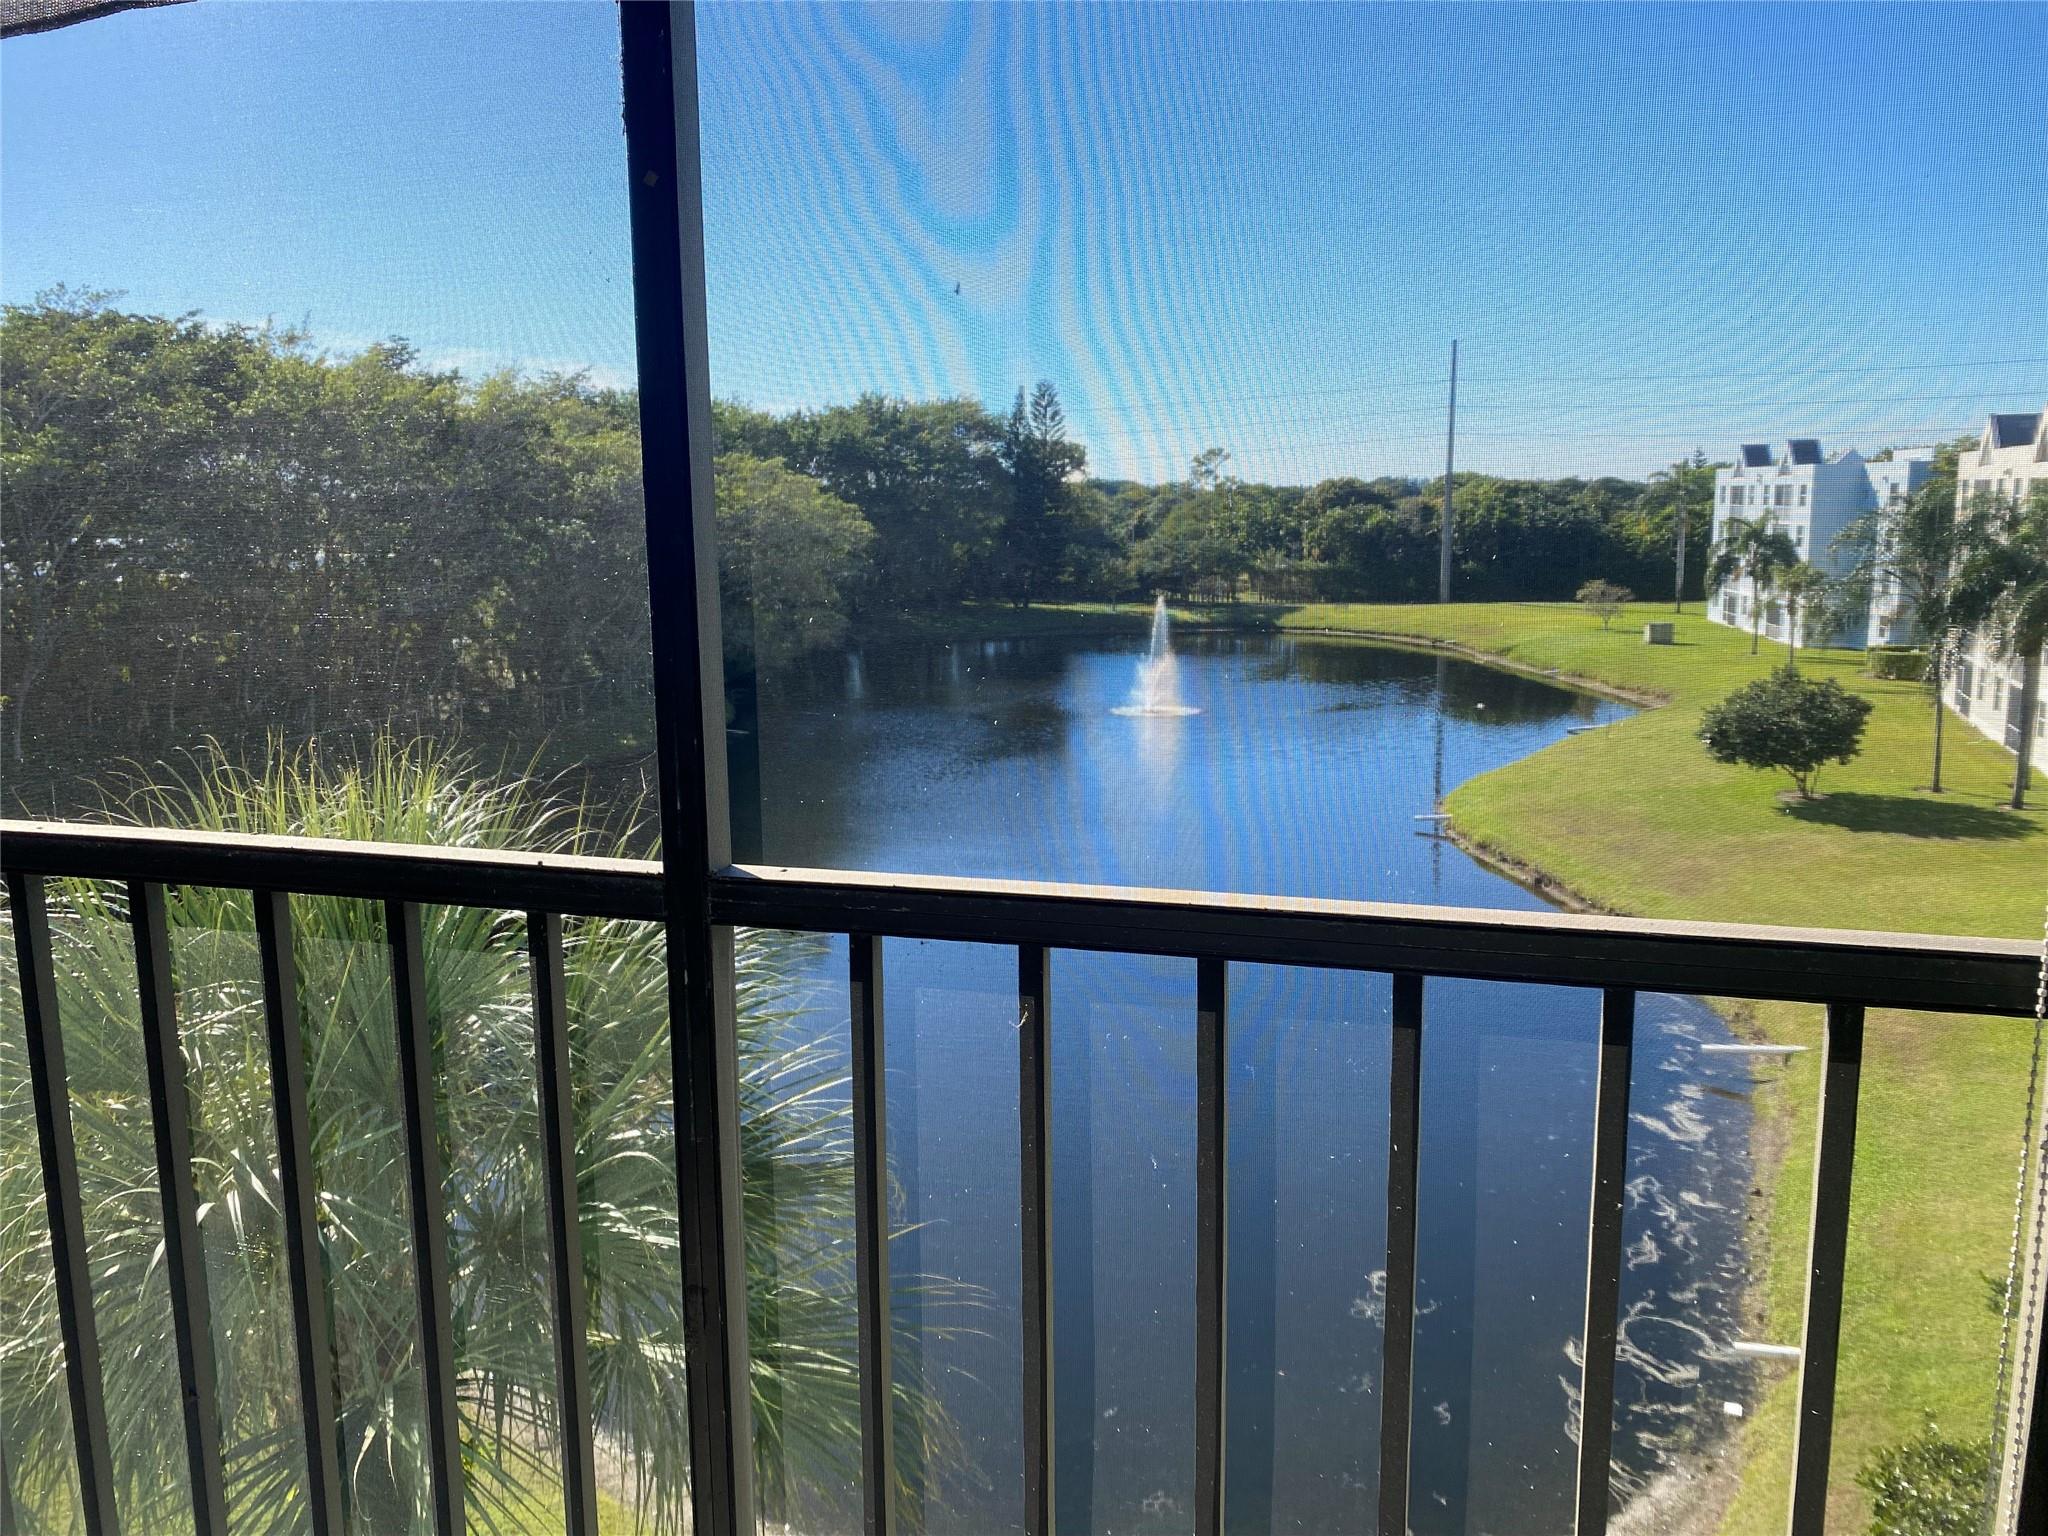
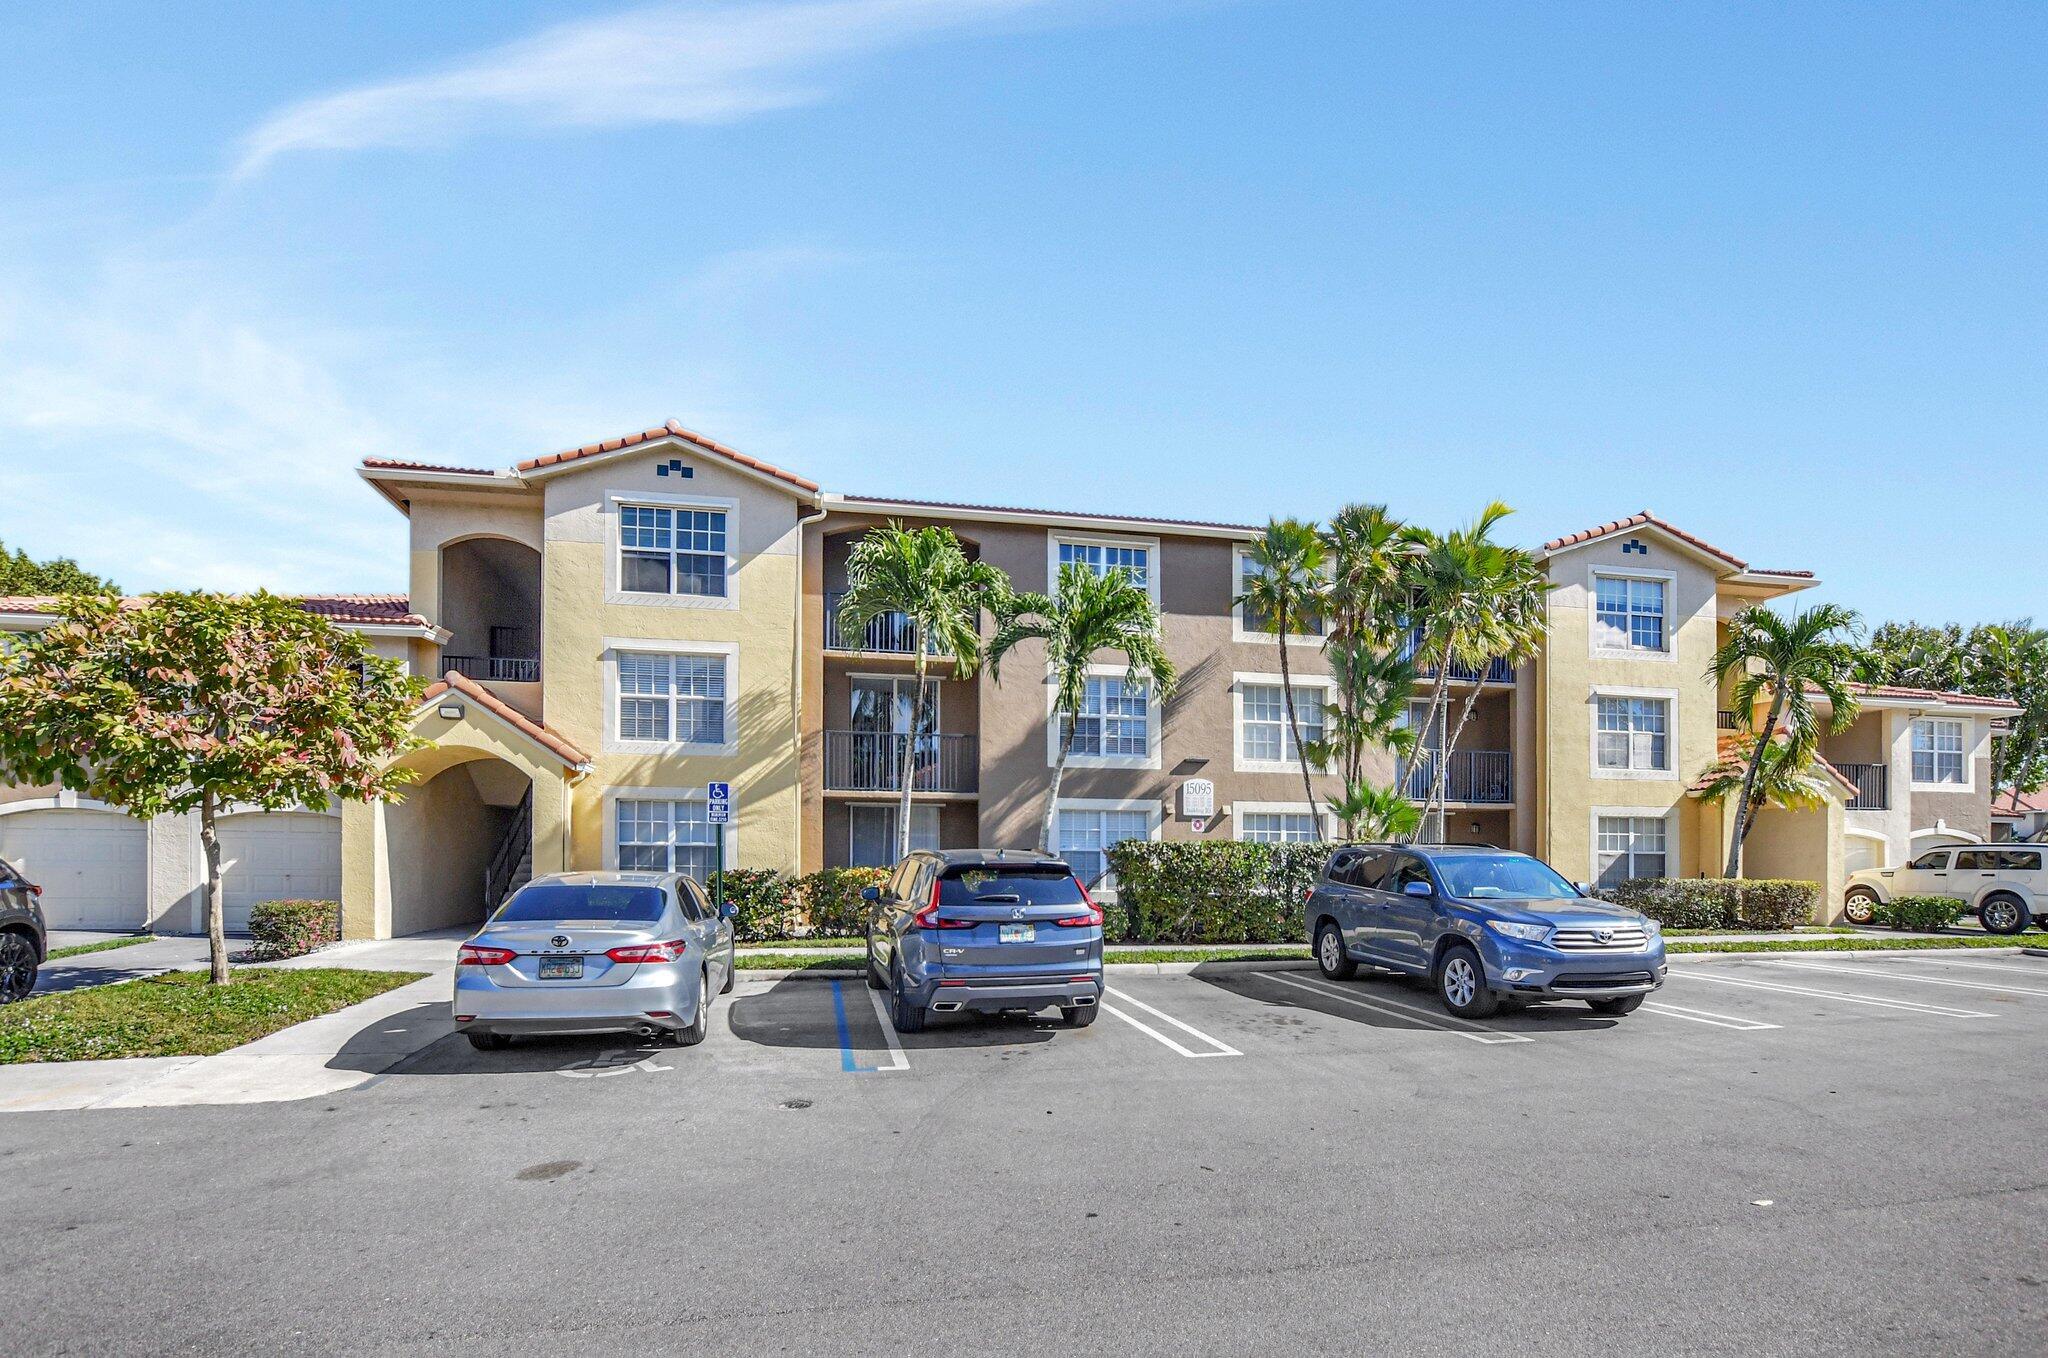
Best cash flowing properties in Delray Beach, FL
Active
$165,000
2
bds
|
2
ba
|
1,150
sqft
|
built
1989
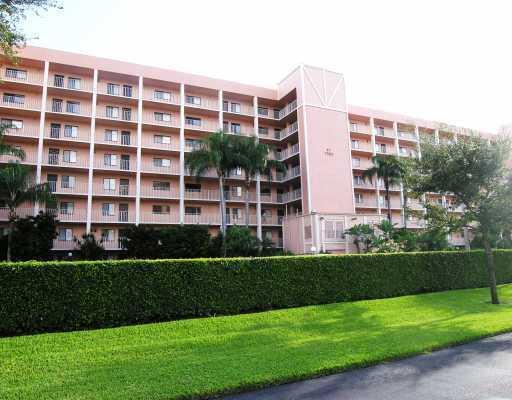
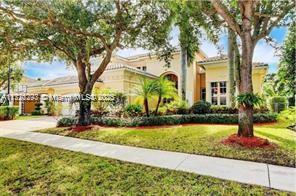
7290 Kinghurst Dr, Delray Beach, FL 33446
$-462
Cash flow
-14.6%
Cash-on-Cash Return
2.9%
Cap rate
1.2%
Rent to Value Ratio
Active
$269,000
2
bds
|
2
ba
|
1,728
sqft
|
built
1987
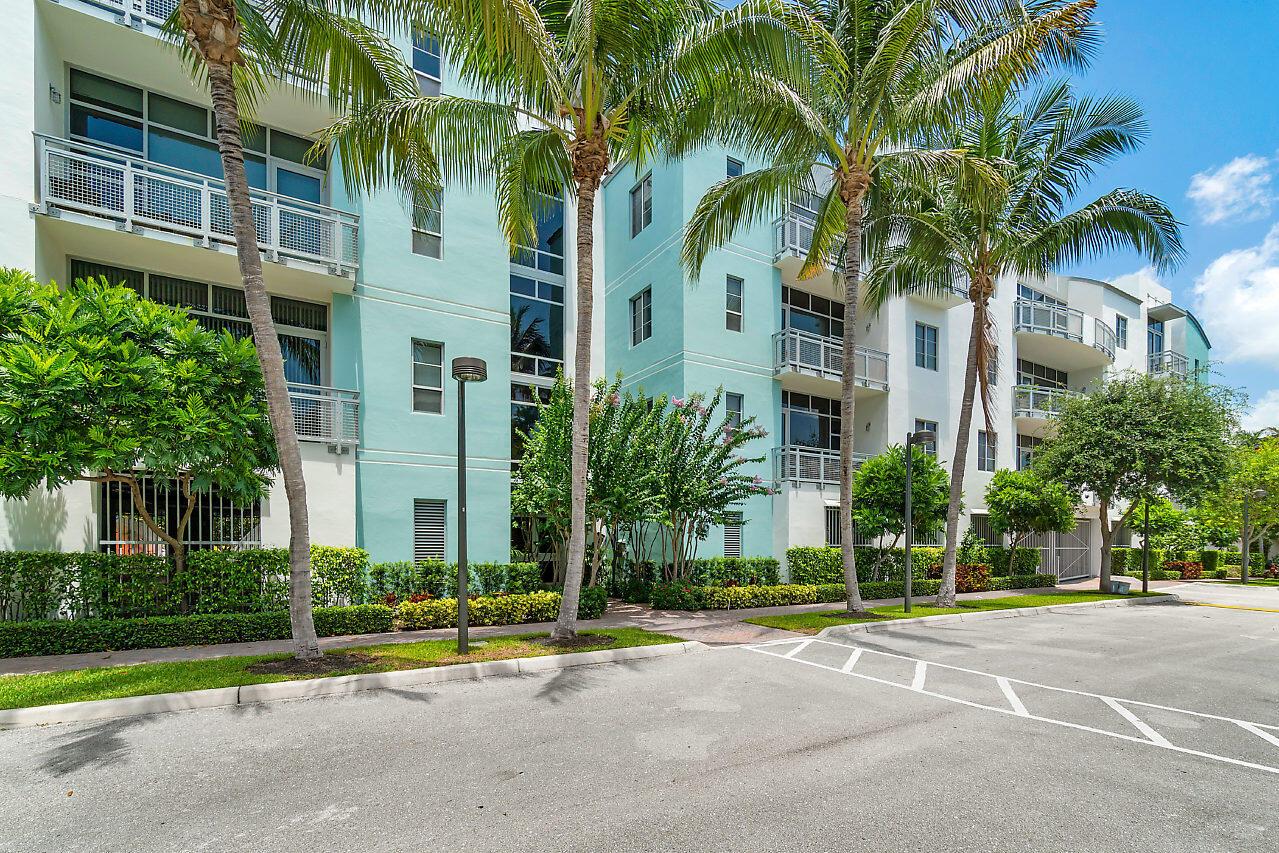
15347 Strathearn Dr, Delray Beach, FL 33446
$-497
Cash flow
-9.6%
Cash-on-Cash Return
4.1%
Cap rate
1.1%
Rent to Value Ratio
641 out of 739 properties for sale in Delray Beach, FL
Limited Results Shown
Create a free account, or log in to reveal all property listings and enjoy the complete experience.
Active under contract
$500,000
2
bds
|
3
ba
|
1,612
sqft
|
built
1980
3118 Spanish Trl, Delray Beach, FL 33483
$-1,018
Cash flow
-10.6%
Cash-on-Cash Return
3.8%
Cap rate
0.7%
Rent to Value Ratio
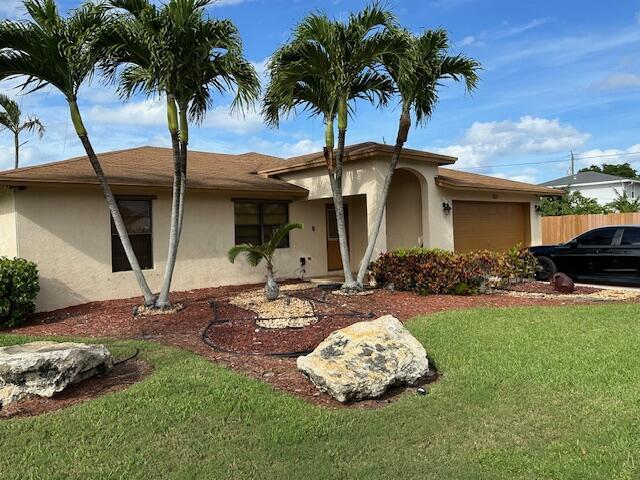
Active
$165,000
2
bds
|
2
ba
|
1,150
sqft
|
built
1989
7290 Kinghurst Dr, Delray Beach, FL 33446
$-462
Cash flow
-14.6%
Cash-on-Cash Return
2.9%
Cap rate
1.2%
Rent to Value Ratio
Active
$483,000
3
bds
|
2
ba
|
1,150
sqft
|
built
1986
5266 Greenwood Dr, Delray Beach, FL 33484
$-564
Cash flow
-6.1%
Cash-on-Cash Return
4.9%
Cap rate
0.6%
Rent to Value Ratio
Active
$799,000
4
bds
|
3
ba
|
1,555
sqft
|
built
1971
530 Kingbird Cir, Delray Beach, FL 33444
$-921
Cash flow
-6.0%
Cash-on-Cash Return
4.9%
Cap rate
0.7%
Rent to Value Ratio
Active
$480,000
1
bds
|
1
ba
|
759
sqft
|
built
1971
3851 N Ocean Blvd, Delray Beach, FL 33483
$-791
Cash flow
-8.6%
Cash-on-Cash Return
4.3%
Cap rate
1.1%
Rent to Value Ratio
Active
$924,900
2
bds
|
1
ba
|
1,404
sqft
|
built
1956
3203 Palm Dr, Delray Beach, FL 33483
$-1,243
Cash flow
-7.0%
Cash-on-Cash Return
4.7%
Cap rate
0.6%
Rent to Value Ratio
Active
$4,099,999
4
bds
|
5
ba
|
3,689
sqft
|
built
2023
10 NW 17th St, Delray Beach, FL 33444
$-17,810
Cash flow
-22.7%
Cash-on-Cash Return
1.1%
Cap rate
0.2%
Rent to Value Ratio
Active
$218,900
1
bds
|
1
ba
|
756
sqft
|
built
1989
1020 Crystal Way, Delray Beach, FL 33444
$-500
Cash flow
-11.9%
Cash-on-Cash Return
3.5%
Cap rate
0.9%
Rent to Value Ratio
Active
$24,900,000
6
bds
|
11
ba
|
11,506
sqft
|
built
2021
16071 Quiet Vista Cir, Delray Beach, FL 33446
$-141,225
Cash flow
-29.6%
Cash-on-Cash Return
-0.5%
Cap rate
0.0%
Rent to Value Ratio
Active
$1,400,000
3
bds
|
4
ba
|
4,185
sqft
|
built
2003
8161 Valhalla Dr, Delray Beach, FL 33446
$-3,409
Cash flow
-12.7%
Cash-on-Cash Return
3.4%
Cap rate
0.6%
Rent to Value Ratio
Active
$749,900
3
bds
|
2
ba
|
1,408
sqft
|
built
1978
3002 Dunlin Rd, Delray Beach, FL 33444
$-1,358
Cash flow
-9.4%
Cash-on-Cash Return
4.1%
Cap rate
0.7%
Rent to Value Ratio
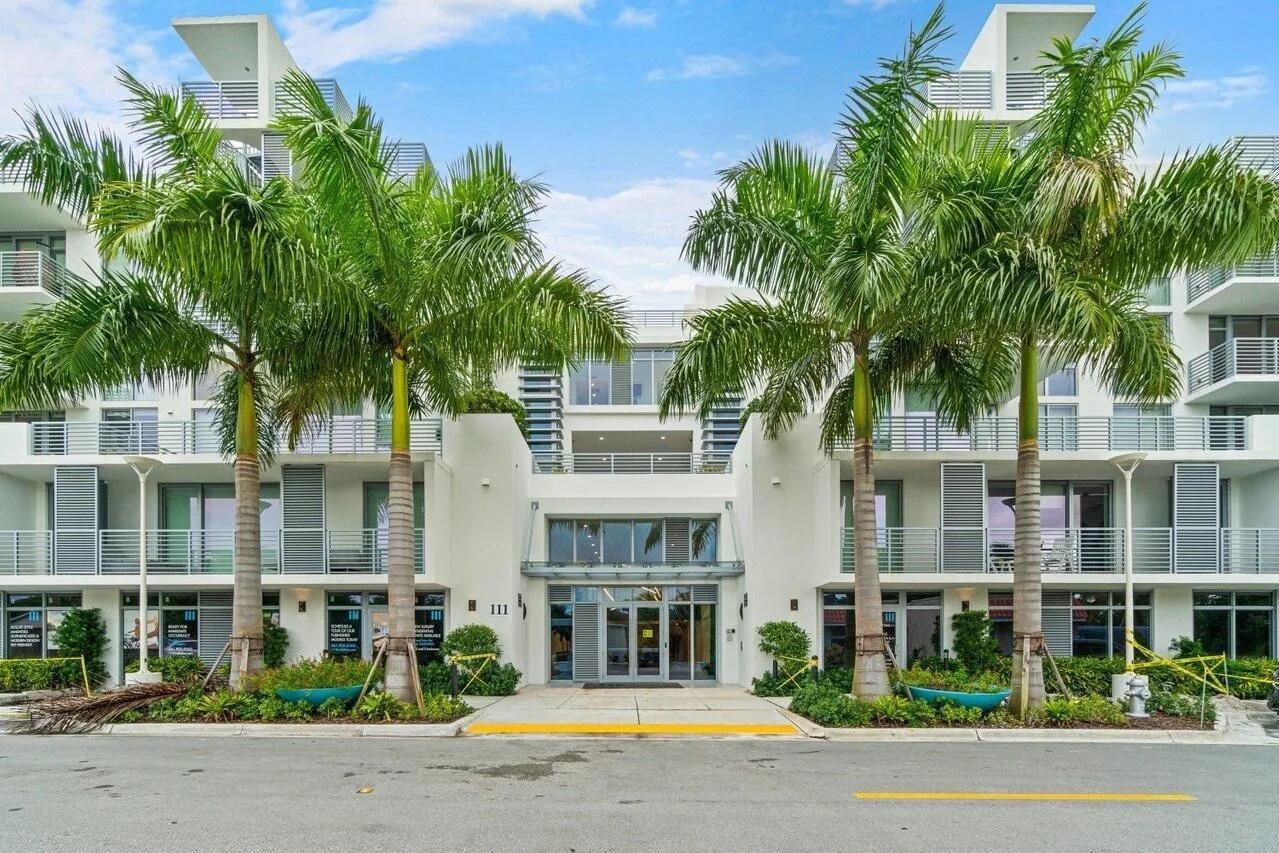
Active
$1,050,000
2
bds
|
2
ba
|
1,118
sqft
|
built
2019
111 SE 1st Ave, Delray Beach, FL 33444
$-2,744
Cash flow
-13.6%
Cash-on-Cash Return
3.1%
Cap rate
0.7%
Rent to Value Ratio
Active
$895,000
3
bds
|
4
ba
|
1,757
sqft
|
built
2006
150 NE 6th Ave, Delray Beach, FL 33483
$-1,095
Cash flow
-6.4%
Cash-on-Cash Return
4.8%
Cap rate
0.9%
Rent to Value Ratio
Active
$799,000
2
bds
|
2
ba
|
1,028
sqft
|
built
1957
100 N Ocean Blvd, Delray Beach, FL 33483
$-2,448
Cash flow
-16.0%
Cash-on-Cash Return
2.6%
Cap rate
0.6%
Rent to Value Ratio
Active
$1,875,000
bds
|
0
ba
|
0
sqft
|
built
2025
330 Glenwood Dr, Delray Beach, FL 33445
$-8,177
Cash flow
-22.8%
Cash-on-Cash Return
1.1%
Cap rate
0.4%
Rent to Value Ratio
Active
$997,000
bds
|
0
ba
|
1,392
sqft
|
built
1963
237 NE 12th St, Delray Beach, FL 33444
$-4,377
Cash flow
-22.9%
Cash-on-Cash Return
1.0%
Cap rate
0.3%
Rent to Value Ratio
Active
$725,000
3
bds
|
1
ba
|
1,055
sqft
|
built
1945
337 SW 1st Ave, Delray Beach, FL 33444
$-1,590
Cash flow
-11.4%
Cash-on-Cash Return
3.7%
Cap rate
0.6%
Rent to Value Ratio
Active
$750,000
3
bds
|
2
ba
|
1,818
sqft
|
built
2019
330 Reigle Ave, Delray Beach, FL 33444
$-1,035
Cash flow
-7.2%
Cash-on-Cash Return
4.6%
Cap rate
0.7%
Rent to Value Ratio
Active
$749,999
2
bds
|
3
ba
|
1,404
sqft
|
built
2001
75 NE 5th Ave, Delray Beach, FL 33483
$-1,935
Cash flow
-13.5%
Cash-on-Cash Return
3.2%
Cap rate
0.6%
Rent to Value Ratio
Active
$2,150,000
3
bds
|
3
ba
|
2,863
sqft
|
built
1979
4787 Pineview Cir, Delray Beach, FL 33445
$-5,612
Cash flow
-13.6%
Cash-on-Cash Return
3.2%
Cap rate
0.5%
Rent to Value Ratio
Active
$199,000
2
bds
|
2
ba
|
1,113
sqft
|
built
1985
5884 Morningstar Cir, Delray Beach, FL 33484
$-819
Cash flow
-21.5%
Cash-on-Cash Return
1.3%
Cap rate
1.0%
Rent to Value Ratio
Active
$305,000
2
bds
|
2
ba
|
1,079
sqft
|
built
2001
15095 Michelangelo Blvd, Delray Beach, FL 33446
$-662
Cash flow
-11.3%
Cash-on-Cash Return
3.7%
Cap rate
0.8%
Rent to Value Ratio
Active
$710,999
2
bds
|
2
ba
|
1,243
sqft
|
built
2004
250 NE 3rd Ave, Delray Beach, FL 33444
$-2,771
Cash flow
-20.3%
Cash-on-Cash Return
1.6%
Cap rate
0.5%
Rent to Value Ratio
Active
$1,000,000
3
bds
|
4
ba
|
1,828
sqft
|
built
2005
150 NE 6th Ave, Delray Beach, FL 33483
$-3,506
Cash flow
-18.3%
Cash-on-Cash Return
2.1%
Cap rate
0.5%
Rent to Value Ratio
Active
$4,995,000
5
bds
|
6
ba
|
4,181
sqft
|
built
2017
1400 Lake Dr, Delray Beach, FL 33444
$-24,067
Cash flow
-25.1%
Cash-on-Cash Return
0.5%
Cap rate
0.2%
Rent to Value Ratio
Active
$1,875,000
5
bds
|
6
ba
|
5,522
sqft
|
built
2005
8975 Valhalla Dr, Delray Beach, FL 33446
$-5,187
Cash flow
-14.4%
Cash-on-Cash Return
3.0%
Cap rate
0.5%
Rent to Value Ratio
Pending
$1,195,000
3
bds
|
2
ba
|
1,710
sqft
|
built
1950
231 NE 14th St, Delray Beach, FL 33444
$-1,335
Cash flow
-5.8%
Cash-on-Cash Return
4.9%
Cap rate
0.7%
Rent to Value Ratio
Active
$2,215,000
4
bds
|
5
ba
|
3,975
sqft
|
built
2000
6139 Via Venetia S, Delray Beach, FL 33484
$-6,432
Cash flow
-15.2%
Cash-on-Cash Return
2.8%
Cap rate
0.5%
Rent to Value Ratio
Active
$669,000
1
bds
|
1
ba
|
953
sqft
|
built
2005
335 SE 6th Ave, Delray Beach, FL 33483
$-2,385
Cash flow
-18.6%
Cash-on-Cash Return
2.0%
Cap rate
0.6%
Rent to Value Ratio
Active
$349,999
2
bds
|
2
ba
|
1,160
sqft
|
built
1985
820 Lavers Cir, Delray Beach, FL 33444
$-1,083
Cash flow
-16.1%
Cash-on-Cash Return
2.6%
Cap rate
0.7%
Rent to Value Ratio
Active
$2,990,000
7
bds
|
5
ba
|
4,678
sqft
|
built
1977
1002 NW 5th Ave, Delray Beach, FL 33444
$-11,717
Cash flow
-20.4%
Cash-on-Cash Return
1.6%
Cap rate
0.3%
Rent to Value Ratio
Active
$699,000
3
bds
|
2
ba
|
1,812
sqft
|
built
1996
785 SW 4th St, Delray Beach, FL 33444
$-1,121
Cash flow
-8.4%
Cash-on-Cash Return
4.4%
Cap rate
0.6%
Rent to Value Ratio
Active
$269,000
2
bds
|
2
ba
|
1,728
sqft
|
built
1987
15347 Strathearn Dr, Delray Beach, FL 33446
$-497
Cash flow
-9.6%
Cash-on-Cash Return
4.1%
Cap rate
1.1%
Rent to Value Ratio
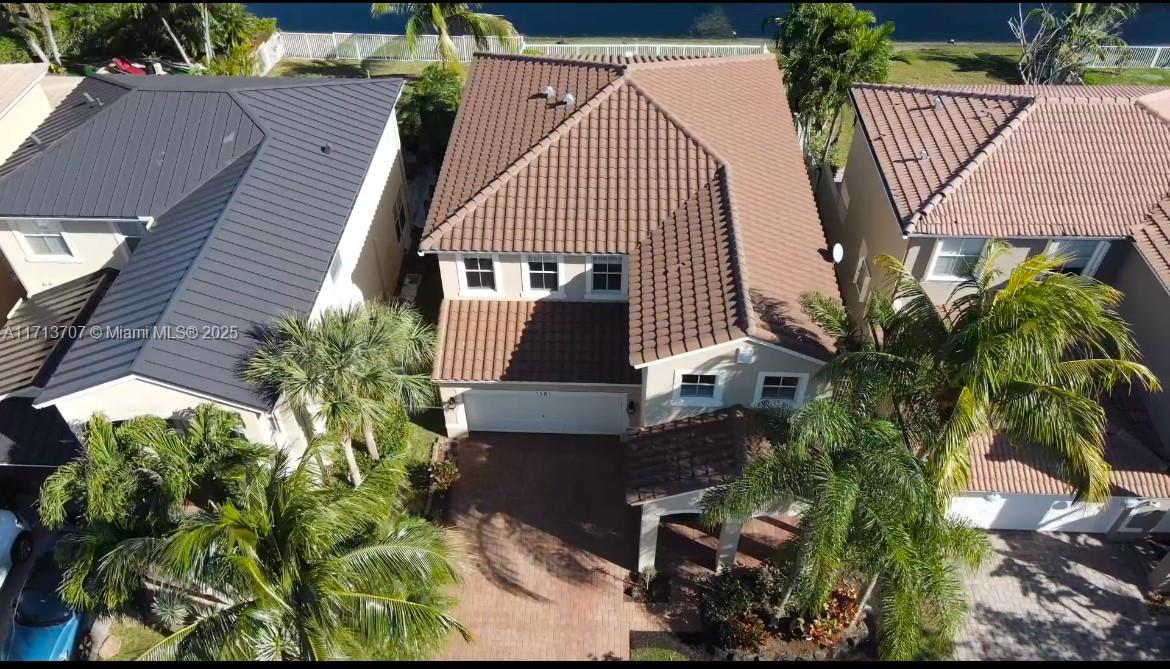
Active
$850,000
5
bds
|
4
ba
|
2,982
sqft
|
built
2004
1181 W Magnolia Cir, Delray Beach, FL 33445
$-2,157
Cash flow
-13.2%
Cash-on-Cash Return
3.2%
Cap rate
0.6%
Rent to Value Ratio

Active
$1,122,000
4
bds
|
3
ba
|
2,305
sqft
|
built
2018
15371 Destiny Dr, Delray Beach, FL 33446
$-1,473
Cash flow
-6.8%
Cash-on-Cash Return
4.7%
Cap rate
0.8%
Rent to Value Ratio
Active
$1,675,000
bds
|
0
ba
|
1,728
sqft
|
built
1971
311 N Swinton Ave, Delray Beach, FL 33444
$-7,144
Cash flow
-22.3%
Cash-on-Cash Return
1.2%
Cap rate
0.2%
Rent to Value Ratio
Active
$815,000
2
bds
|
2
ba
|
1,240
sqft
|
built
1958
910 SE 3rd Ave, Delray Beach, FL 33483
$-4,089
Cash flow
-26.2%
Cash-on-Cash Return
0.3%
Cap rate
0.4%
Rent to Value Ratio
Active
$2,790,000
4
bds
|
3
ba
|
3,800
sqft
|
built
1988
907 Hyacinth Dr, Delray Beach, FL 33483
$-9,472
Cash flow
-17.7%
Cash-on-Cash Return
2.2%
Cap rate
0.4%
Rent to Value Ratio
Active
$424,900
2
bds
|
2
ba
|
1,218
sqft
|
built
1987
5272 Bolero Cir, Delray Beach, FL 33484
$-740
Cash flow
-9.1%
Cash-on-Cash Return
4.2%
Cap rate
0.7%
Rent to Value Ratio
Active
$569,000
2
bds
|
2
ba
|
1,705
sqft
|
built
1986
15774 Loch Maree Ln, Delray Beach, FL 33446
$-1,353
Cash flow
-12.4%
Cash-on-Cash Return
3.4%
Cap rate
0.7%
Rent to Value Ratio