Delray Beach, FL Investment Properties for Sale
Browse homes for sale and investment properties in Delray Beach, FL. Refine your search by price, property type, or more.
Best cash flowing properties in Delray Beach, FL

Active
$325,000
3
bds
|
3
ba
|
2,025
sqft
|
built
1987
7418 Victory Ln, Delray Beach, FL 33446
$-405
Cash flow
-6.5%
Cash-on-Cash Return
4.8%
Cap rate
1.0%
Rent to Value Ratio
Active
$279,000
2
bds
|
2
ba
|
1,088
sqft
|
built
1992
5936 Morningstar Cir, Delray Beach, FL 33484
$-415
Cash flow
-7.8%
Cash-on-Cash Return
4.5%
Cap rate
0.9%
Rent to Value Ratio
641 out of 739 properties for sale in Delray Beach, FL
Limited Results Shown
Create a free account, or log in to reveal all property listings and enjoy the complete experience.
Active
$449,000
3
bds
|
1
ba
|
956
sqft
|
built
1964
214 NW 7th Ave, Delray Beach, FL 33444
$-784
Cash flow
-9.1%
Cash-on-Cash Return
4.2%
Cap rate
0.7%
Rent to Value Ratio
Active
$749,900
2
bds
|
2
ba
|
1,482
sqft
|
built
1970
2200 S Ocean Blvd, Delray Beach, FL 33483
$-3,008
Cash flow
-20.9%
Cash-on-Cash Return
1.5%
Cap rate
0.6%
Rent to Value Ratio
Active
$725,000
2
bds
|
2
ba
|
1,160
sqft
|
built
1965
1015 Ingraham Ave, Delray Beach, FL 33483
$-2,589
Cash flow
-18.6%
Cash-on-Cash Return
2.0%
Cap rate
0.6%
Rent to Value Ratio
Active
$2,500,000
4
bds
|
3
ba
|
2,891
sqft
|
built
1999
414 NW 13th St, Delray Beach, FL 33444
$-7,645
Cash flow
-16.0%
Cash-on-Cash Return
2.6%
Cap rate
0.4%
Rent to Value Ratio
Active
$1,375,000
3
bds
|
3
ba
|
2,210
sqft
|
built
1992
2951 San Remo Way, Delray Beach, FL 33445
$-1,522
Cash flow
-5.8%
Cash-on-Cash Return
5.0%
Cap rate
0.6%
Rent to Value Ratio
Pending
$545,000
2
bds
|
2
ba
|
1,170
sqft
|
built
1972
301 Venetian Dr, Delray Beach, FL 33483
$-2,102
Cash flow
-20.1%
Cash-on-Cash Return
1.7%
Cap rate
0.7%
Rent to Value Ratio
Active
$574,900
1
bds
|
1
ba
|
864
sqft
|
built
2004
255 NE 3rd Ave, Delray Beach, FL 33444
$-1,944
Cash flow
-17.6%
Cash-on-Cash Return
2.2%
Cap rate
0.5%
Rent to Value Ratio
Active
$4,195,000
4
bds
|
4
ba
|
3,946
sqft
|
built
1990
16436 Bridlewood Cir, Delray Beach, FL 33445
$-16,969
Cash flow
-21.1%
Cash-on-Cash Return
1.4%
Cap rate
0.2%
Rent to Value Ratio
Active
$279,000
2
bds
|
2
ba
|
1,088
sqft
|
built
1992
5936 Morningstar Cir, Delray Beach, FL 33484
$-415
Cash flow
-7.8%
Cash-on-Cash Return
4.5%
Cap rate
0.9%
Rent to Value Ratio
Active
$1,050,000
3
bds
|
3
ba
|
2,000
sqft
|
built
2004
103 SE 4th Ave, Delray Beach, FL 33483
$-3,662
Cash flow
-18.2%
Cash-on-Cash Return
2.1%
Cap rate
0.6%
Rent to Value Ratio
Active
$590,000
1
bds
|
1
ba
|
579
sqft
|
built
1968
414 Seasage Dr, Delray Beach, FL 33483
$-2,398
Cash flow
-21.2%
Cash-on-Cash Return
1.4%
Cap rate
0.5%
Rent to Value Ratio
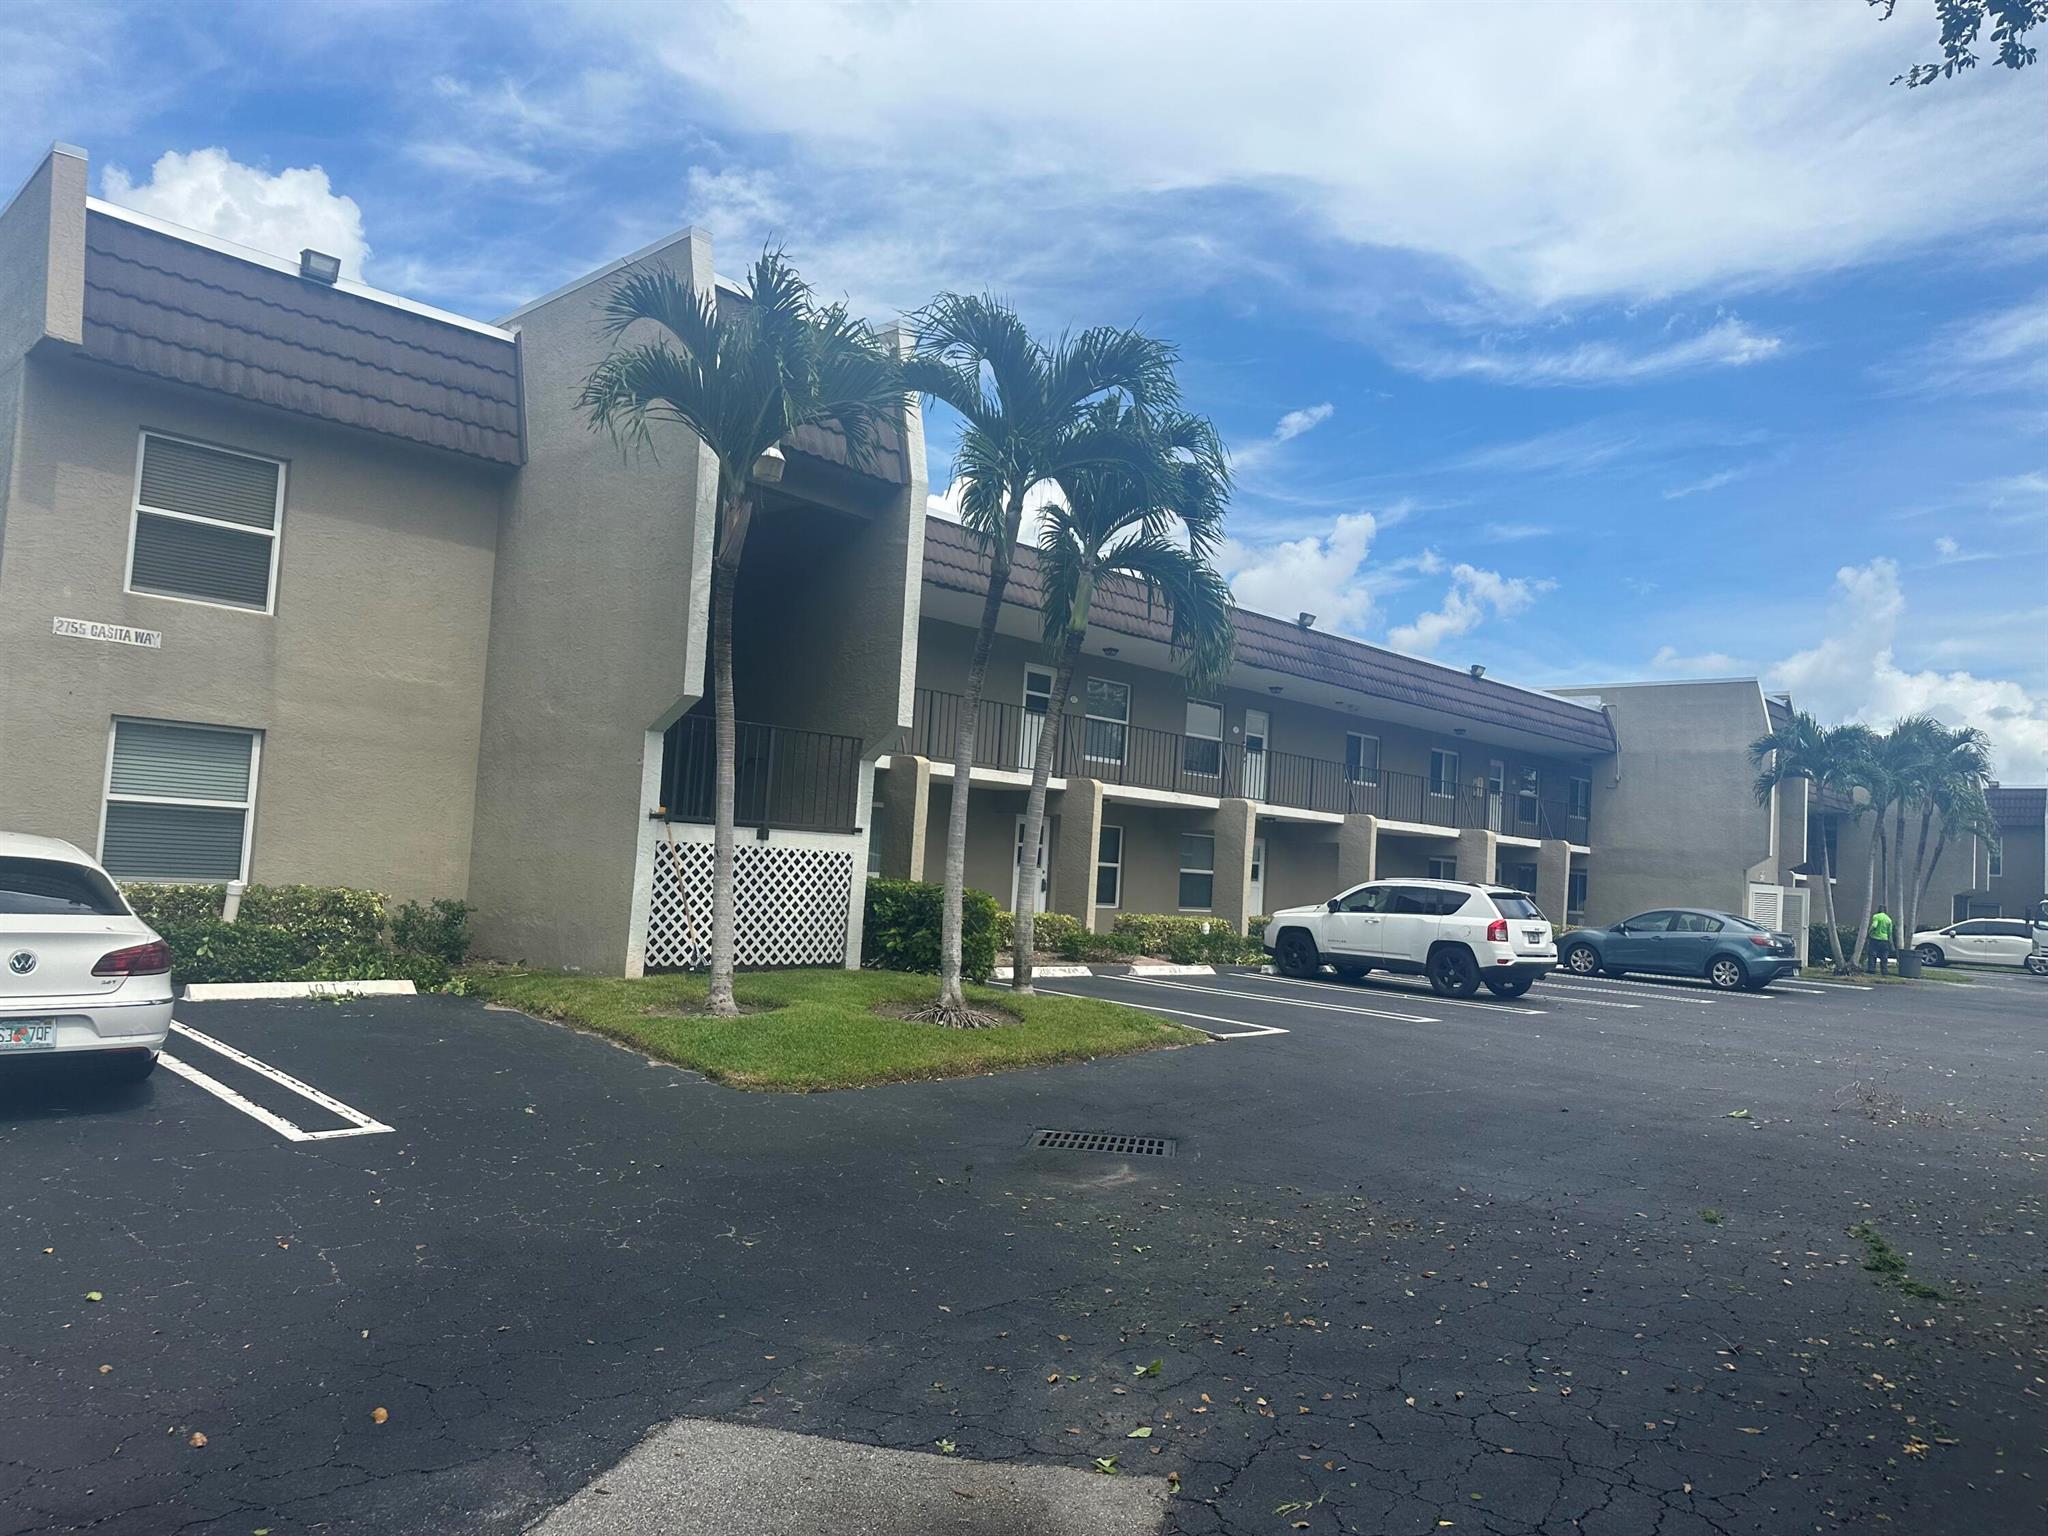
Active
$238,000
2
bds
|
2
ba
|
1,050
sqft
|
built
1990
2755 Casita Way, Delray Beach, FL 33445
$-663
Cash flow
-14.5%
Cash-on-Cash Return
2.9%
Cap rate
0.8%
Rent to Value Ratio
Active
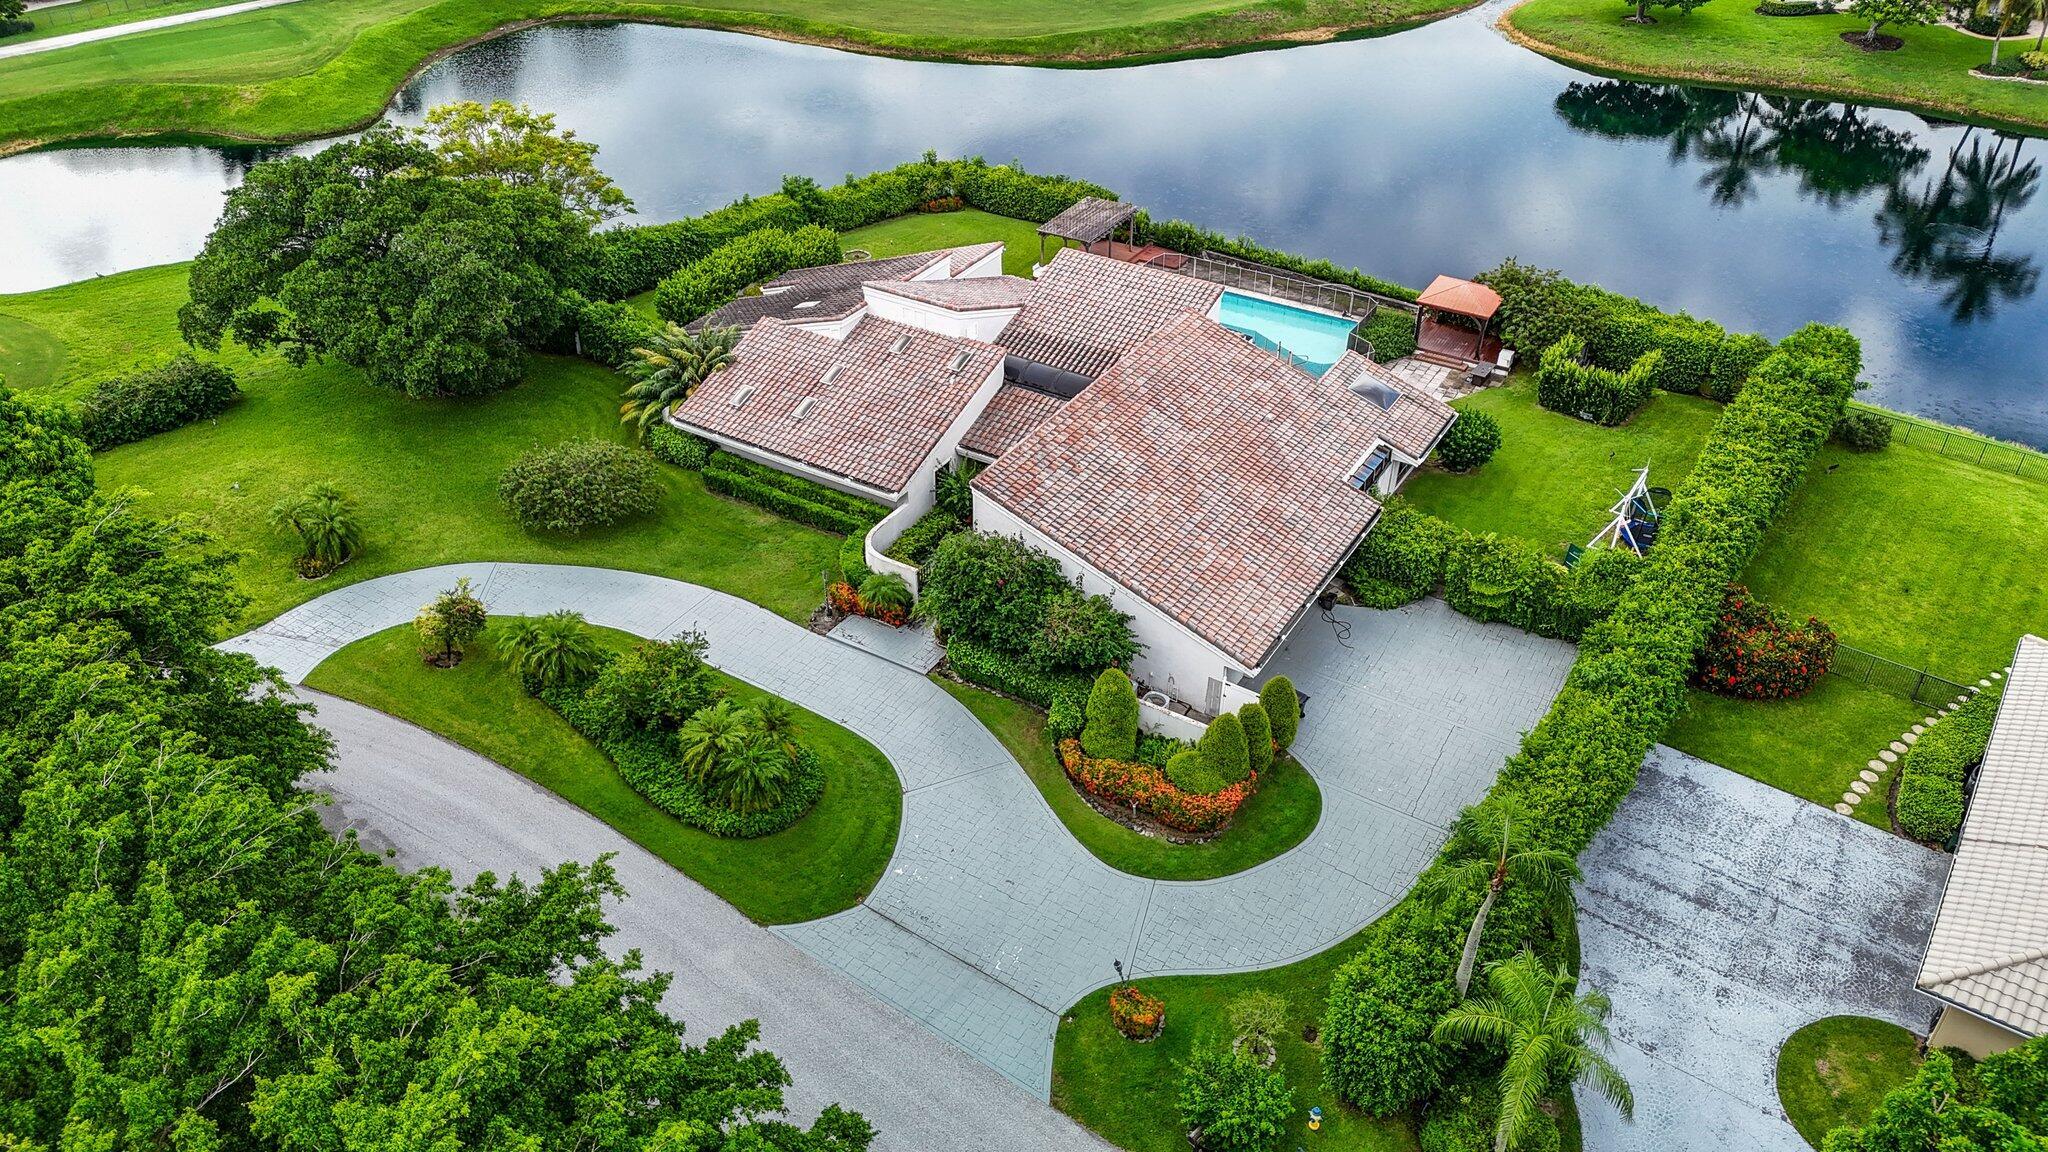
$2,200,000
3
bds
|
5
ba
|
4,699
sqft
|
built
1982
360 Glenwood Dr, Delray Beach, FL 33445
$-6,841
Cash flow
-16.2%
Cash-on-Cash Return
2.6%
Cap rate
0.4%
Rent to Value Ratio
Active
$325,000
3
bds
|
3
ba
|
2,025
sqft
|
built
1987
7418 Victory Ln, Delray Beach, FL 33446
$-405
Cash flow
-6.5%
Cash-on-Cash Return
4.8%
Cap rate
1.0%
Rent to Value Ratio
Active
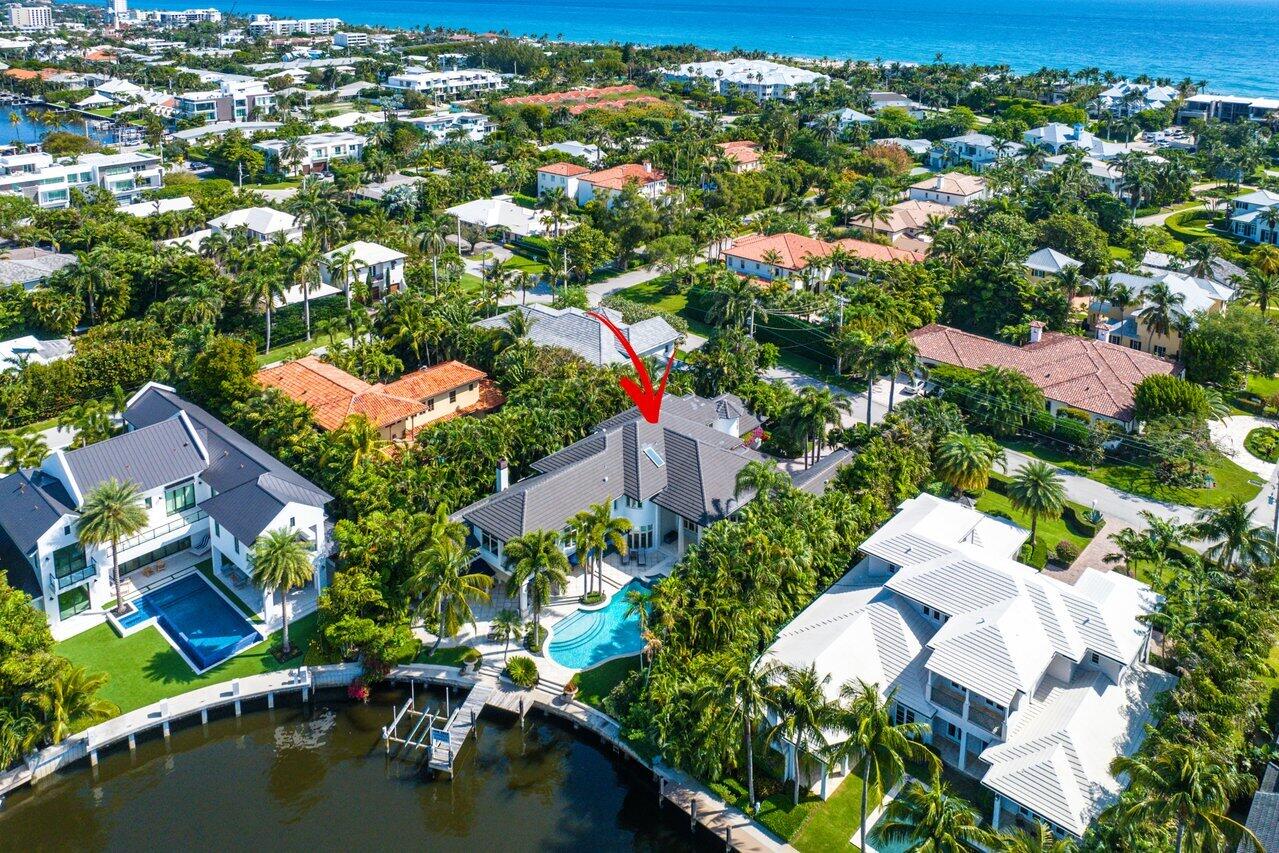
$12,750,000
5
bds
|
6
ba
|
6,587
sqft
|
built
1995
616 Seasage Dr, Delray Beach, FL 33483
$-62,766
Cash flow
-25.7%
Cash-on-Cash Return
0.4%
Cap rate
0.1%
Rent to Value Ratio
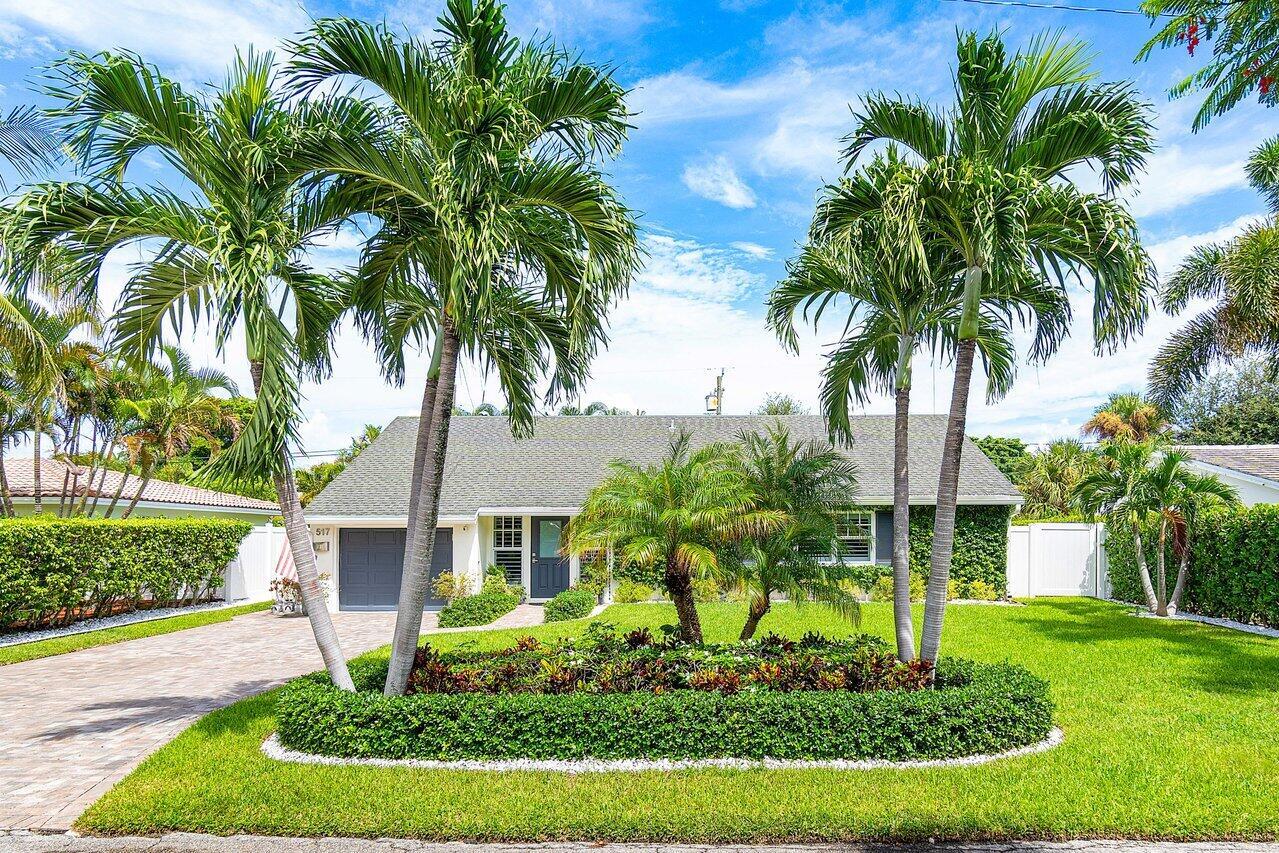
Active
$1,399,000
3
bds
|
2
ba
|
1,662
sqft
|
built
1957
517 Aylesbury Rd, Delray Beach, FL 33444
$-2,963
Cash flow
-11.1%
Cash-on-Cash Return
3.7%
Cap rate
0.6%
Rent to Value Ratio
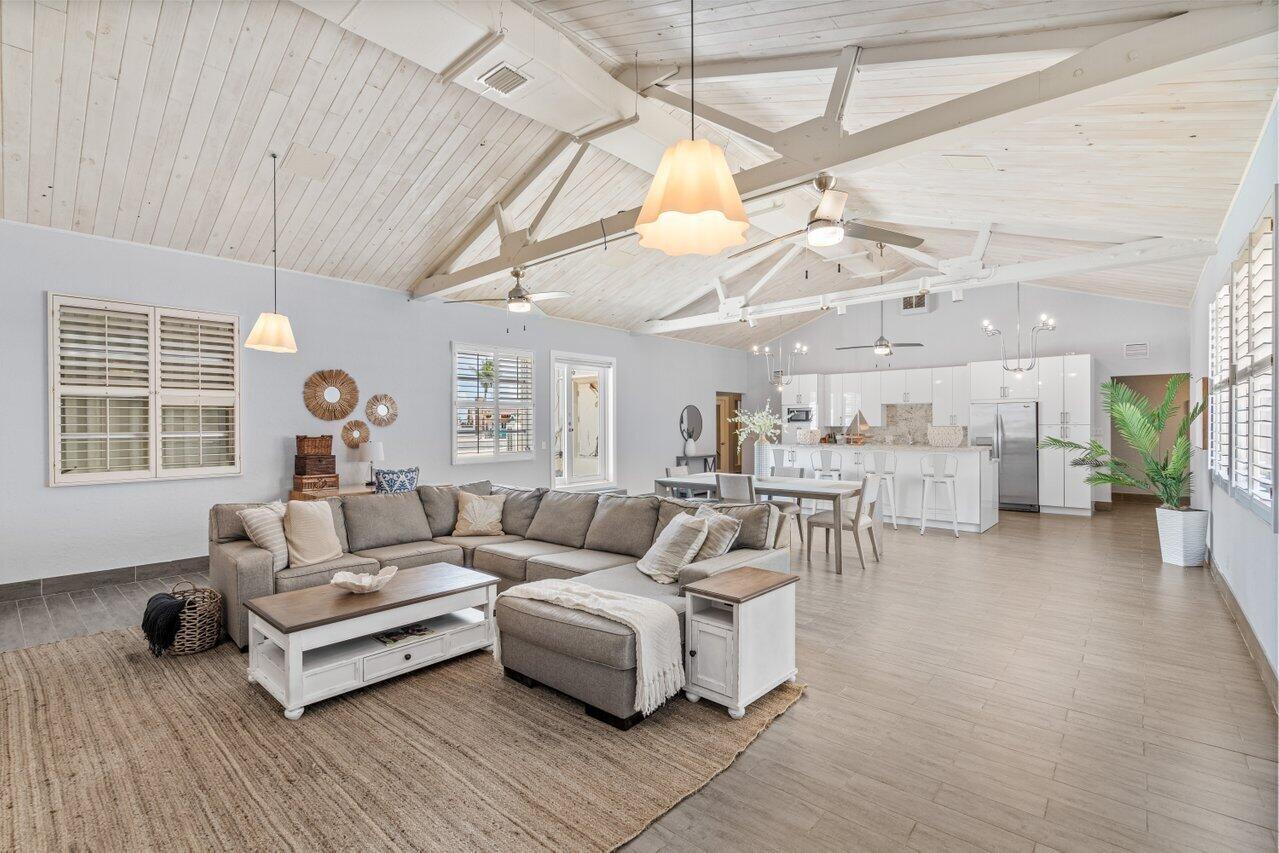
Active
$2,799,999
3
bds
|
3
ba
|
2,544
sqft
|
built
1993
419 E Atlantic Ave, Delray Beach, FL 33483
$-13,923
Cash flow
-25.9%
Cash-on-Cash Return
0.3%
Cap rate
0.2%
Rent to Value Ratio
Active
$690,000
3
bds
|
3
ba
|
1,752
sqft
|
built
2005
1017 W Heritage Club Cir, Delray Beach, FL 33483
$-1,529
Cash flow
-11.6%
Cash-on-Cash Return
3.6%
Cap rate
0.6%
Rent to Value Ratio
Active
$7,950,000
4
bds
|
5
ba
|
3,963
sqft
|
built
1939
920 Hibiscus Ln, Delray Beach, FL 33444
$-37,206
Cash flow
-24.4%
Cash-on-Cash Return
0.7%
Cap rate
0.1%
Rent to Value Ratio
Pending
$1,295,000
3
bds
|
1
ba
|
1,088
sqft
|
built
1937
211 NE 1st Ave, Delray Beach, FL 33444
$-3,895
Cash flow
-15.7%
Cash-on-Cash Return
2.7%
Cap rate
0.4%
Rent to Value Ratio
Active
$825,000
2
bds
|
2
ba
|
1,185
sqft
|
built
2008
235 NE 1st St, Delray Beach, FL 33444
$-3,194
Cash flow
-20.2%
Cash-on-Cash Return
1.6%
Cap rate
0.5%
Rent to Value Ratio
Active
$1,980,018
5
bds
|
6
ba
|
4,258
sqft
|
built
2016
16050 Tuscany Estates Dr, Delray Beach, FL 33446
$-4,739
Cash flow
-12.5%
Cash-on-Cash Return
3.4%
Cap rate
0.5%
Rent to Value Ratio
Active
$265,000
2
bds
|
2
ba
|
1,113
sqft
|
built
1985
5884 Morningstar Cir, Delray Beach, FL 33484
$-784
Cash flow
-15.4%
Cash-on-Cash Return
2.7%
Cap rate
0.9%
Rent to Value Ratio
Active
$7,999,999
5
bds
|
5
ba
|
5,231
sqft
|
built
1998
1713 S Ocean Blvd, Delray Beach, FL 33483
$-42,126
Cash flow
-27.5%
Cash-on-Cash Return
0.0%
Cap rate
0.1%
Rent to Value Ratio
Active
$389,500
2
bds
|
2
ba
|
1,428
sqft
|
built
1987
4634 Pine Grove Dr, Delray Beach, FL 33445
$-633
Cash flow
-8.5%
Cash-on-Cash Return
4.3%
Cap rate
0.7%
Rent to Value Ratio
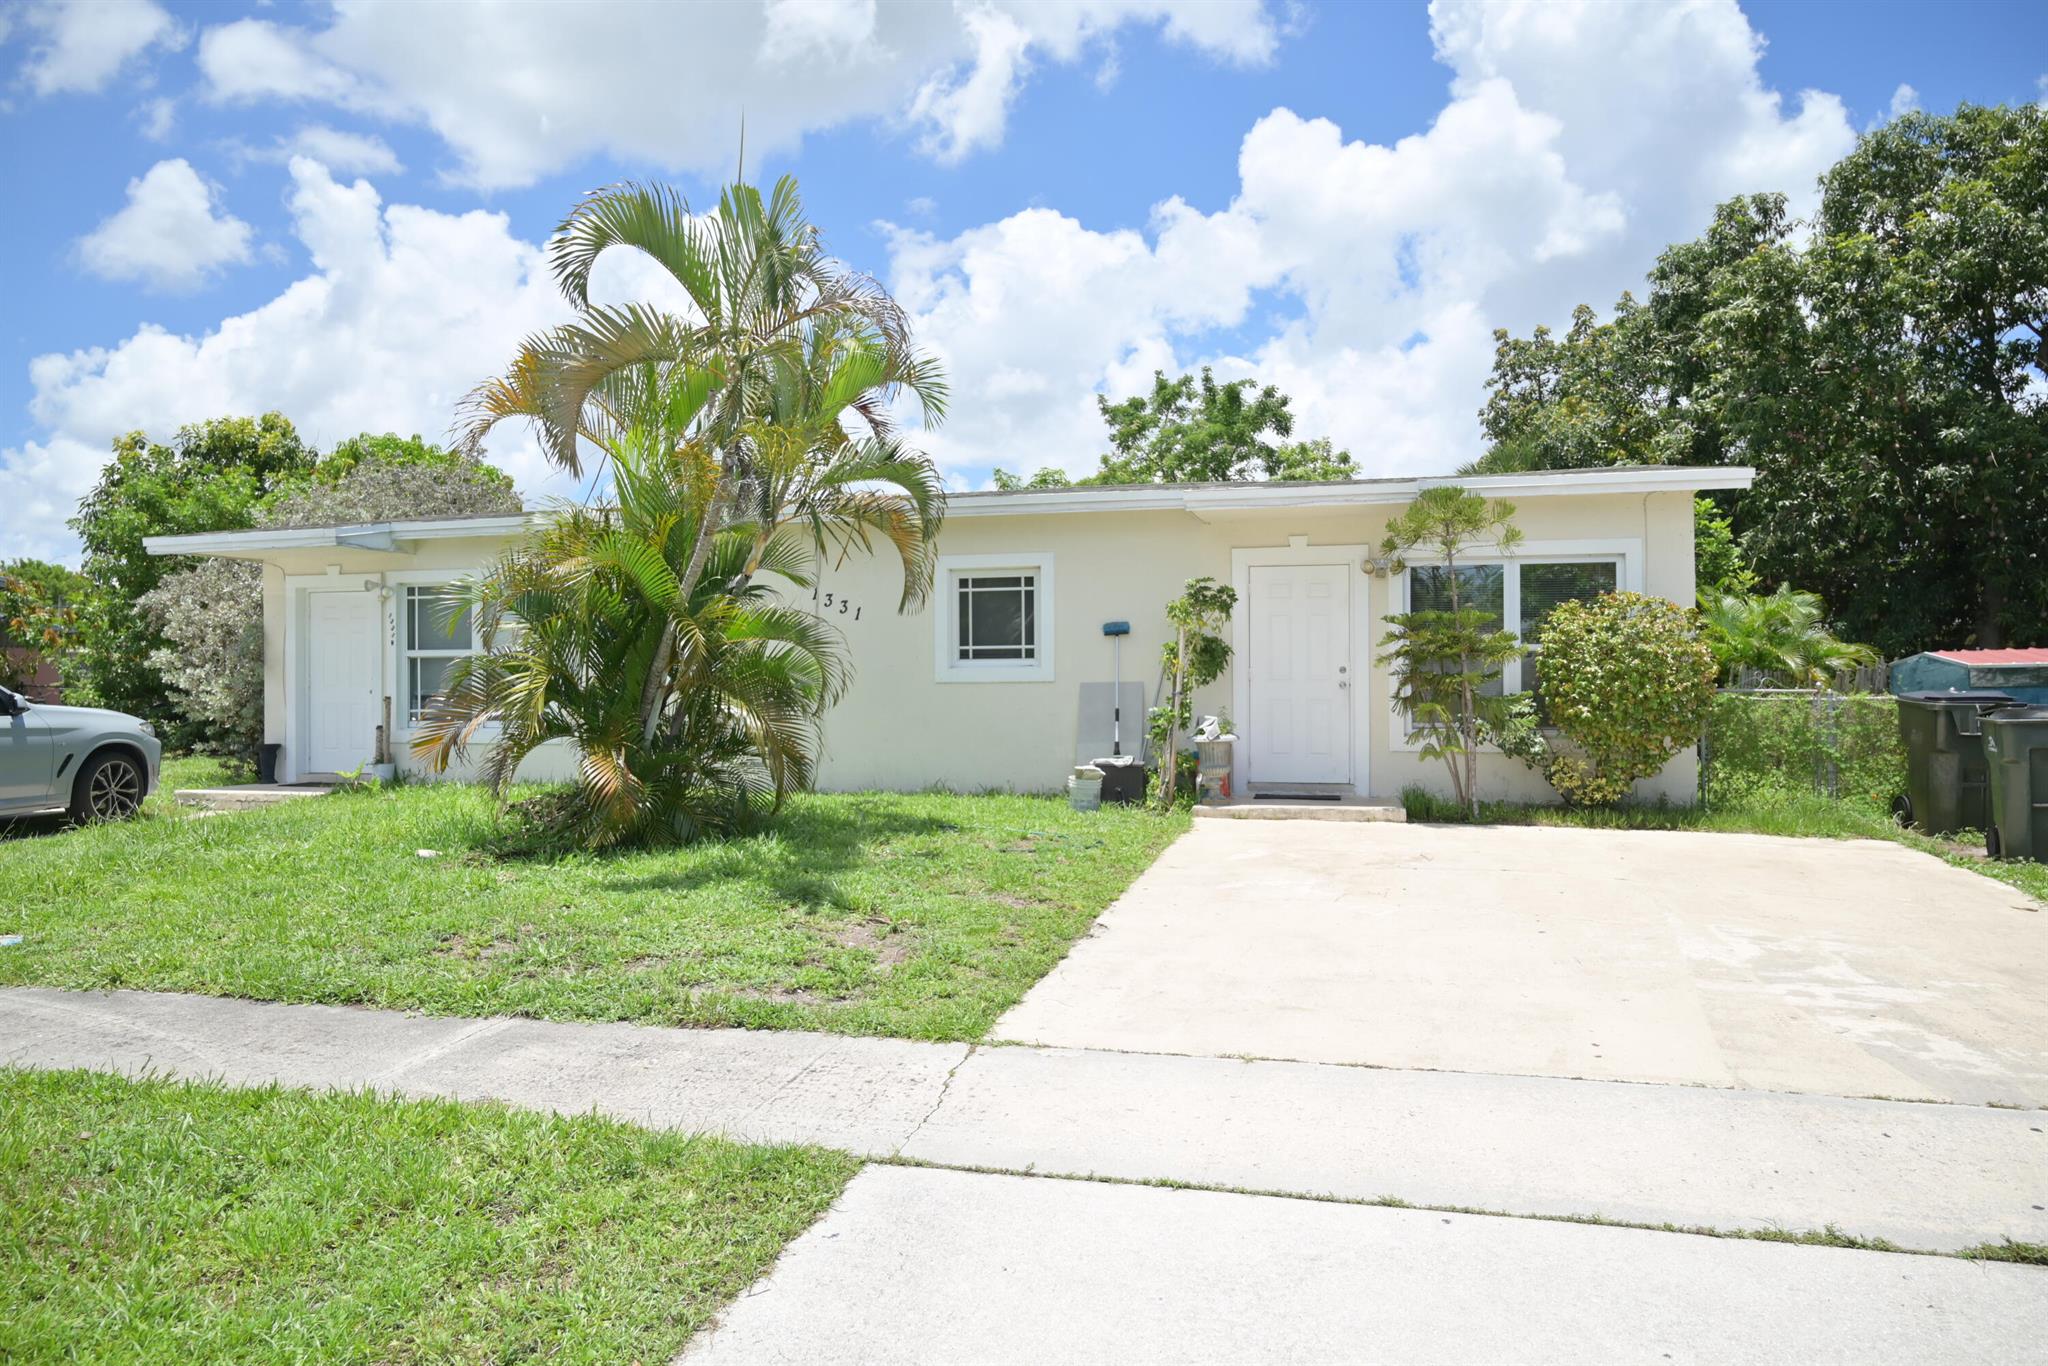
Active
$650,000
bds
|
0
ba
|
1,797
sqft
|
built
1959
1331 NW 3rd St, Delray Beach, FL 33444
$-2,324
Cash flow
-18.7%
Cash-on-Cash Return
2.0%
Cap rate
0.4%
Rent to Value Ratio

Active
$435,000
bds
|
0
ba
|
891
sqft
|
built
1951
238 NW 13th Ave, Delray Beach, FL 33444
$-1,620
Cash flow
-19.4%
Cash-on-Cash Return
1.8%
Cap rate
0.4%
Rent to Value Ratio
Active
$315,000
2
bds
|
2
ba
|
1,126
sqft
|
built
1980
2940 SW 22nd Ave, Delray Beach, FL 33445
$-549
Cash flow
-9.1%
Cash-on-Cash Return
4.2%
Cap rate
0.8%
Rent to Value Ratio
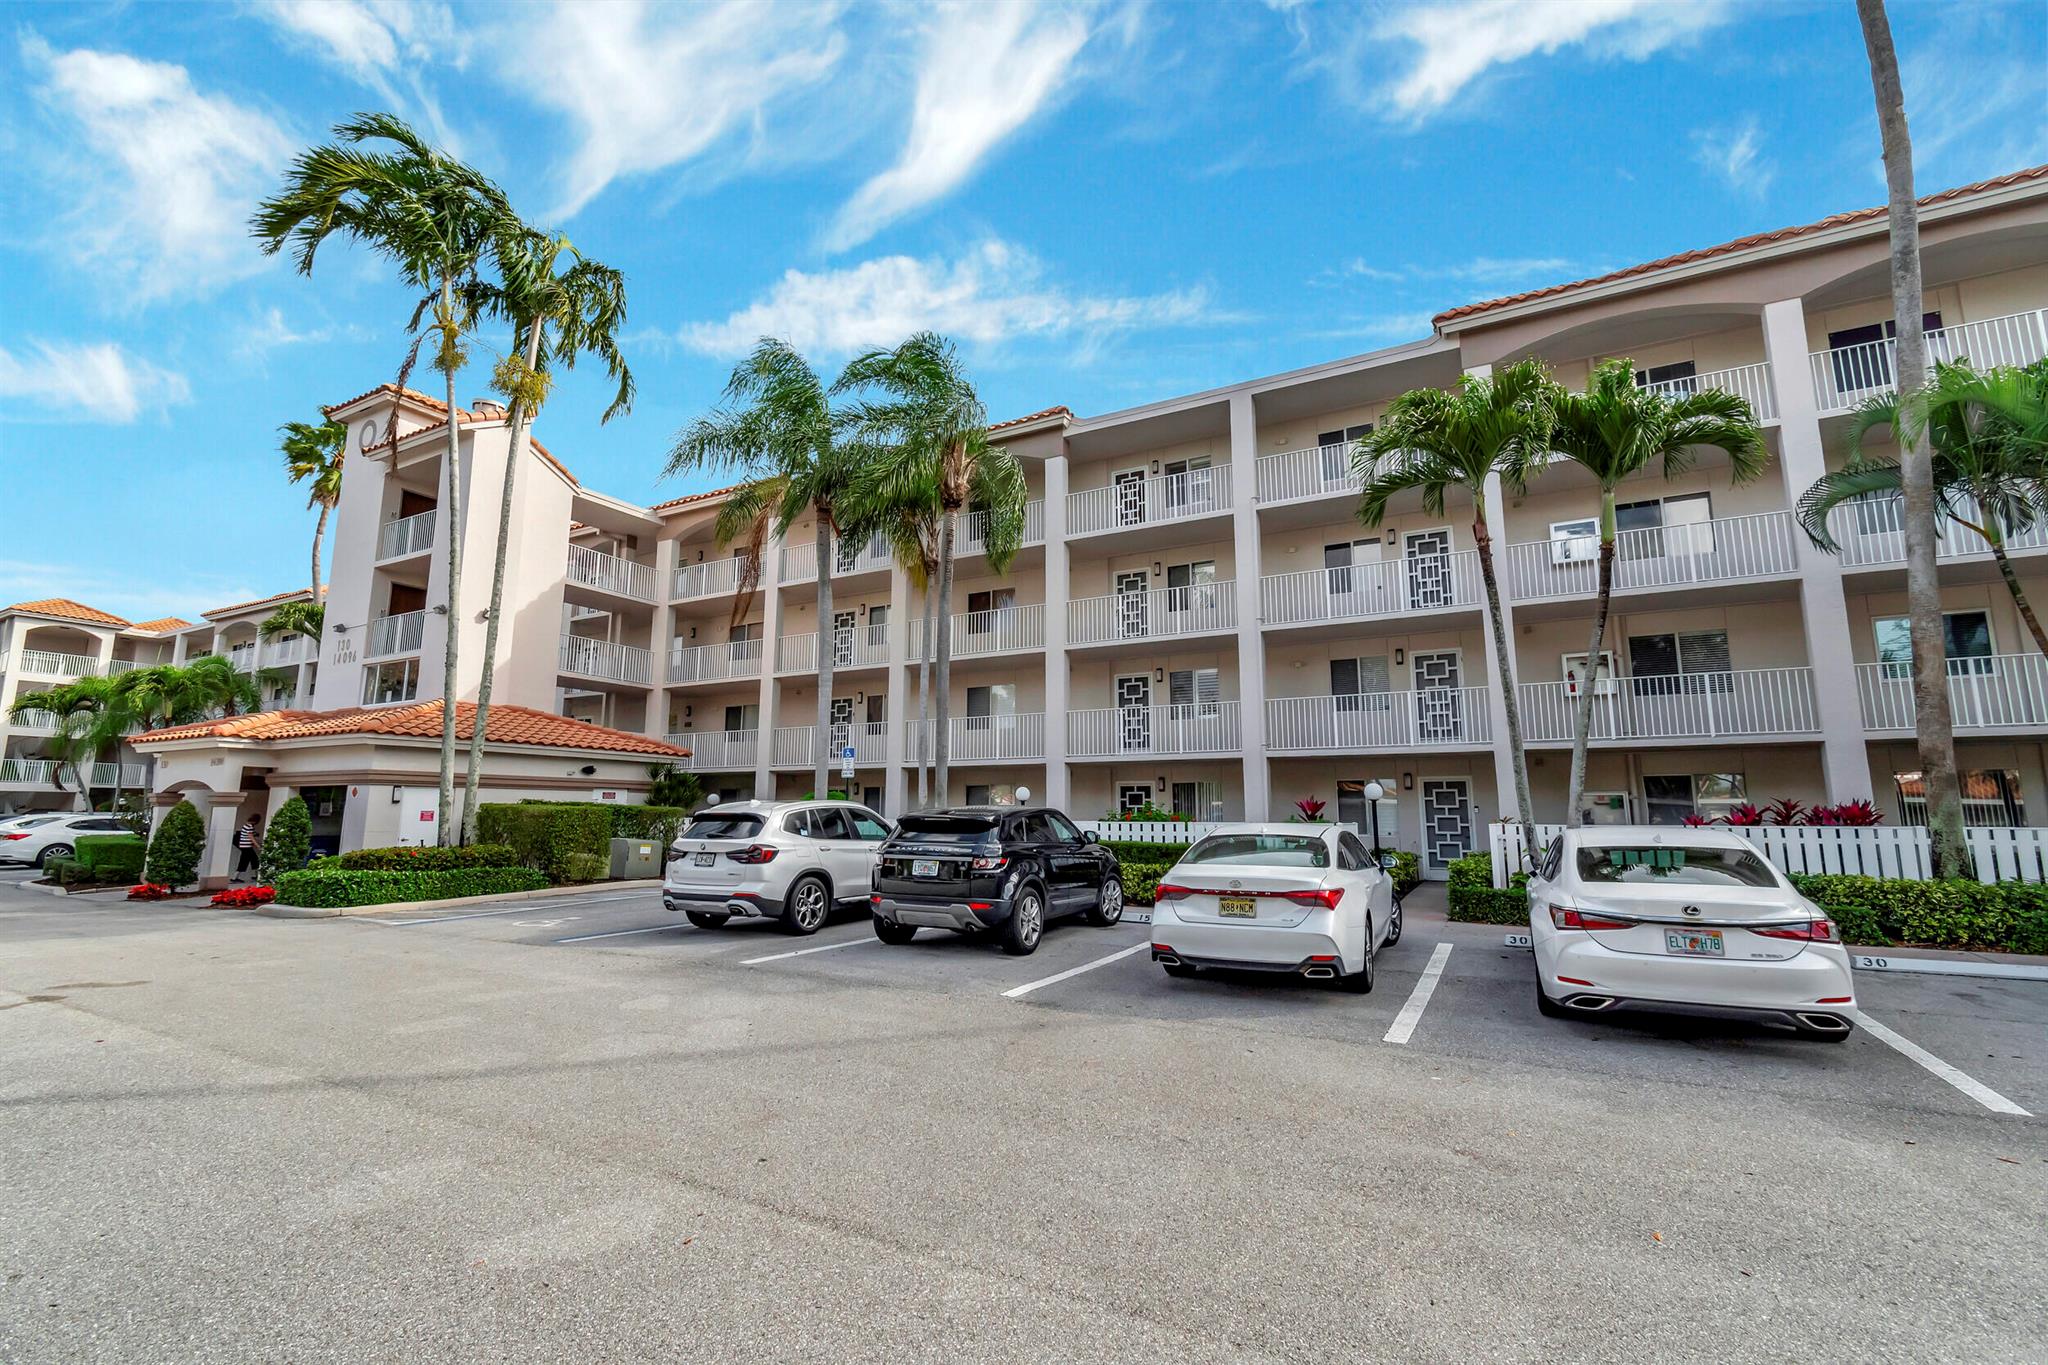
Active
$330,000
2
bds
|
2
ba
|
1,500
sqft
|
built
1994
14096 Huntington Pointe Dr, Delray Beach, FL 33484
$-836
Cash flow
-13.2%
Cash-on-Cash Return
3.2%
Cap rate
0.9%
Rent to Value Ratio
Active
$5,995,000
5
bds
|
6
ba
|
5,658
sqft
|
built
2004
1845 Dusty Miller Dr, Delray Beach, FL 33483
$-30,969
Cash flow
-27.0%
Cash-on-Cash Return
0.1%
Cap rate
0.1%
Rent to Value Ratio
Active
$349,000
2
bds
|
2
ba
|
1,290
sqft
|
built
1981
600 Egret Cir, Delray Beach, FL 33444
$-1,223
Cash flow
-18.3%
Cash-on-Cash Return
2.1%
Cap rate
0.7%
Rent to Value Ratio
Active
$824,000
3
bds
|
3
ba
|
2,977
sqft
|
built
2003
4853 N Classical Blvd, Delray Beach, FL 33445
$-949
Cash flow
-6.0%
Cash-on-Cash Return
4.9%
Cap rate
0.7%
Rent to Value Ratio
Active
$1,195,000
3
bds
|
2
ba
|
1,558
sqft
|
built
1956
233 Lake Ter, Delray Beach, FL 33444
$-3,023
Cash flow
-13.2%
Cash-on-Cash Return
3.2%
Cap rate
0.5%
Rent to Value Ratio
Active
$1,690,000
3
bds
|
2
ba
|
1,270
sqft
|
built
1926
701 SE 1st St, Delray Beach, FL 33483
$-7,368
Cash flow
-22.7%
Cash-on-Cash Return
1.1%
Cap rate
0.2%
Rent to Value Ratio
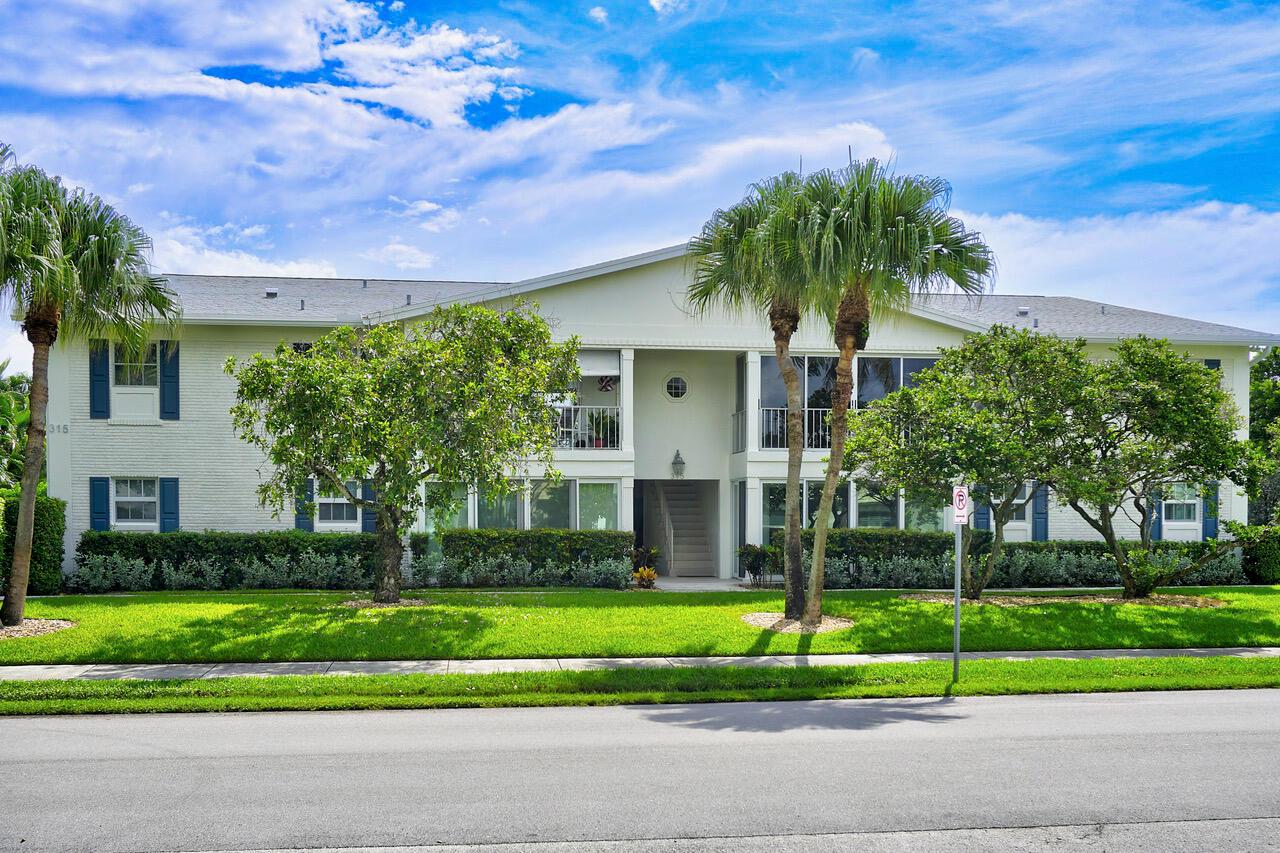
Active
$709,900
2
bds
|
2
ba
|
1,170
sqft
|
built
1972
315 Venetian Dr, Delray Beach, FL 33483
$-1,530
Cash flow
-11.2%
Cash-on-Cash Return
3.7%
Cap rate
0.6%
Rent to Value Ratio
Active
$749,000
3
bds
|
3
ba
|
1,643
sqft
|
built
1981
3021 Florida Blvd, Delray Beach, FL 33483
$-2,118
Cash flow
-14.8%
Cash-on-Cash Return
2.9%
Cap rate
0.5%
Rent to Value Ratio
Active
$565,000
3
bds
|
2
ba
|
1,488
sqft
|
built
2001
5344 Inwood Dr, Delray Beach, FL 33484
$-1,111
Cash flow
-10.3%
Cash-on-Cash Return
3.9%
Cap rate
0.6%
Rent to Value Ratio
Active
$1,067,000
3
bds
|
2
ba
|
1,296
sqft
|
built
1979
5675 Sims Rd, Delray Beach, FL 33484
$-2,587
Cash flow
-12.6%
Cash-on-Cash Return
3.4%
Cap rate
0.4%
Rent to Value Ratio
Active
$1,475,000
3
bds
|
4
ba
|
3,256
sqft
|
built
1981
4590 Live Oak Blvd, Delray Beach, FL 33445
$-2,711
Cash flow
-9.6%
Cash-on-Cash Return
4.1%
Cap rate
0.6%
Rent to Value Ratio

Active
$650,000
4
bds
|
2
ba
|
1,777
sqft
|
built
1973
371 Bishop Dr, Delray Beach, FL 33445
$-1,124
Cash flow
-9.0%
Cash-on-Cash Return
4.2%
Cap rate
0.6%
Rent to Value Ratio