Delray Beach, FL Investment Properties for Sale
Browse homes for sale and investment properties in Delray Beach, FL. Refine your search by price, property type, or more.
Best cash flowing properties in Delray Beach, FL
Active
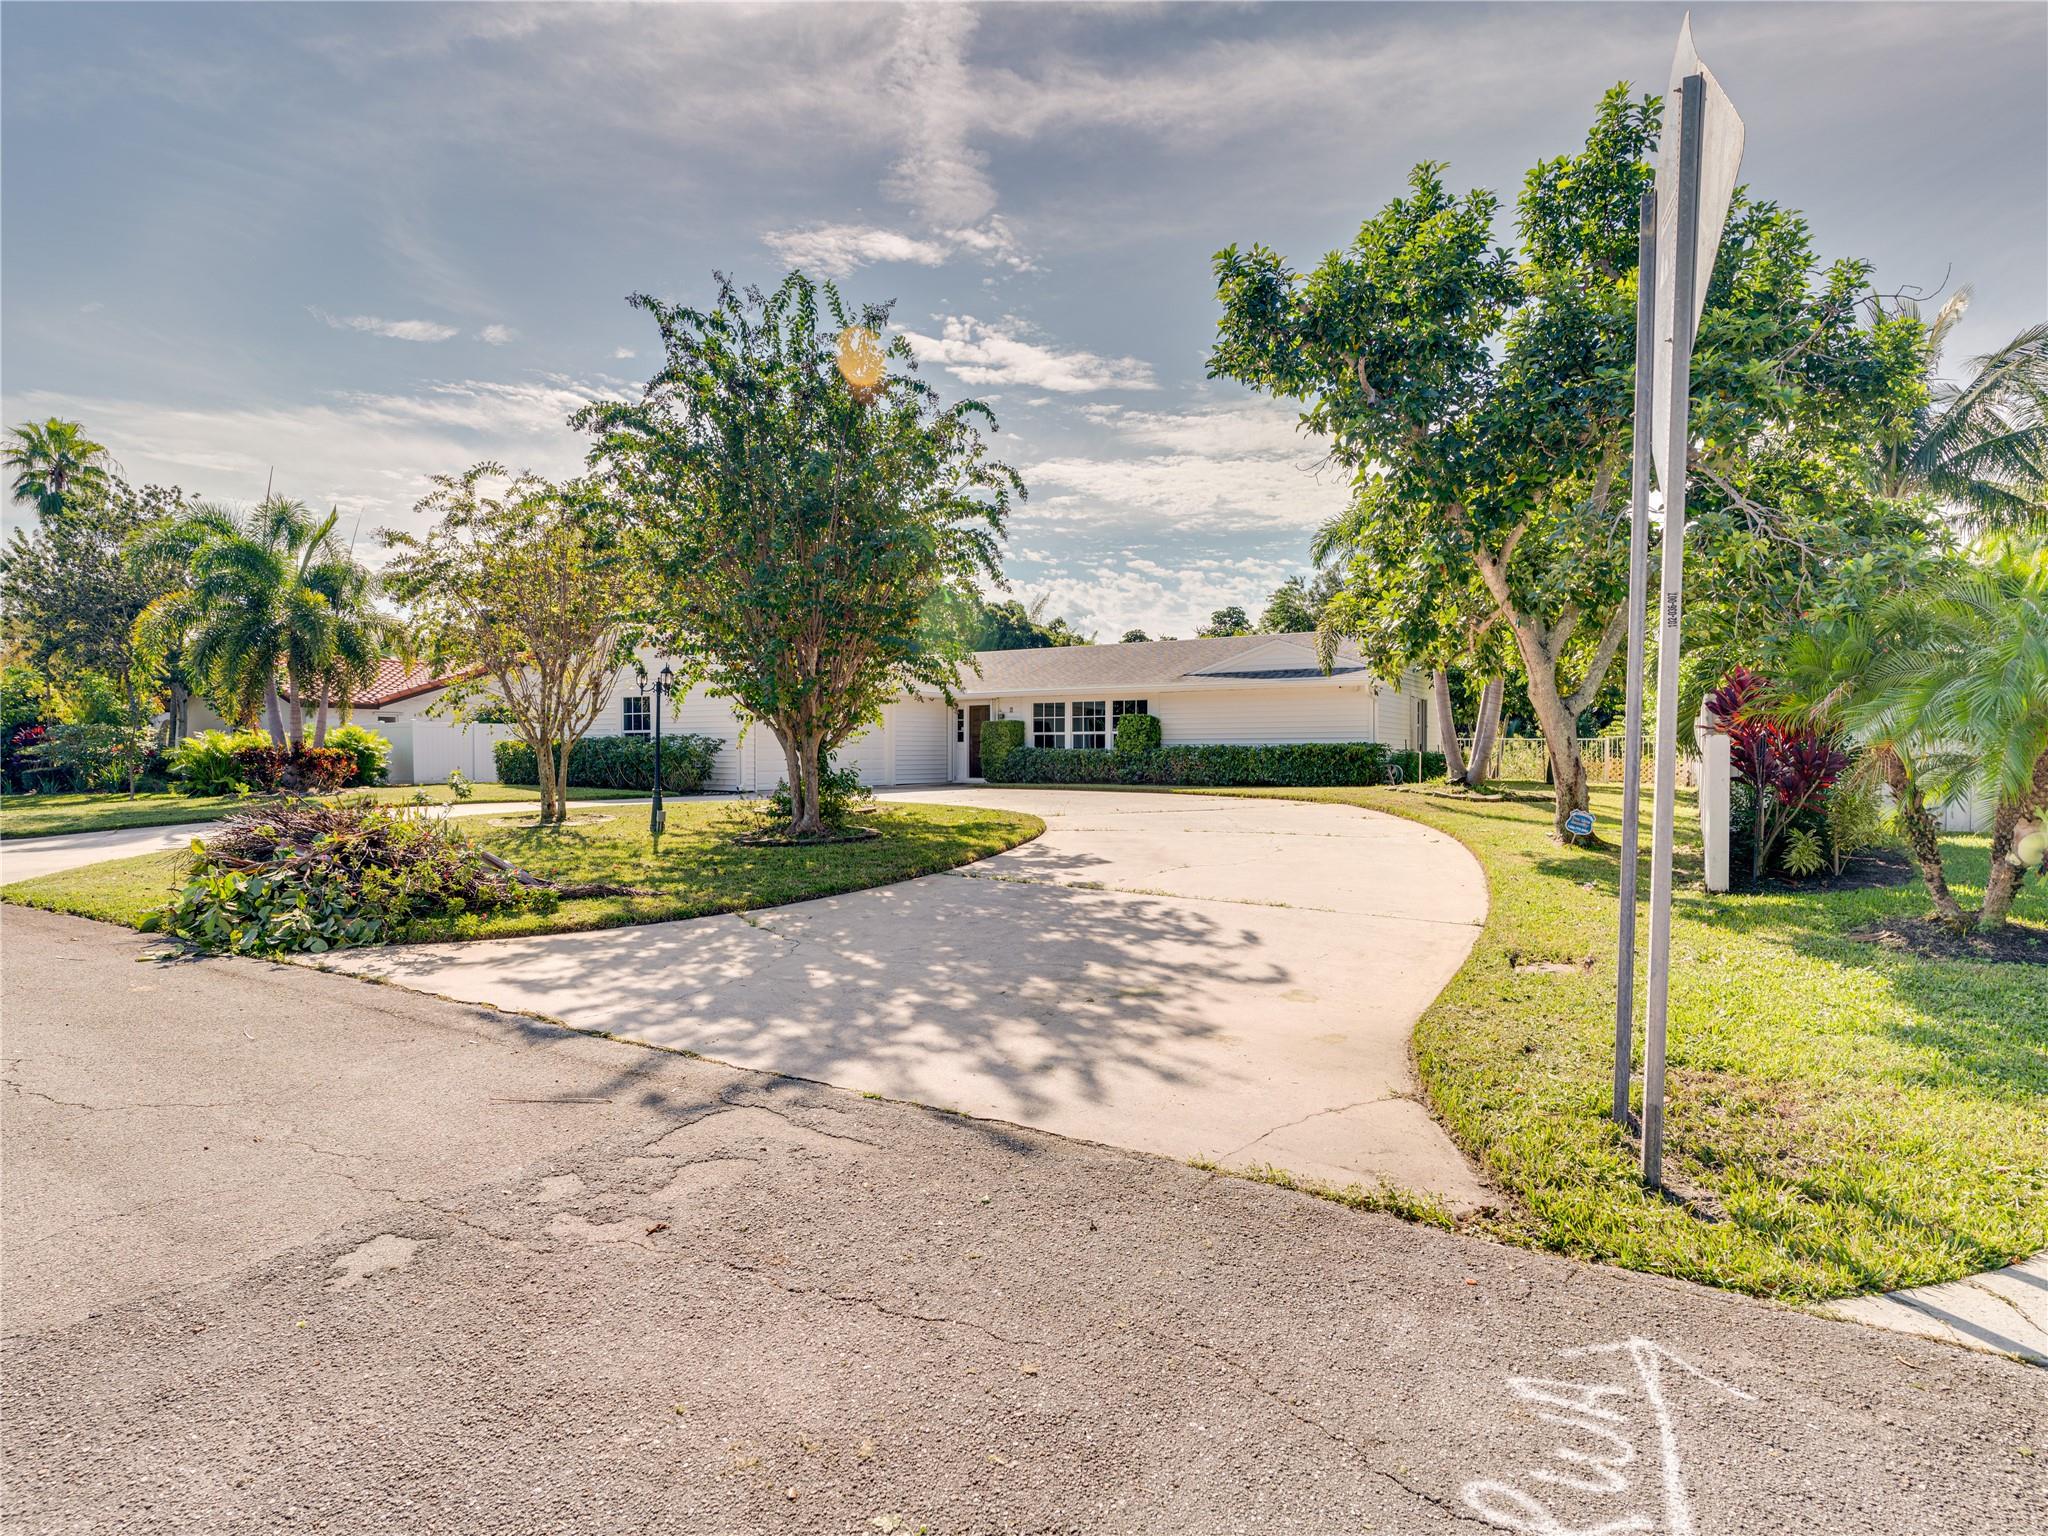
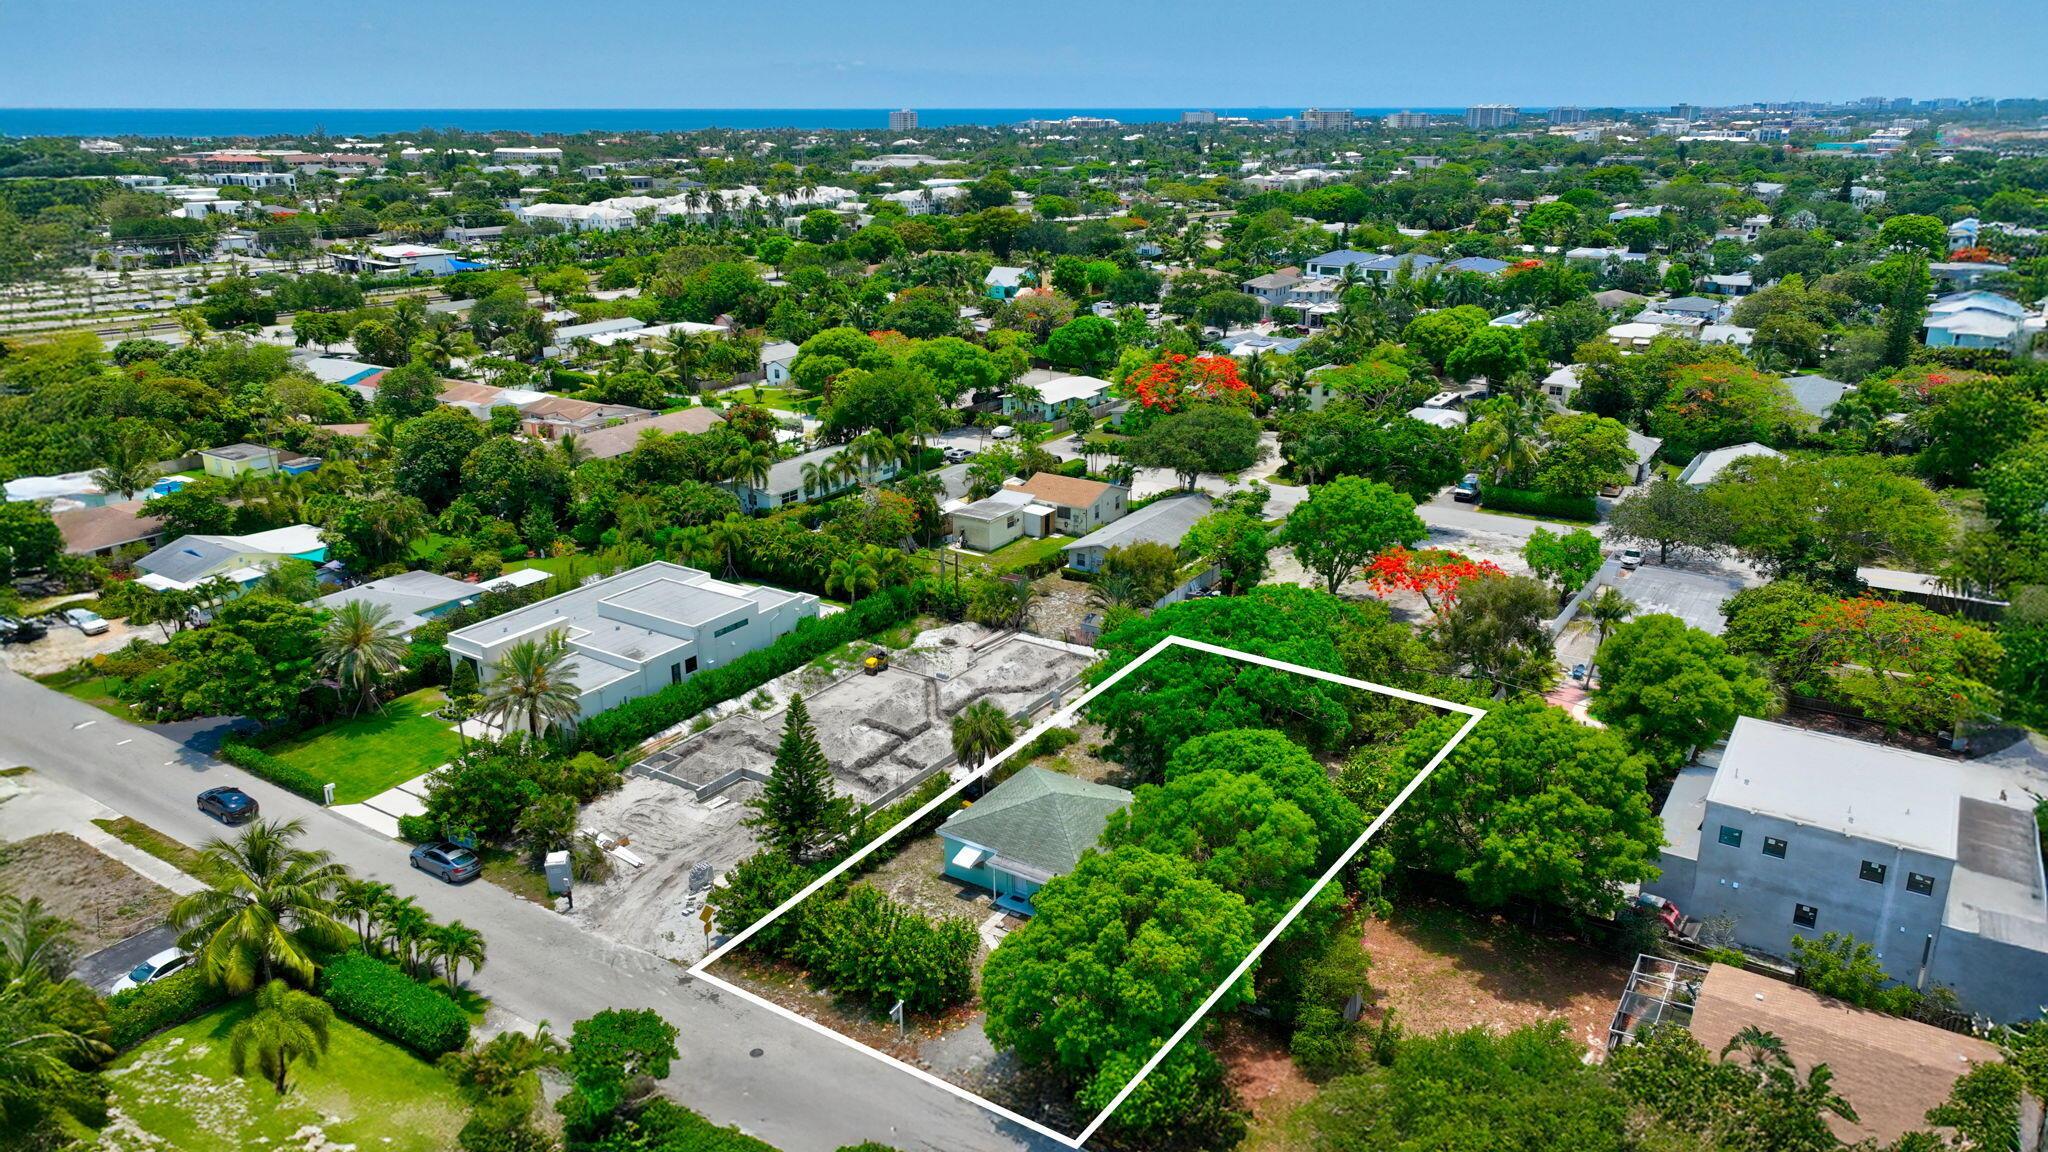
$1,250,000
3
bds
|
2
ba
|
1,578
sqft
|
built
1973
8 NW 24th St, Delray Beach, FL 33444
$-297
Cash flow
-1.2%
Cash-on-Cash Return
5.9%
Cap rate
0.8%
Rent to Value Ratio
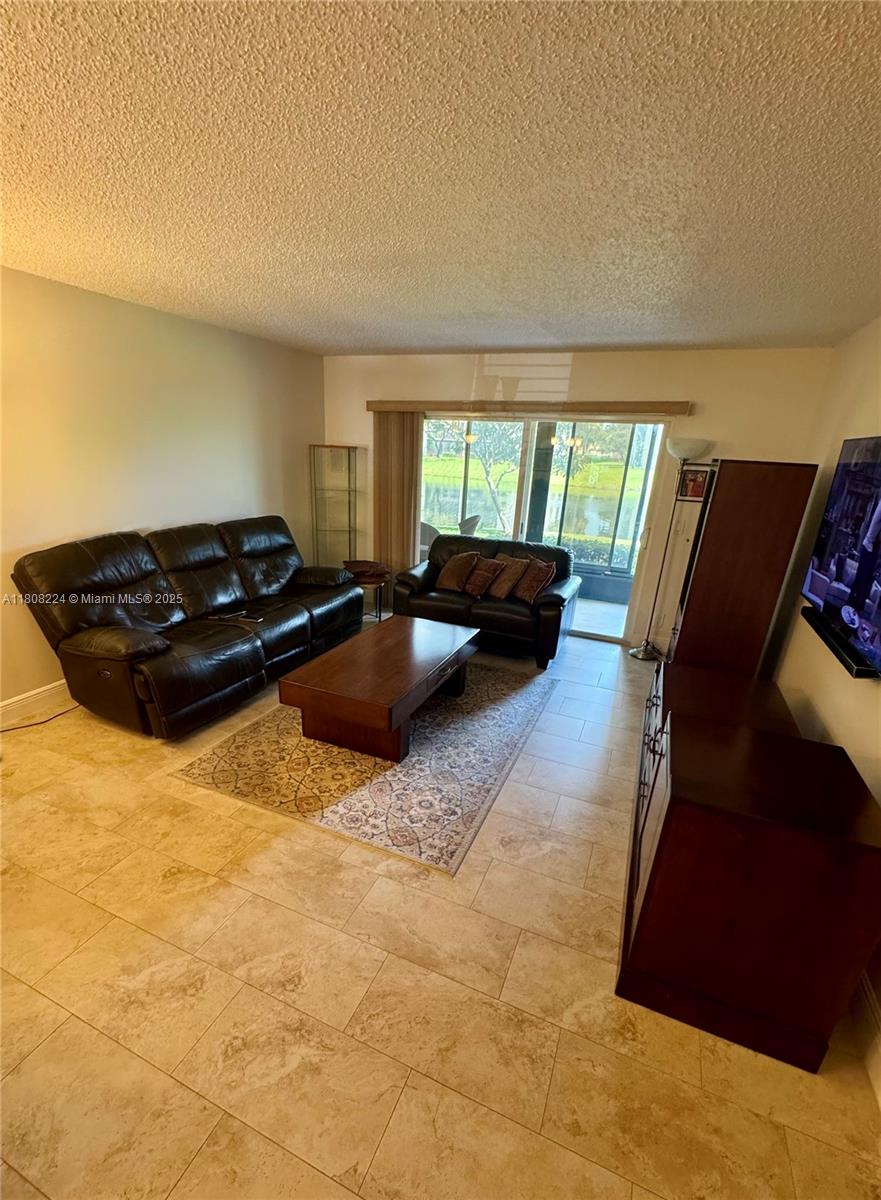
Active
$239,000
2
bds
|
2
ba
|
1,070
sqft
|
built
1981
14360 Strathmore Ln, Delray Beach, FL 33446
$-358
Cash flow
-7.8%
Cash-on-Cash Return
4.3%
Cap rate
1.0%
Rent to Value Ratio
643 out of 742 properties for sale in Delray Beach, FL
Limited Results Shown
Create a free account, or log in to reveal all property listings and enjoy the complete experience.
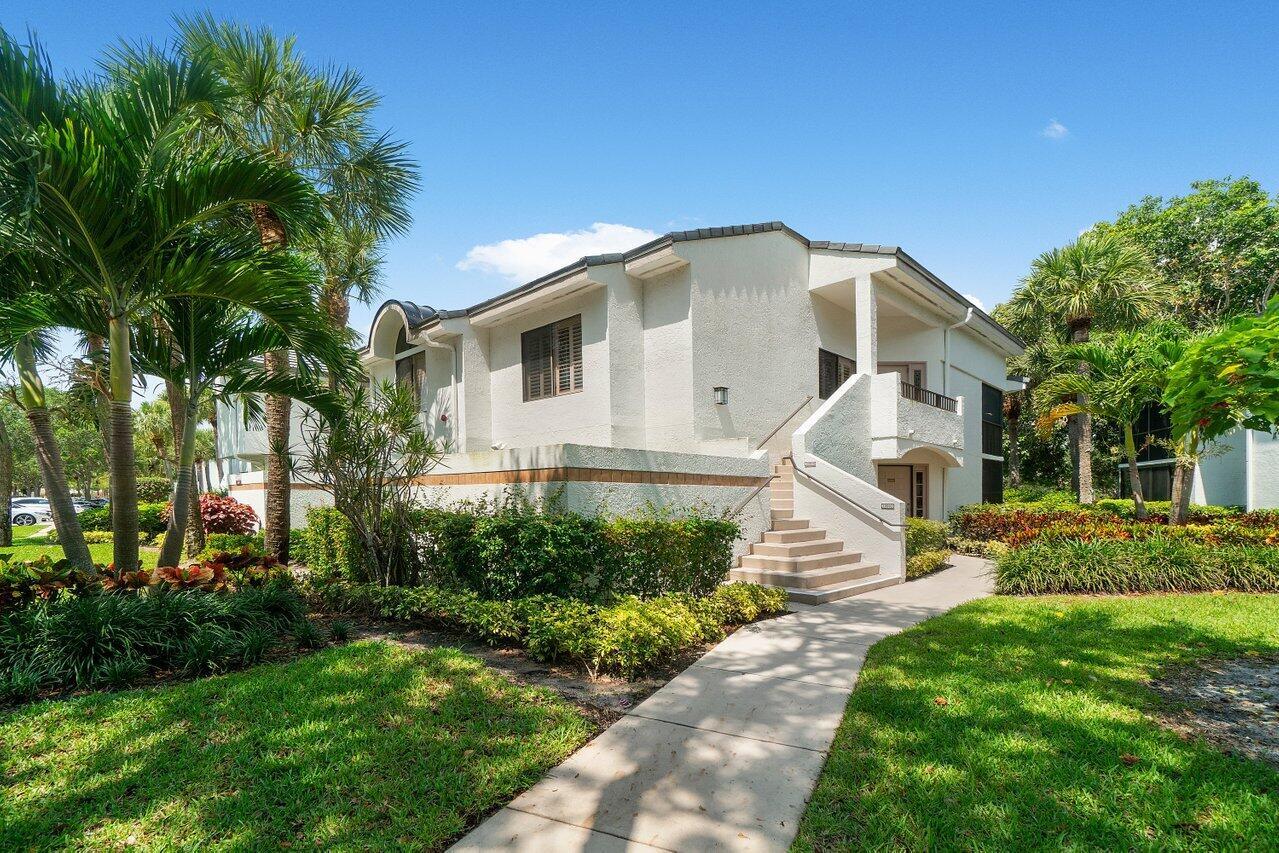
Active
$424,900
2
bds
|
2
ba
|
1,513
sqft
|
built
1988
15321 Strathearn Dr, Delray Beach, FL 33446
$-1,240
Cash flow
-15.2%
Cash-on-Cash Return
2.6%
Cap rate
0.6%
Rent to Value Ratio
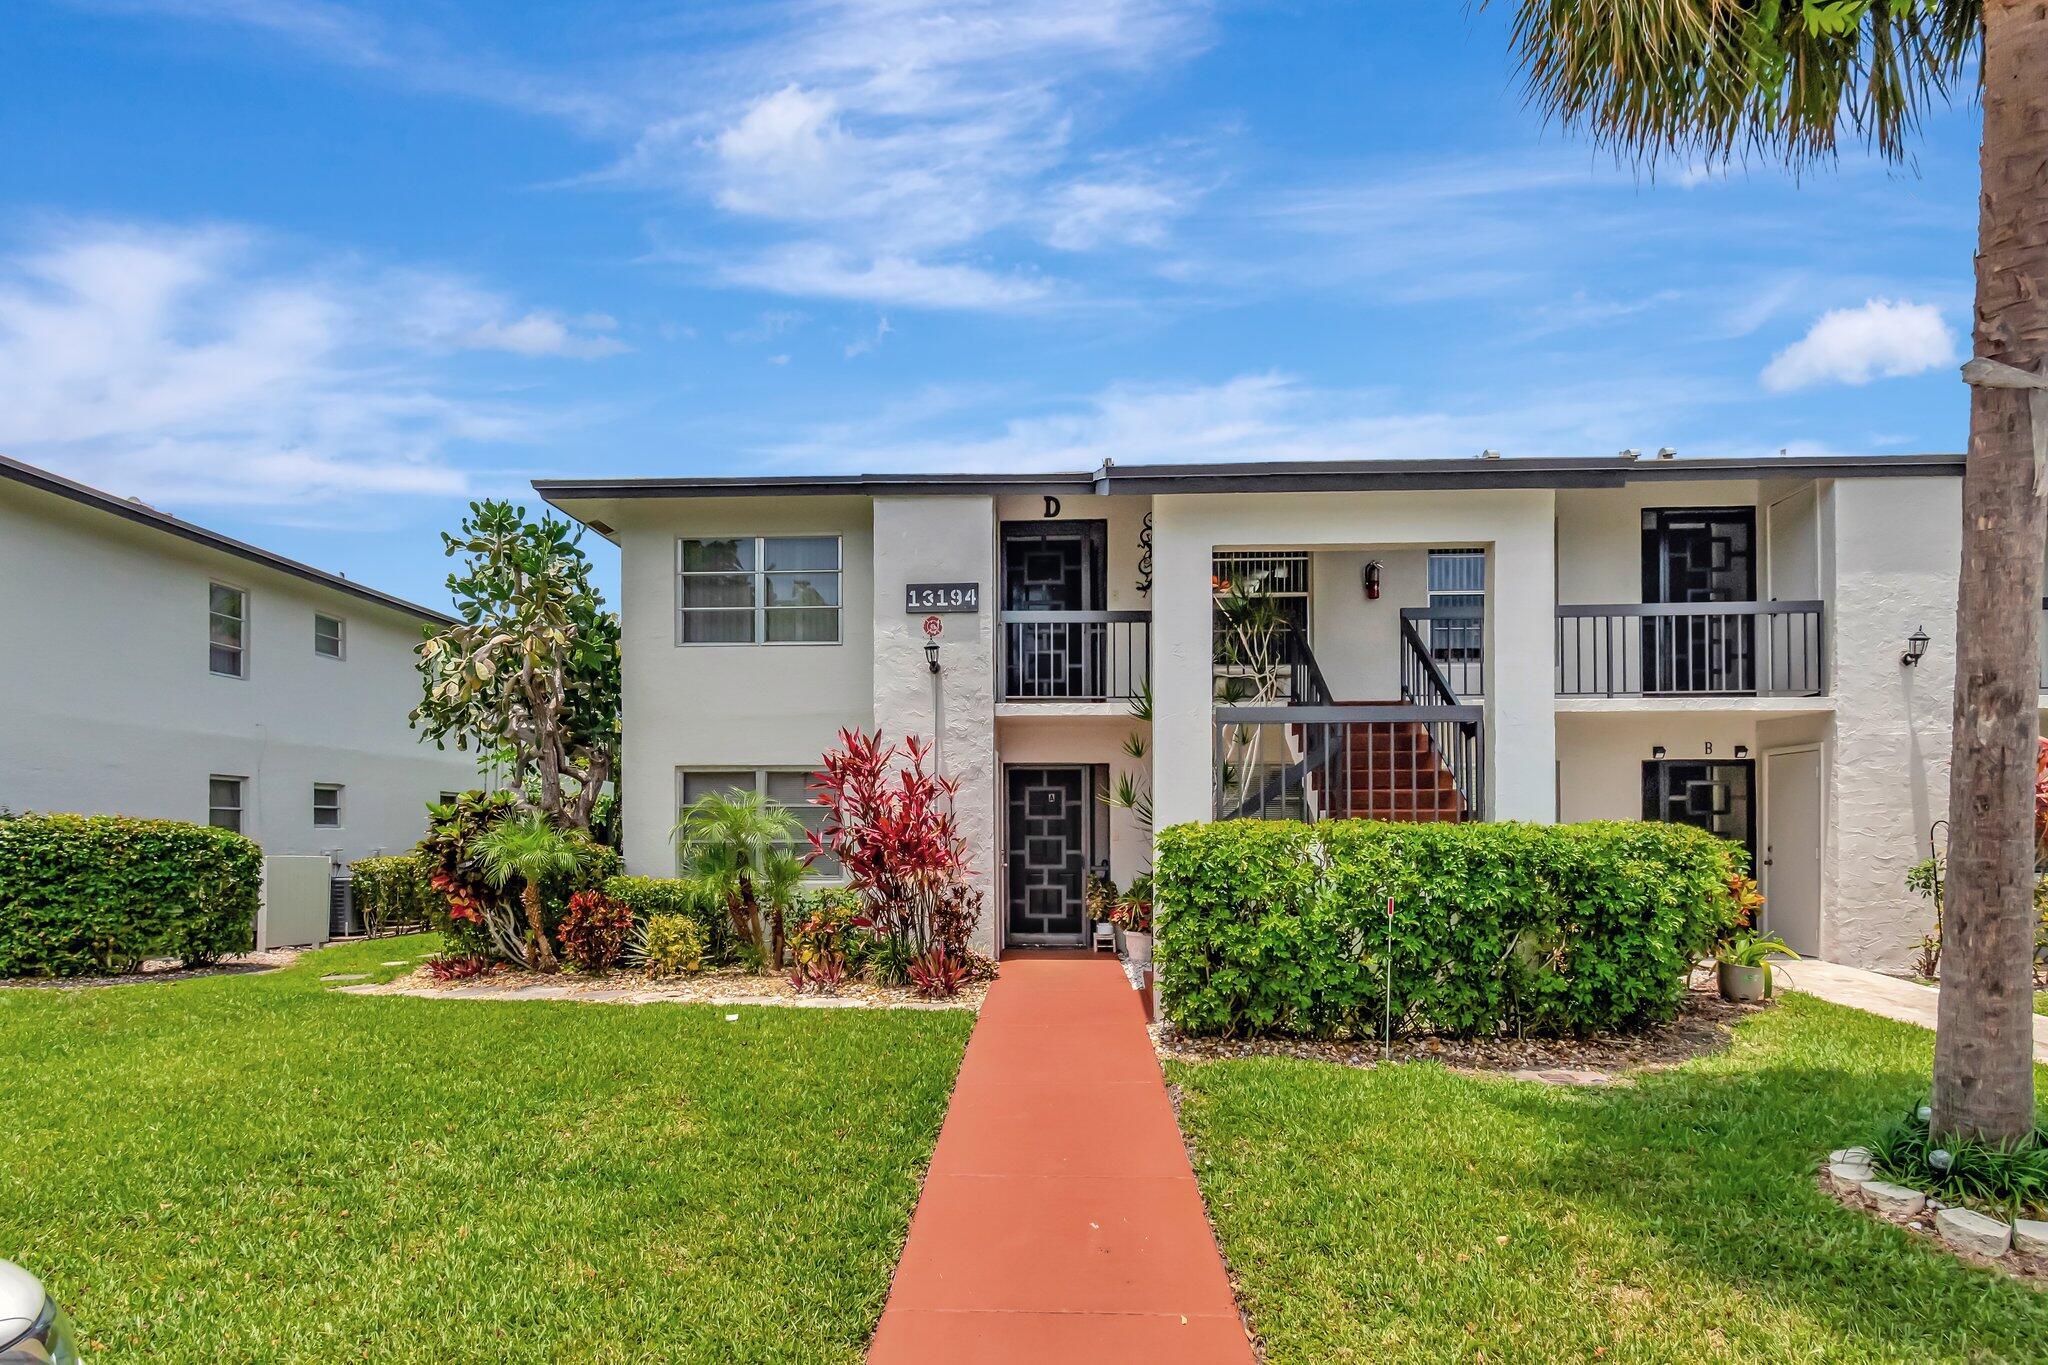
Active
$219,000
2
bds
|
2
ba
|
1,196
sqft
|
built
1980
13194 Lucinda Palm Ct, Delray Beach, FL 33484
$-493
Cash flow
-11.7%
Cash-on-Cash Return
3.4%
Cap rate
1.0%
Rent to Value Ratio
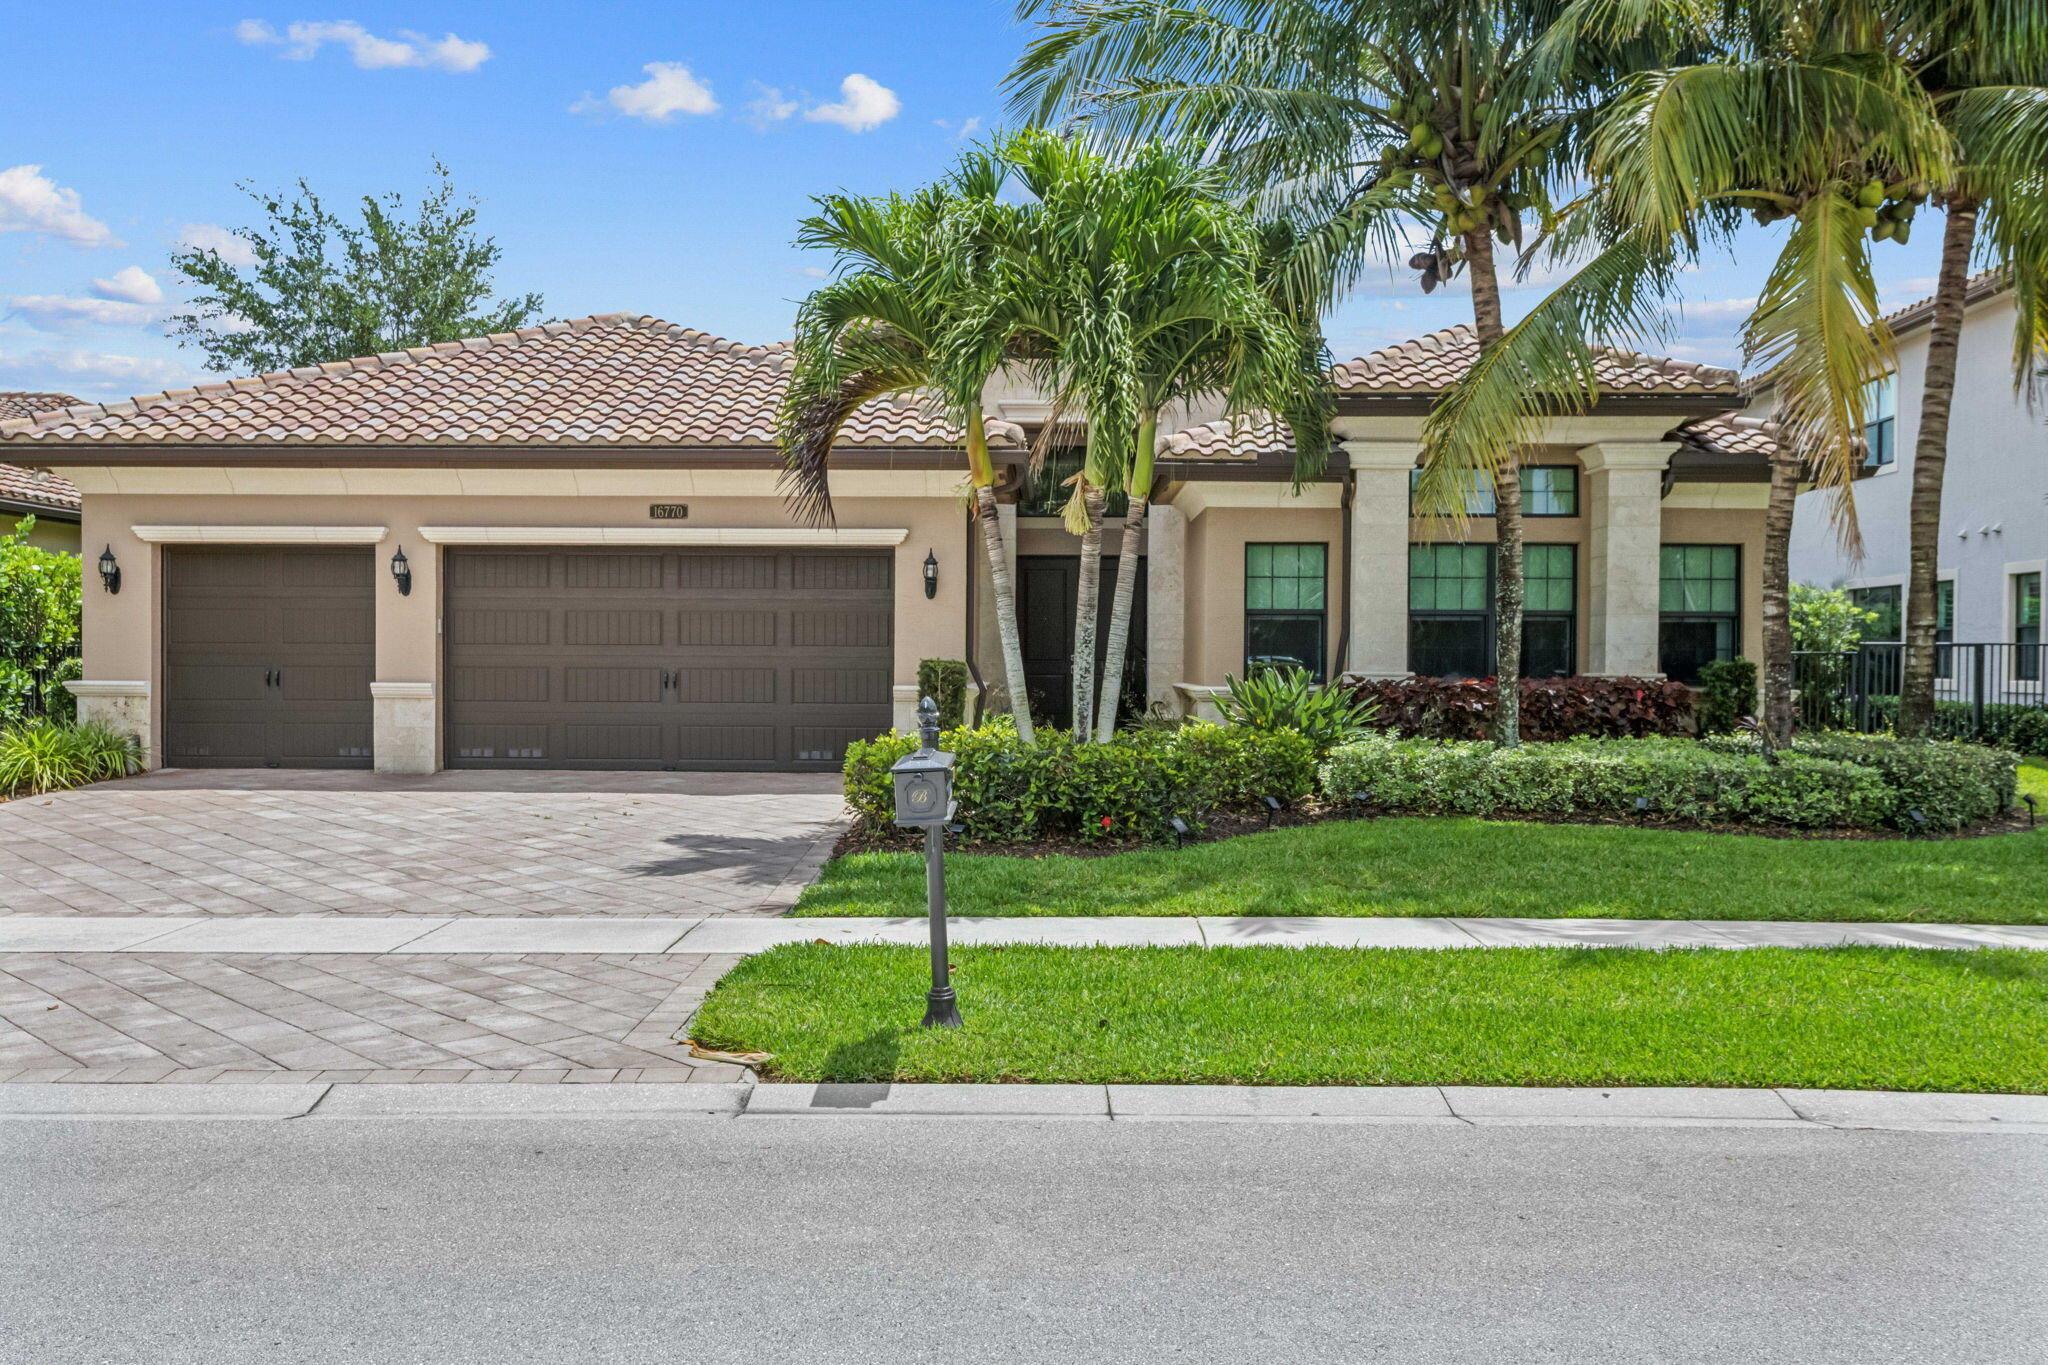
Active
$1,850,000
5
bds
|
4
ba
|
3,787
sqft
|
built
2016
16770 Burlington Bristol Ln, Delray Beach, FL 33446
$-5,559
Cash flow
-15.7%
Cash-on-Cash Return
2.5%
Cap rate
0.5%
Rent to Value Ratio
Pending
$265,900
2
bds
|
2
ba
|
1,211
sqft
|
built
1981
13505 Fishtail Palm Ct, Delray Beach, FL 33484
$-735
Cash flow
-14.4%
Cash-on-Cash Return
2.8%
Cap rate
0.8%
Rent to Value Ratio
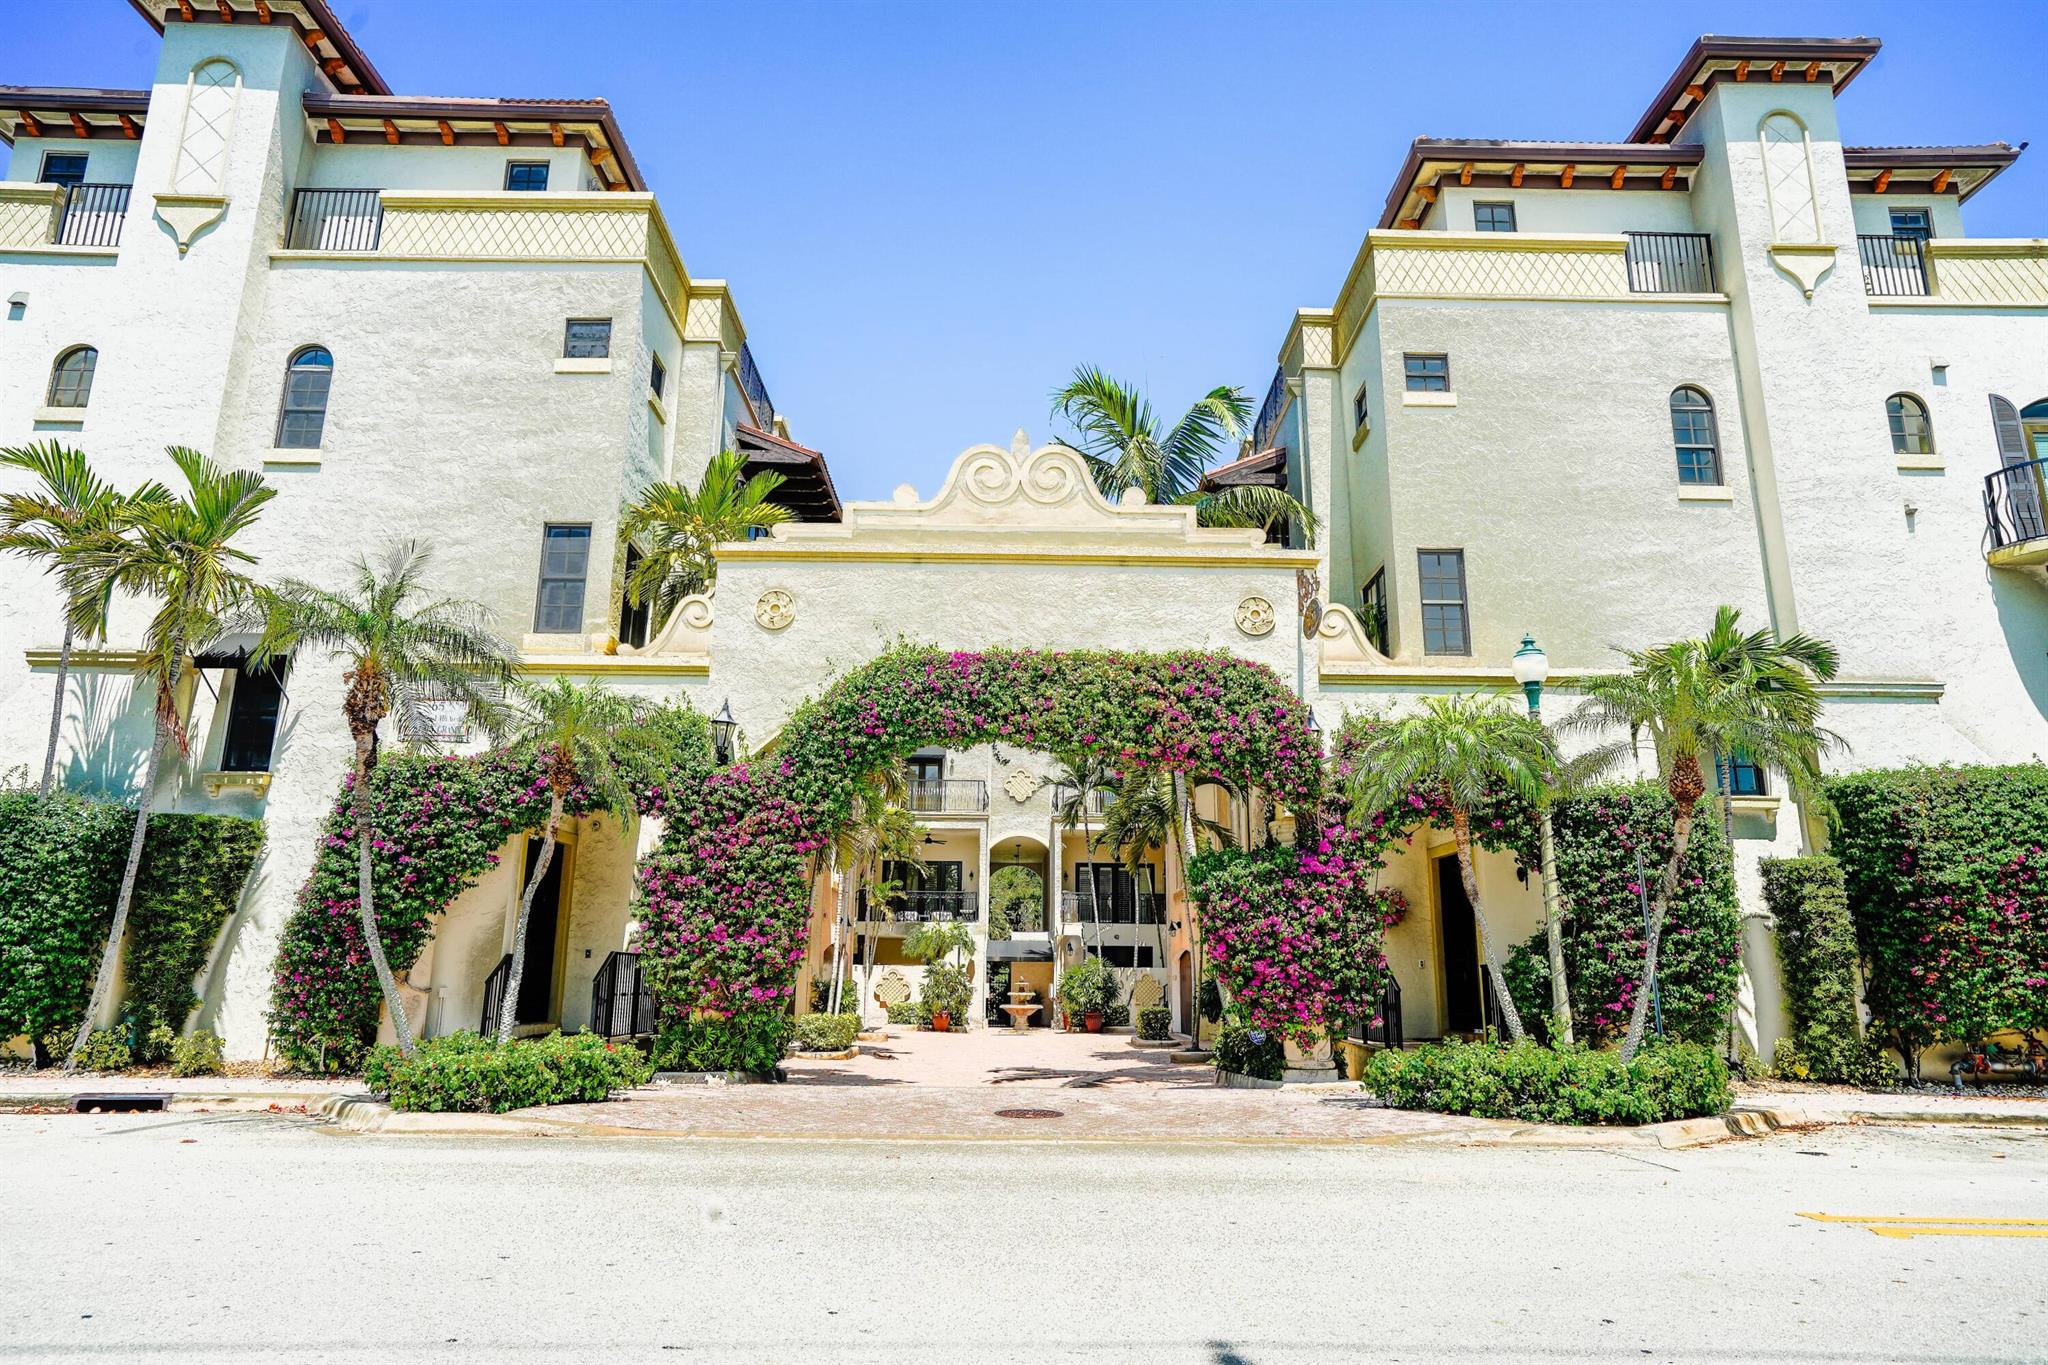
Active
$1,900,000
3
bds
|
5
ba
|
2,831
sqft
|
built
2005
65 NE 4th Ave, Delray Beach, FL 33483
$-6,889
Cash flow
-18.9%
Cash-on-Cash Return
1.8%
Cap rate
0.4%
Rent to Value Ratio
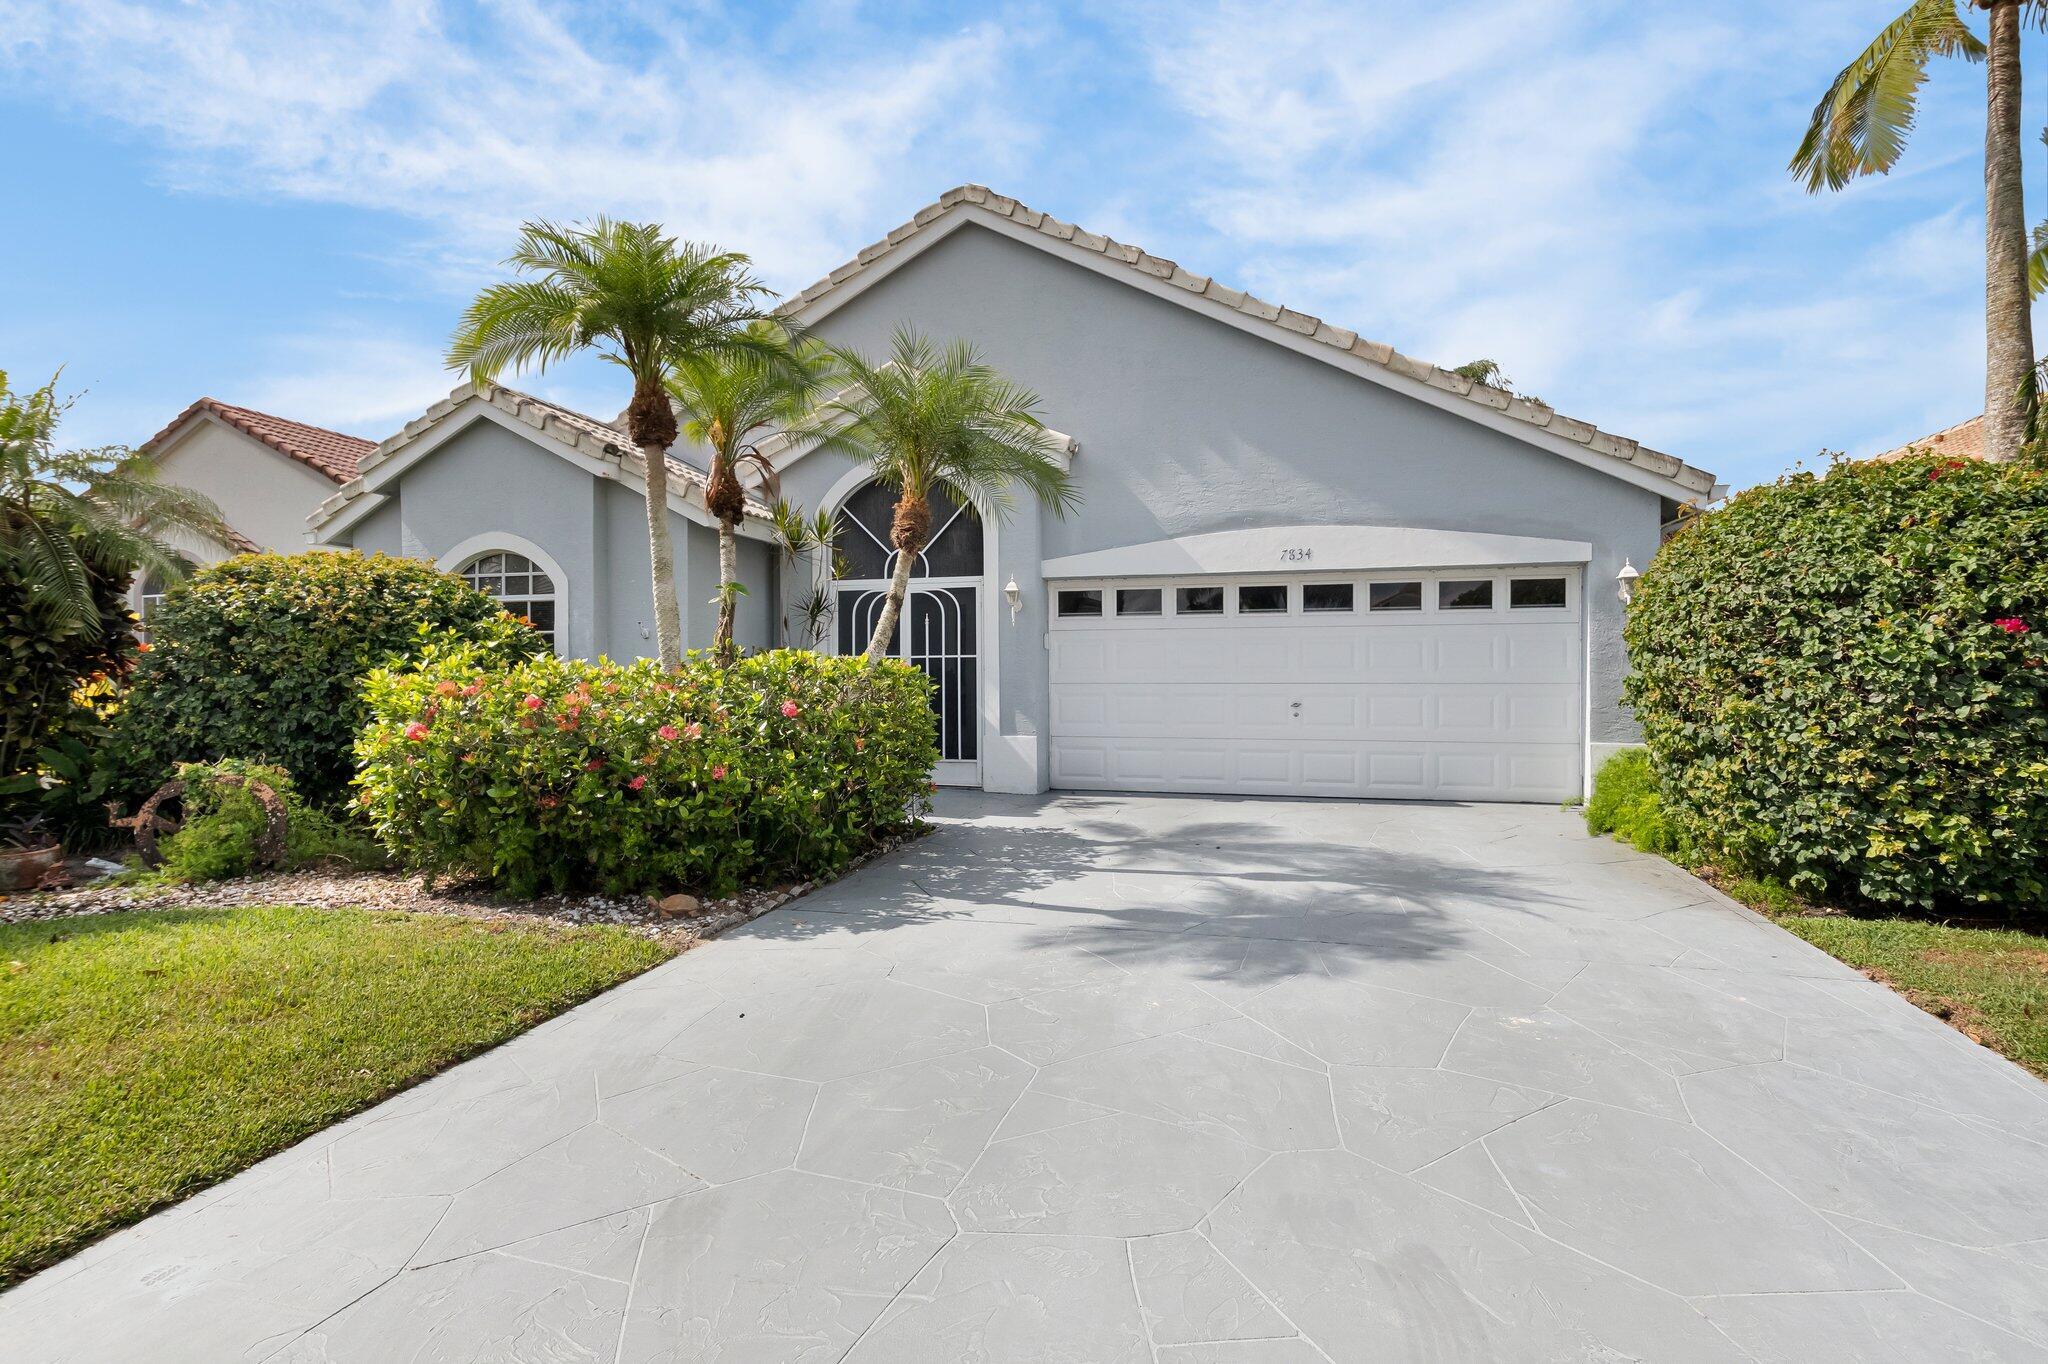
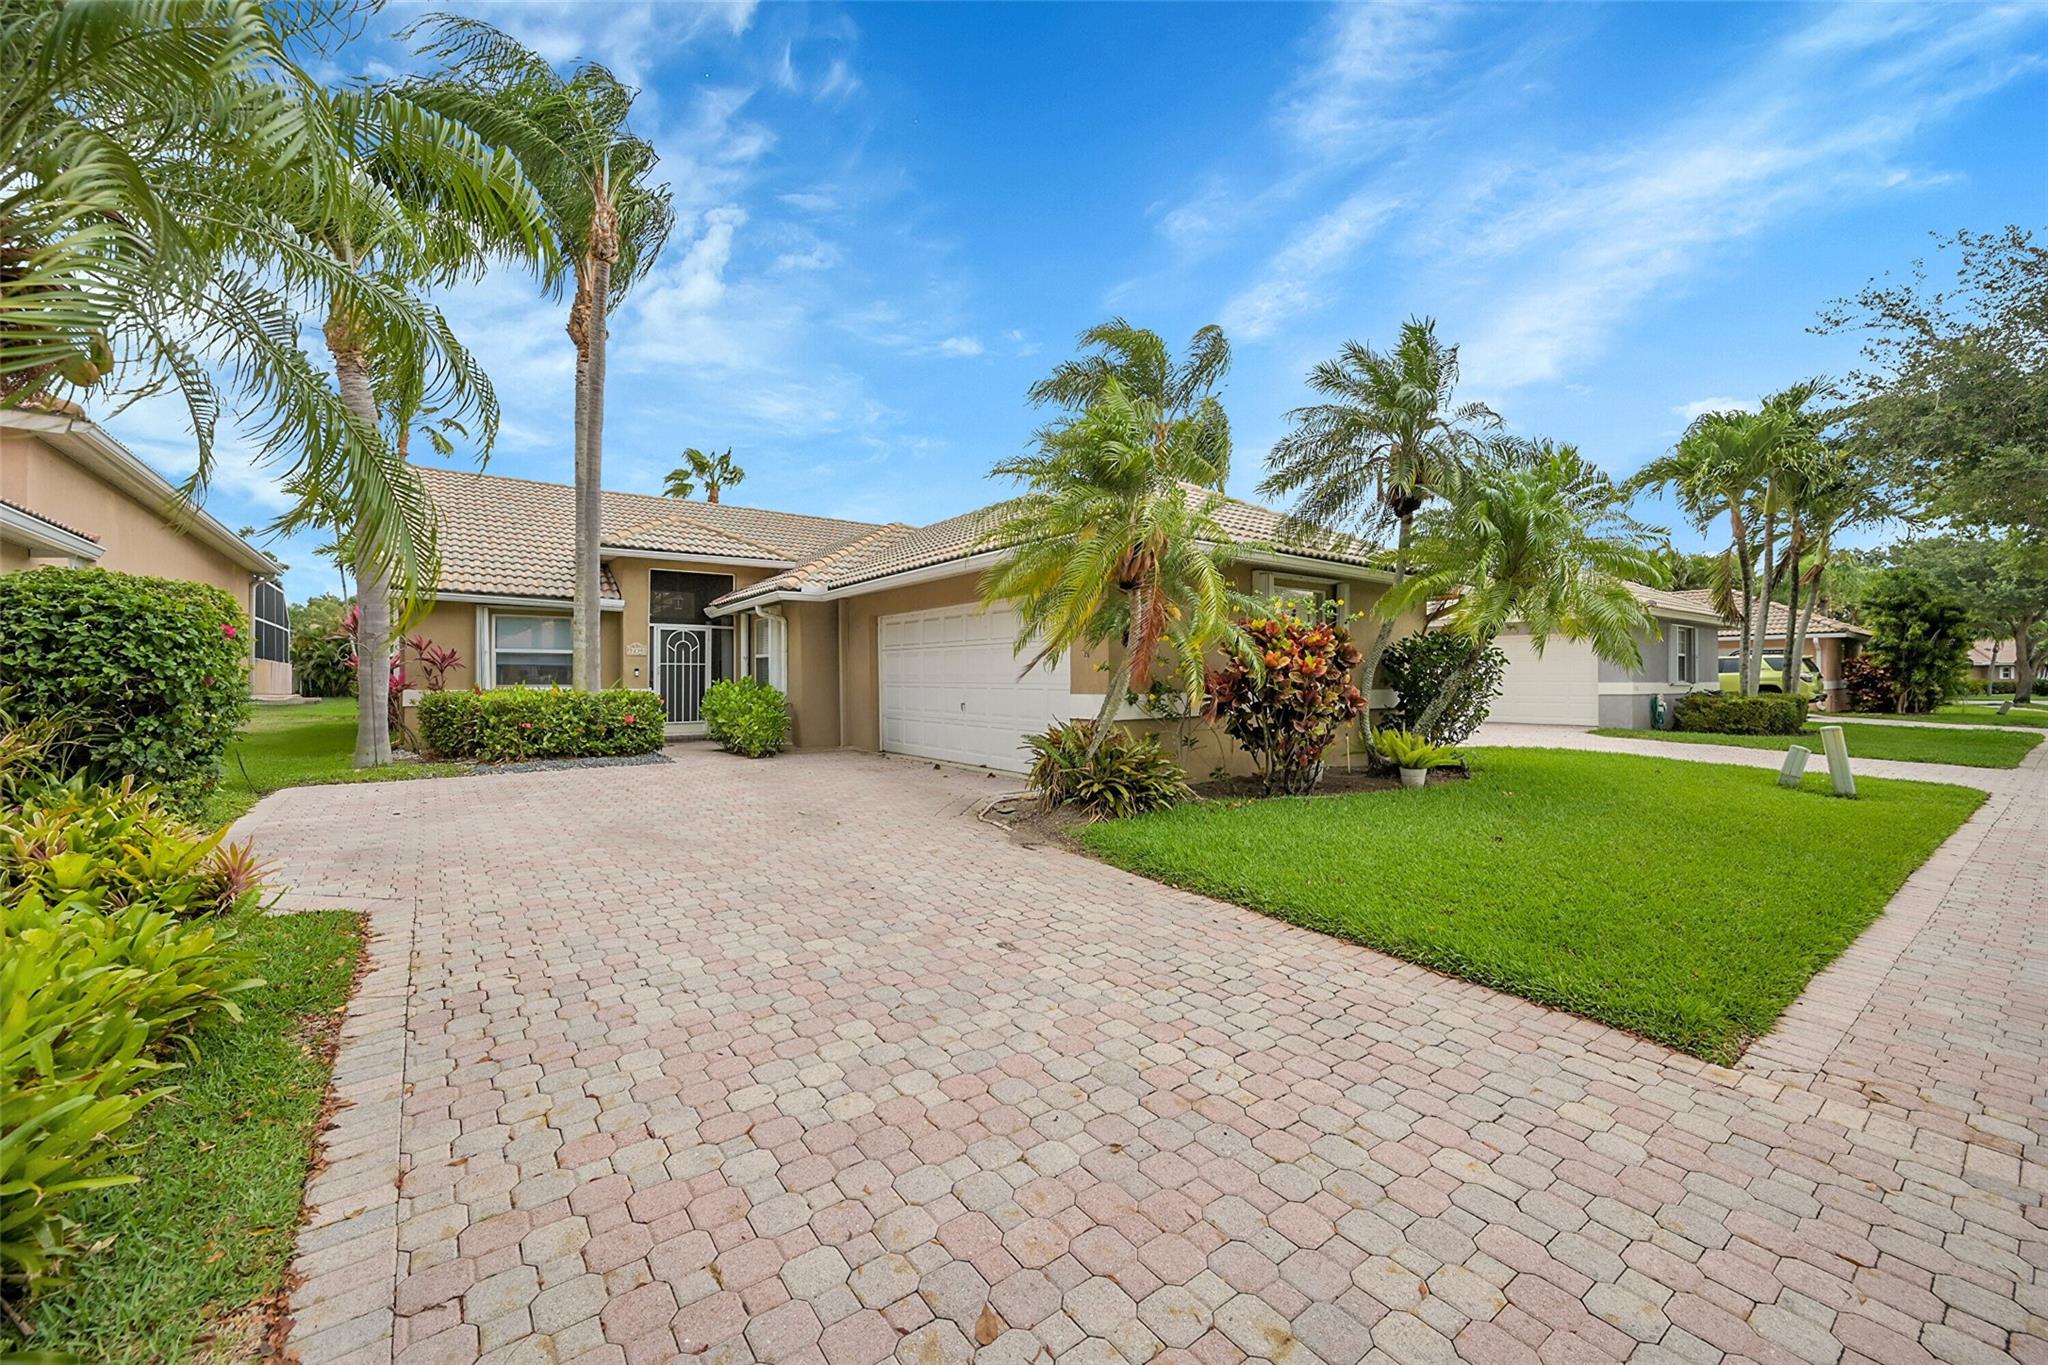
Active
$500,000
3
bds
|
2
ba
|
1,644
sqft
|
built
1994
7834 Stirling Bridge Blvd S, Delray Beach, FL 33446
$-1,008
Cash flow
-10.5%
Cash-on-Cash Return
3.7%
Cap rate
0.7%
Rent to Value Ratio
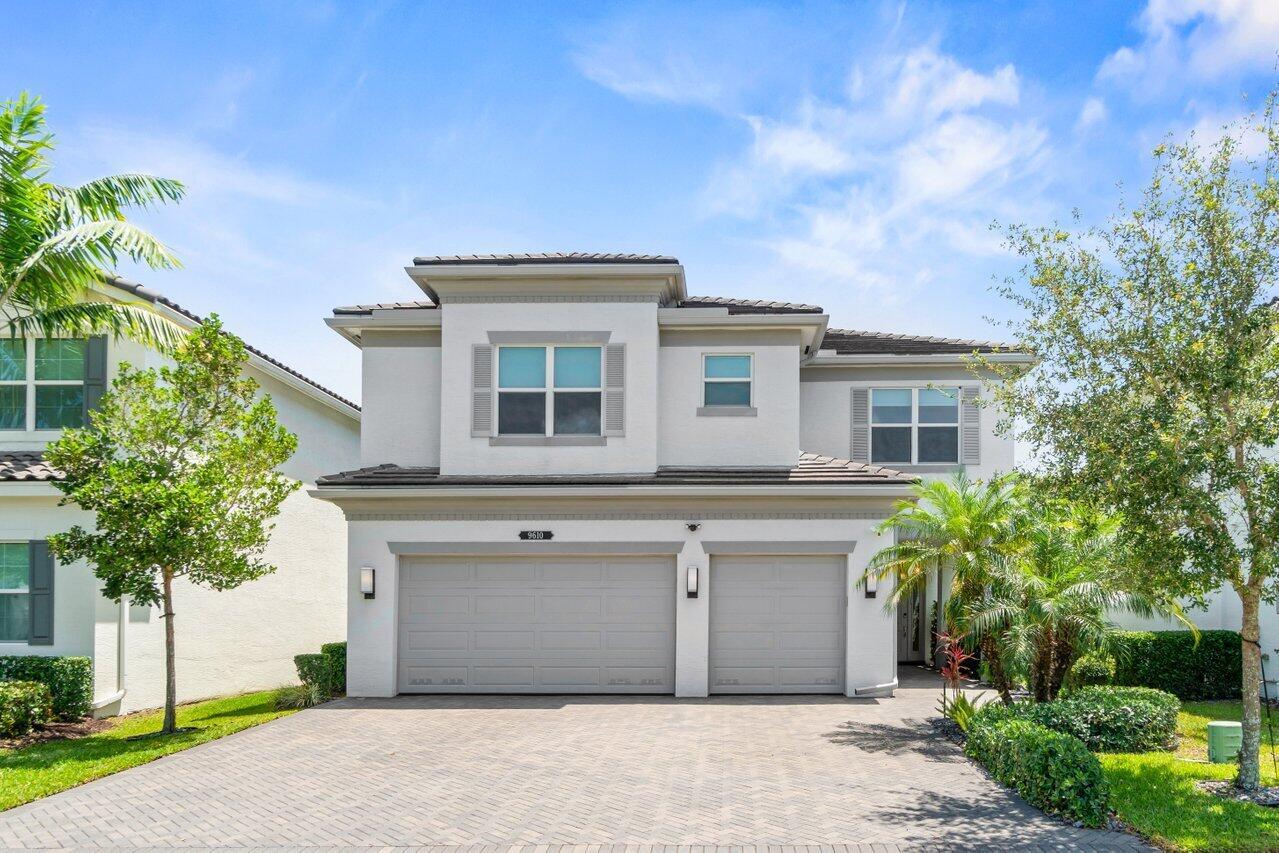
Active
$1,495,000
5
bds
|
6
ba
|
3,706
sqft
|
built
2019
9610 Sterling Shores St, Delray Beach, FL 33446
$-4,632
Cash flow
-16.2%
Cash-on-Cash Return
2.4%
Cap rate
0.4%
Rent to Value Ratio
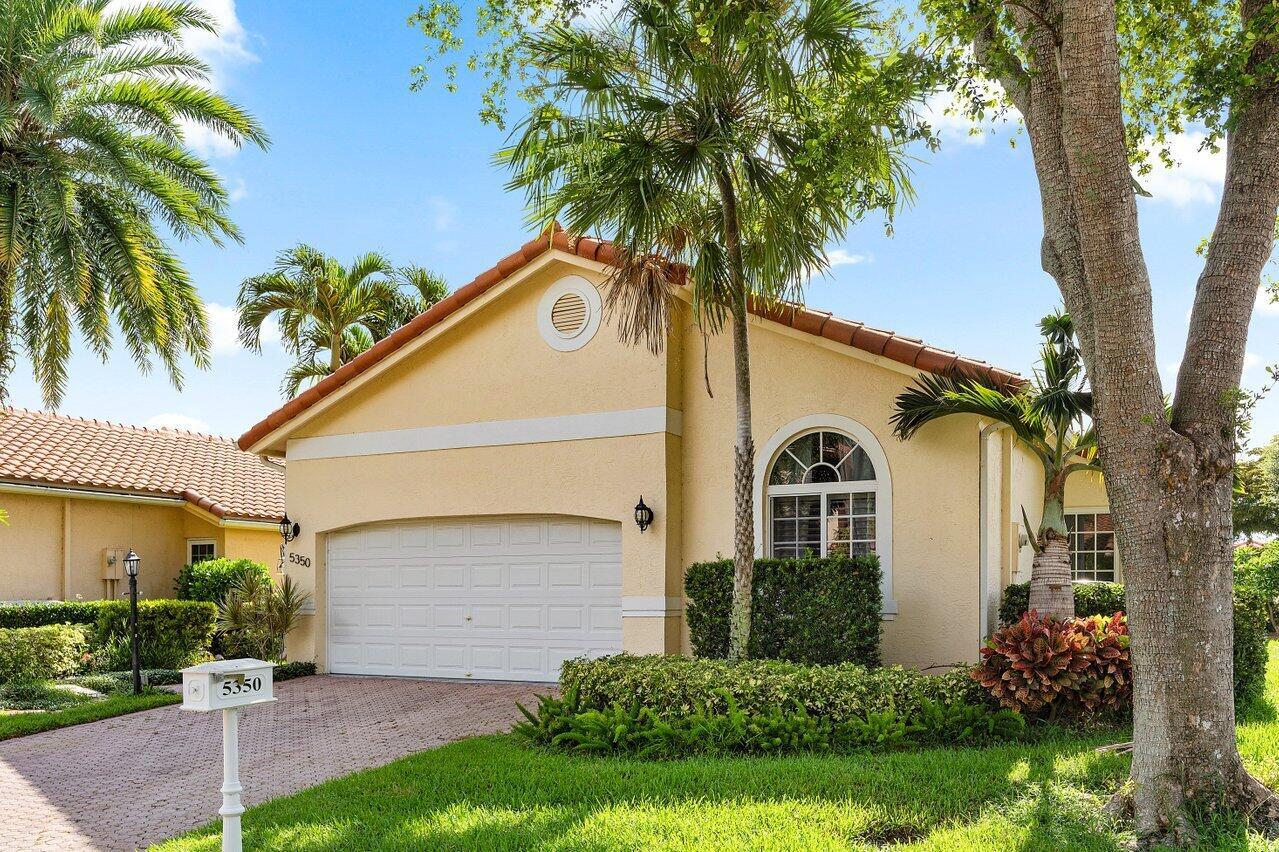
Active
$620,000
3
bds
|
2
ba
|
2,035
sqft
|
built
1992
5350 Casa Real Dr, Delray Beach, FL 33484
$-1,111
Cash flow
-9.3%
Cash-on-Cash Return
4.0%
Cap rate
0.7%
Rent to Value Ratio
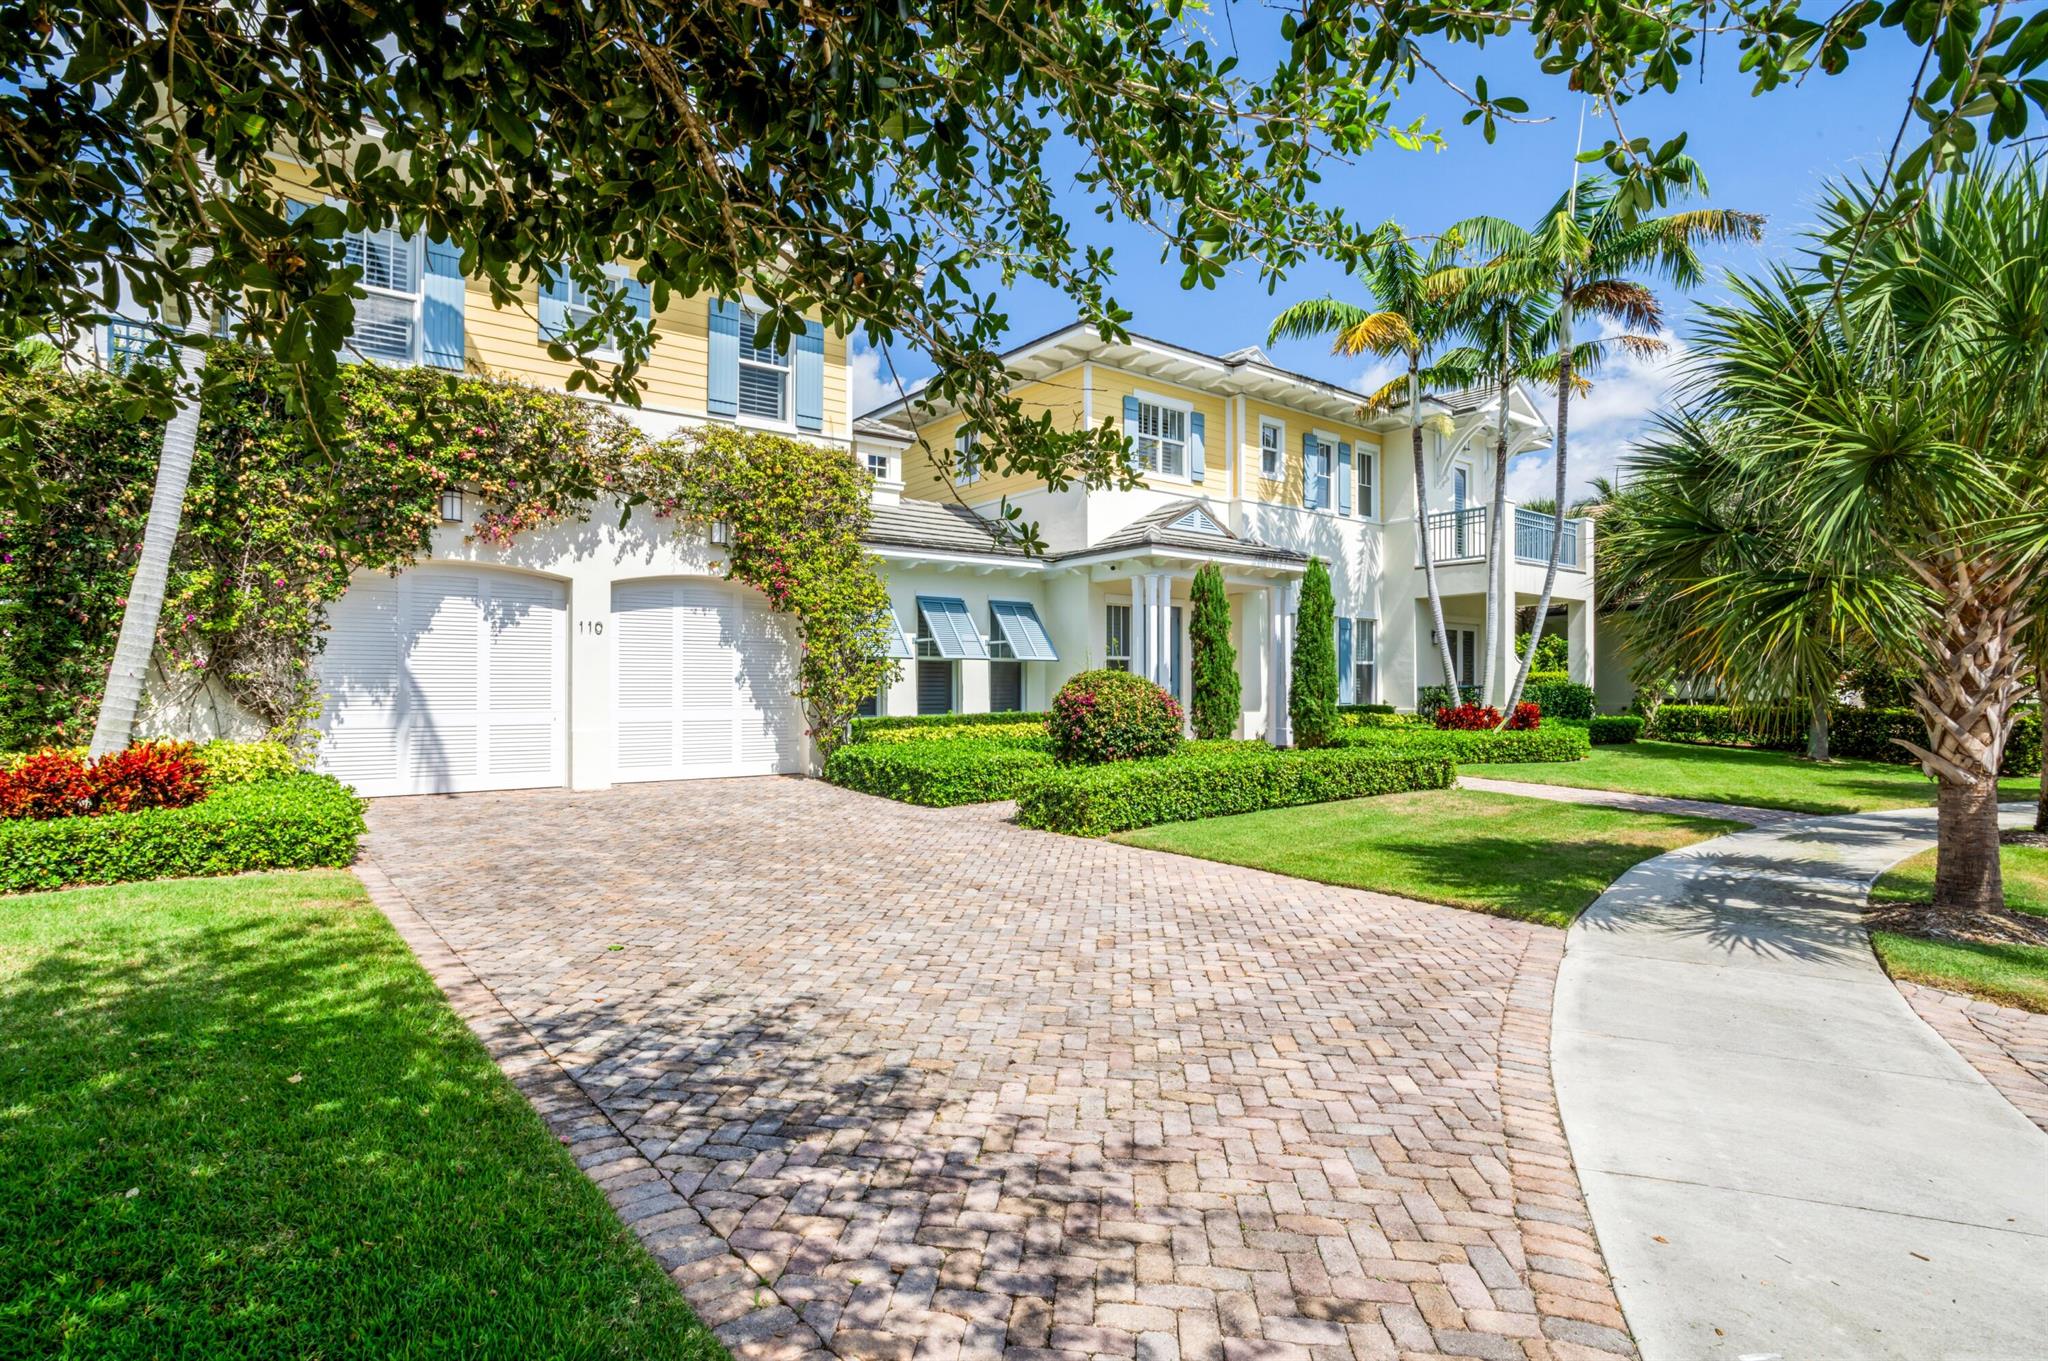
Active
$6,995,000
4
bds
|
5
ba
|
3,500
sqft
|
built
2012
110 Sea Ln, Delray Beach, FL 33483
$-36,147
Cash flow
-27.0%
Cash-on-Cash Return
-0.1%
Cap rate
0.1%
Rent to Value Ratio
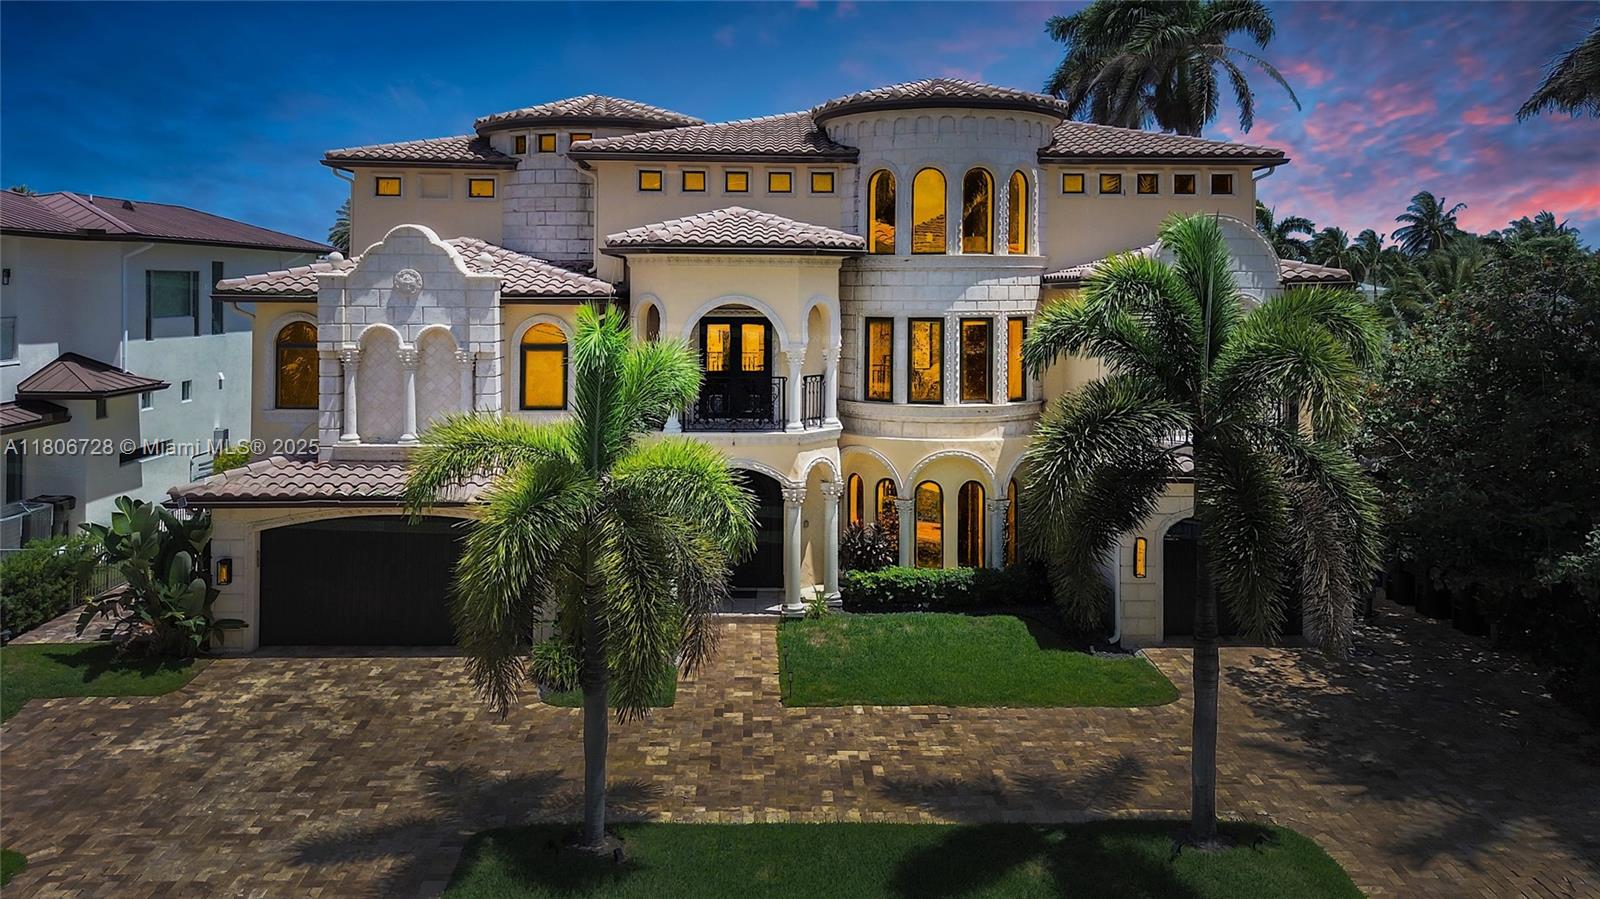
Active
$7,900,000
6
bds
|
9
ba
|
7,286
sqft
|
built
2007
1011 Rhodes Villa Ave, Delray Beach, FL 33483
$-41,406
Cash flow
-27.3%
Cash-on-Cash Return
-0.1%
Cap rate
0.1%
Rent to Value Ratio
Active
$899,000
3
bds
|
1
ba
|
1,120
sqft
|
built
1951
216 NE 14th St, Delray Beach, FL 33444
$-1,349
Cash flow
-7.8%
Cash-on-Cash Return
4.3%
Cap rate
0.6%
Rent to Value Ratio
Active
$698,000
3
bds
|
2
ba
|
1,864
sqft
|
built
1996
5230 Grande Palm Cir, Delray Beach, FL 33484
$-2,001
Cash flow
-15.0%
Cash-on-Cash Return
2.7%
Cap rate
0.5%
Rent to Value Ratio
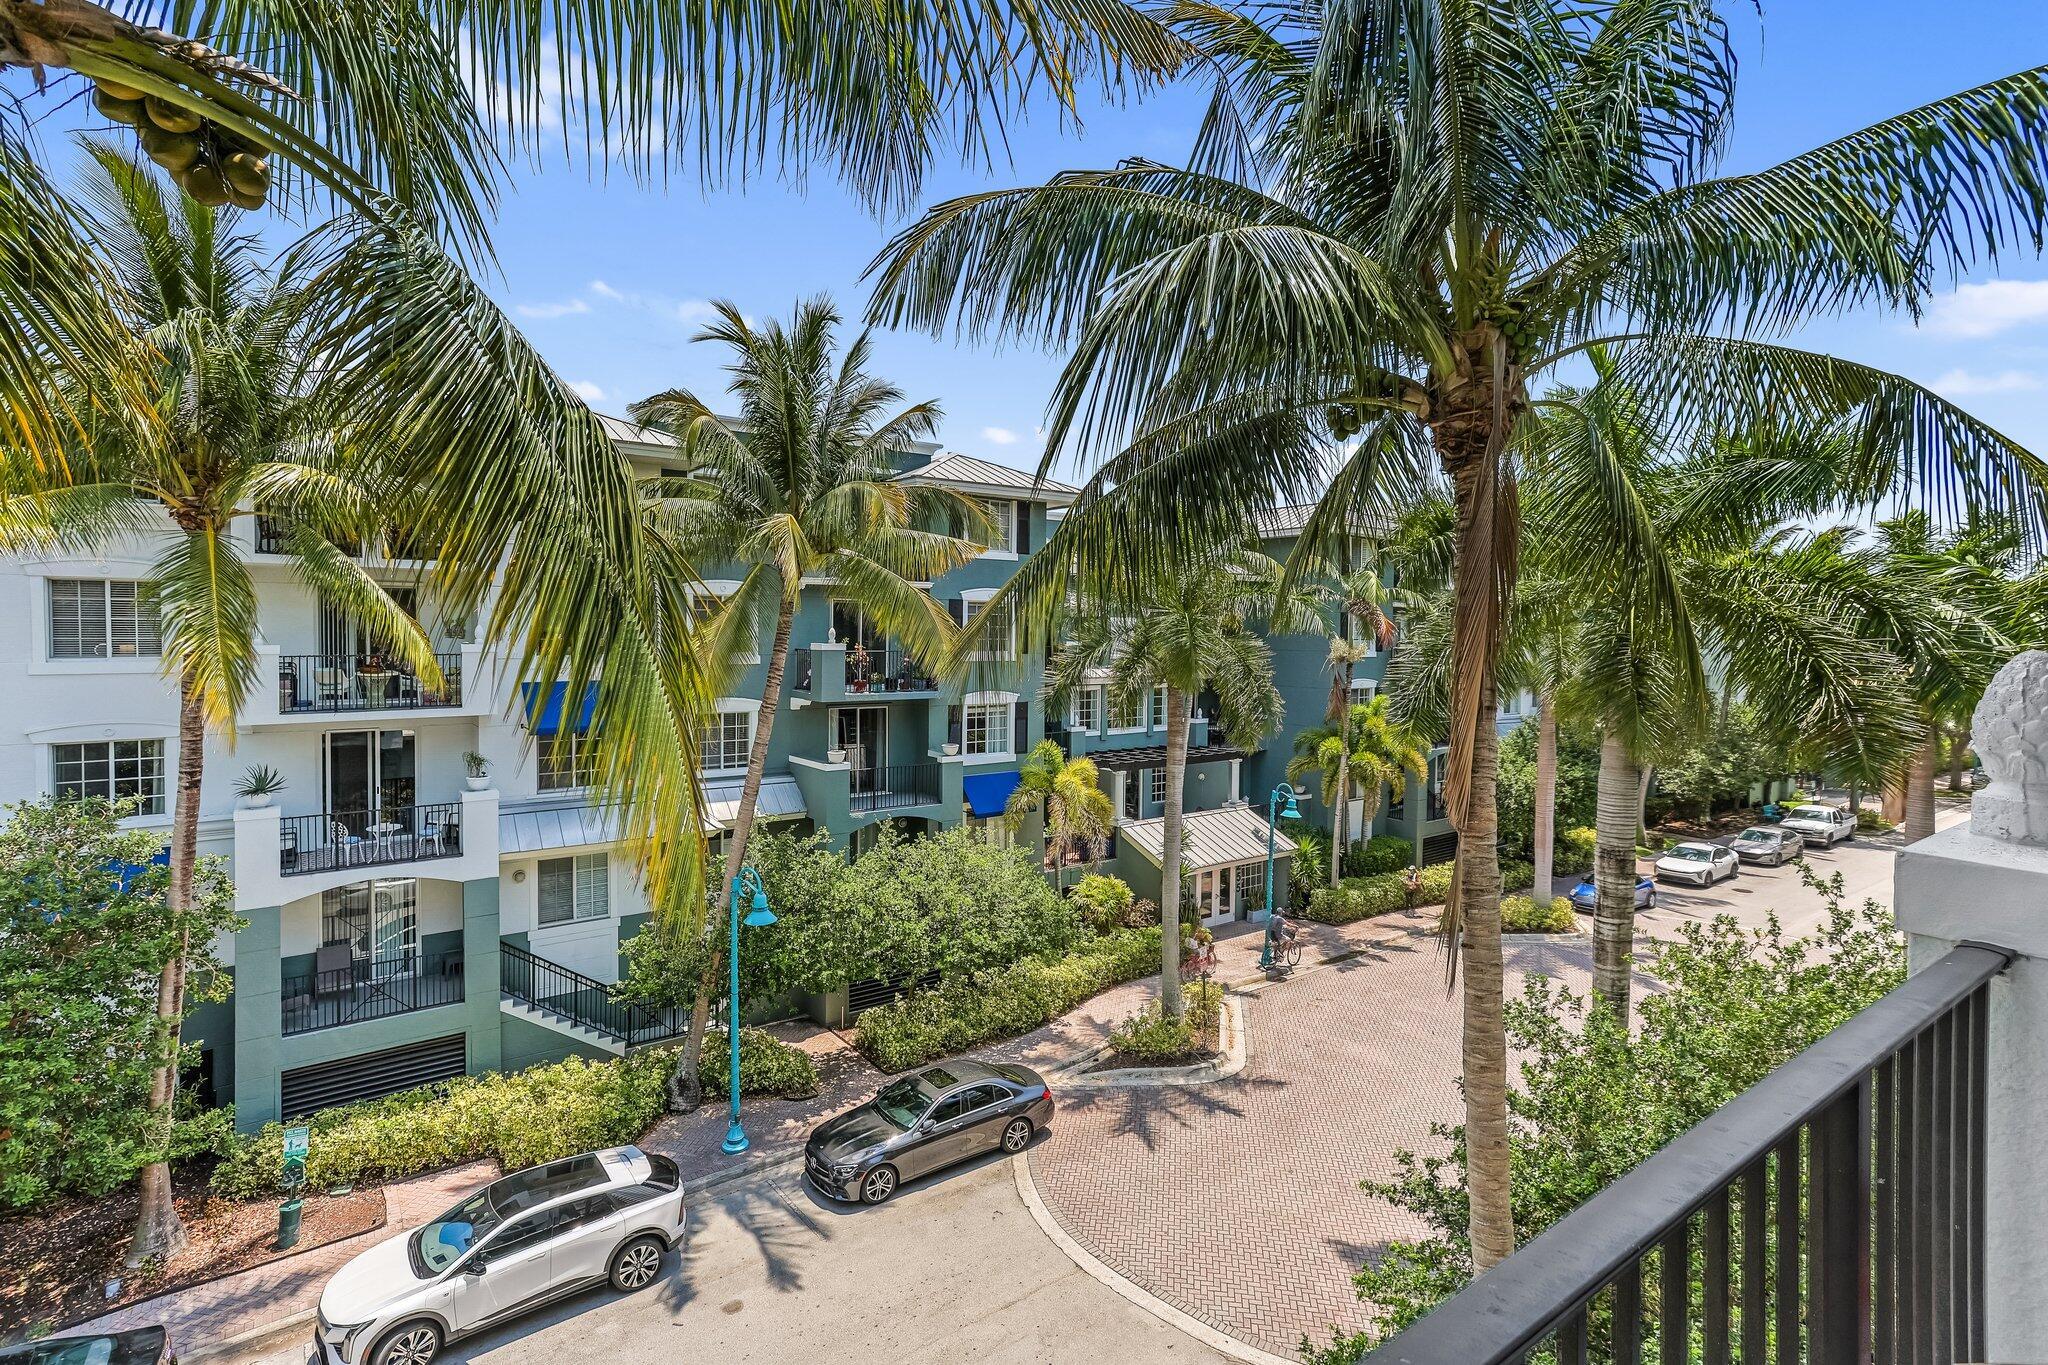
Active
$998,000
2
bds
|
2
ba
|
1,243
sqft
|
built
2004
250 NE 3rd Ave, Delray Beach, FL 33444
$-3,885
Cash flow
-20.3%
Cash-on-Cash Return
1.5%
Cap rate
0.4%
Rent to Value Ratio
Active under contract
$699,000
4
bds
|
3
ba
|
2,032
sqft
|
built
1983
5183 Beechwood Rd, Delray Beach, FL 33484
$-910
Cash flow
-6.8%
Cash-on-Cash Return
4.6%
Cap rate
0.6%
Rent to Value Ratio
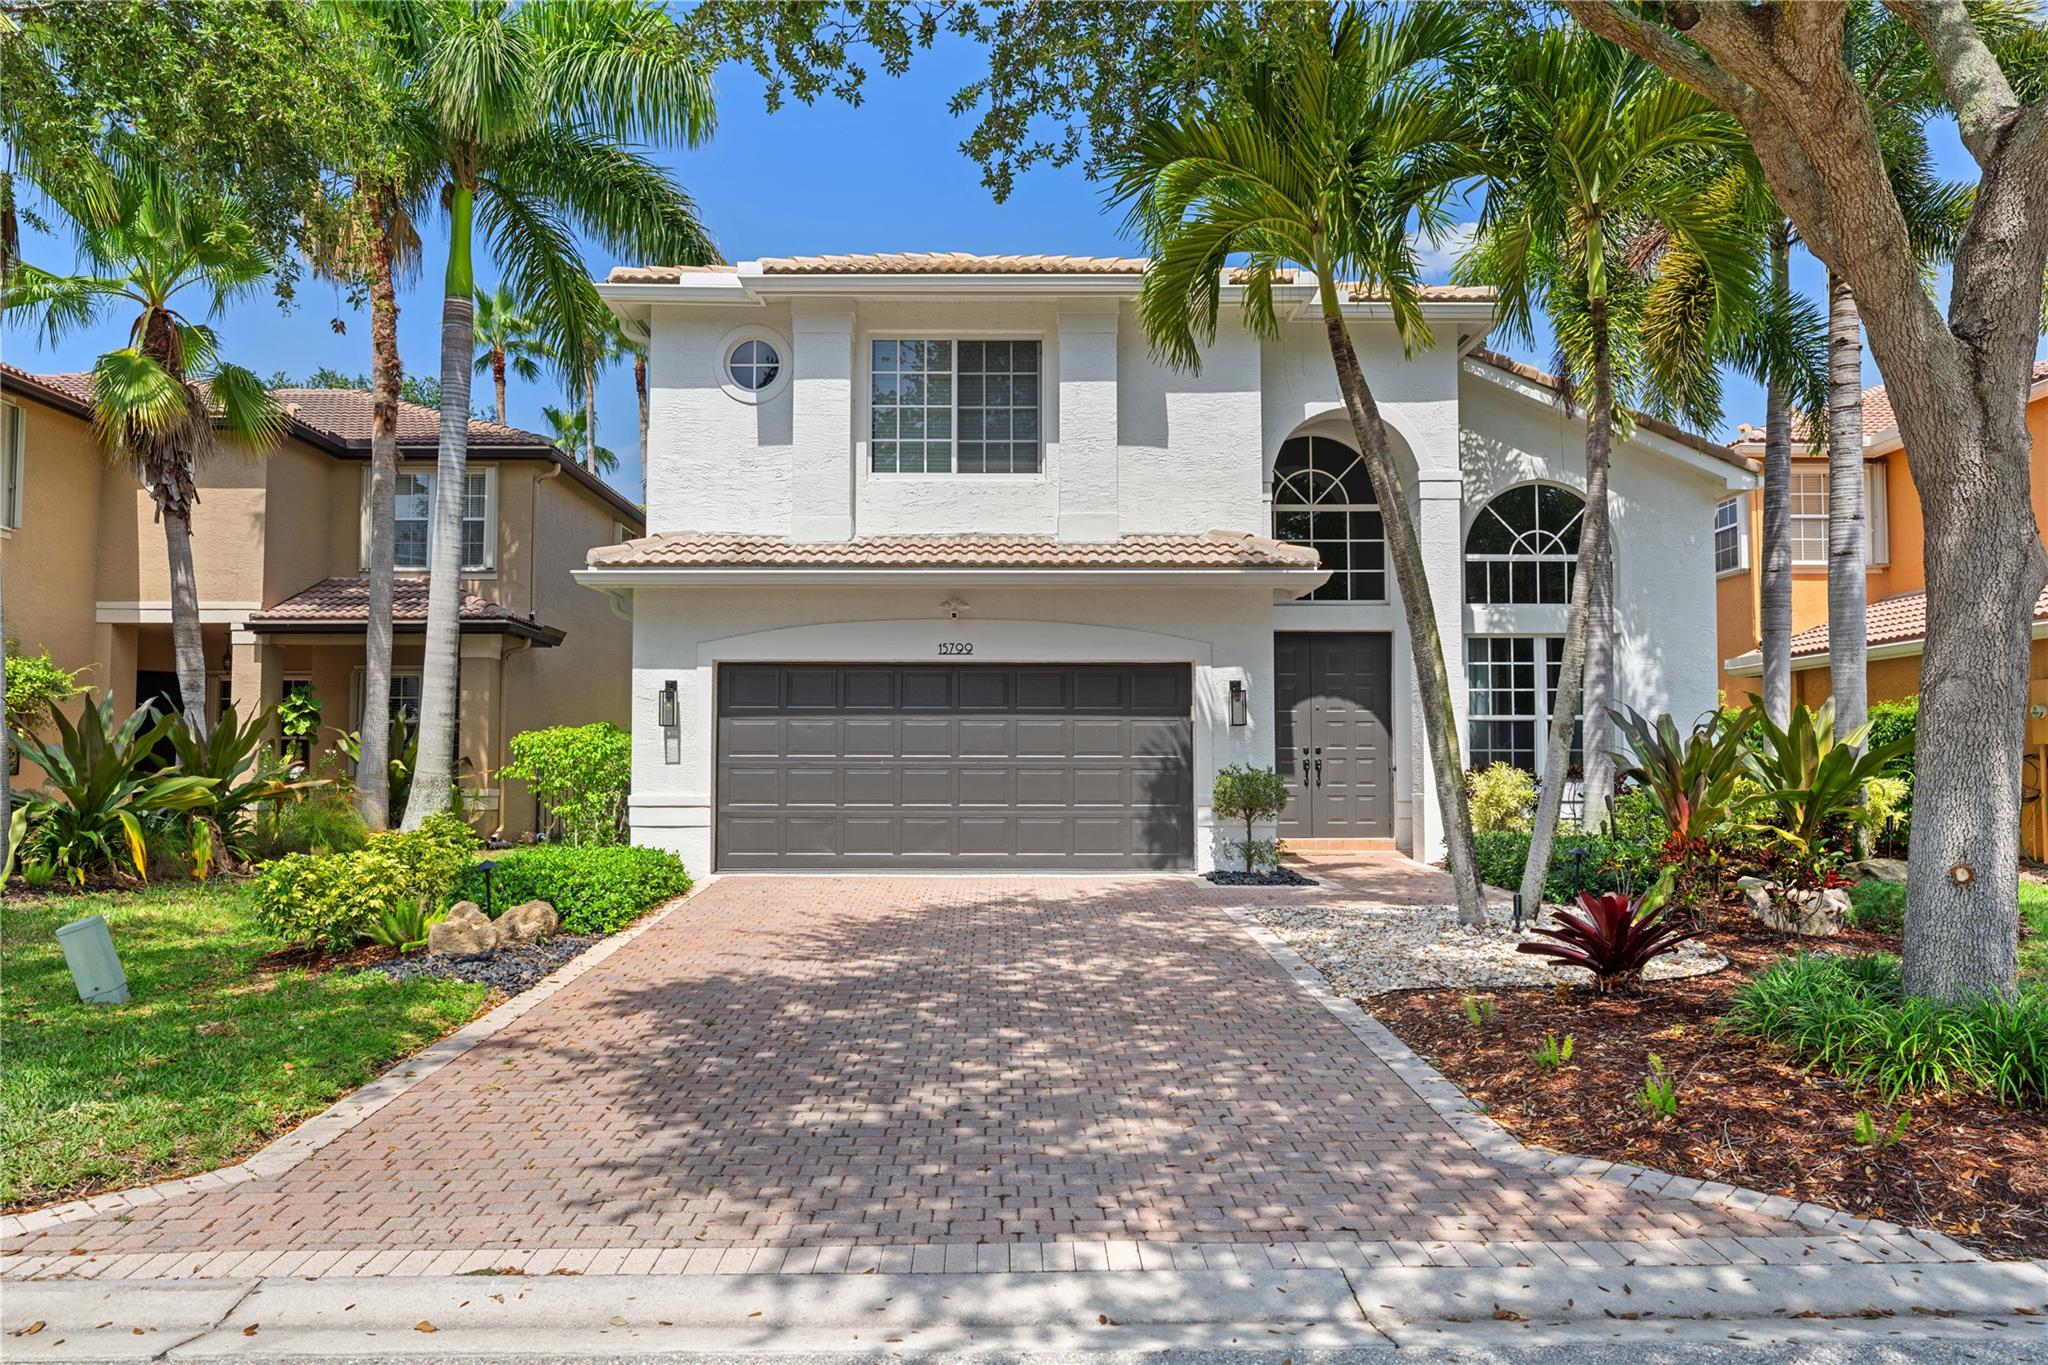
Active
$1,149,000
4
bds
|
4
ba
|
2,839
sqft
|
built
2002
15799 Menton Bay Ct, Delray Beach, FL 33446
$-1,989
Cash flow
-9.0%
Cash-on-Cash Return
4.1%
Cap rate
0.6%
Rent to Value Ratio
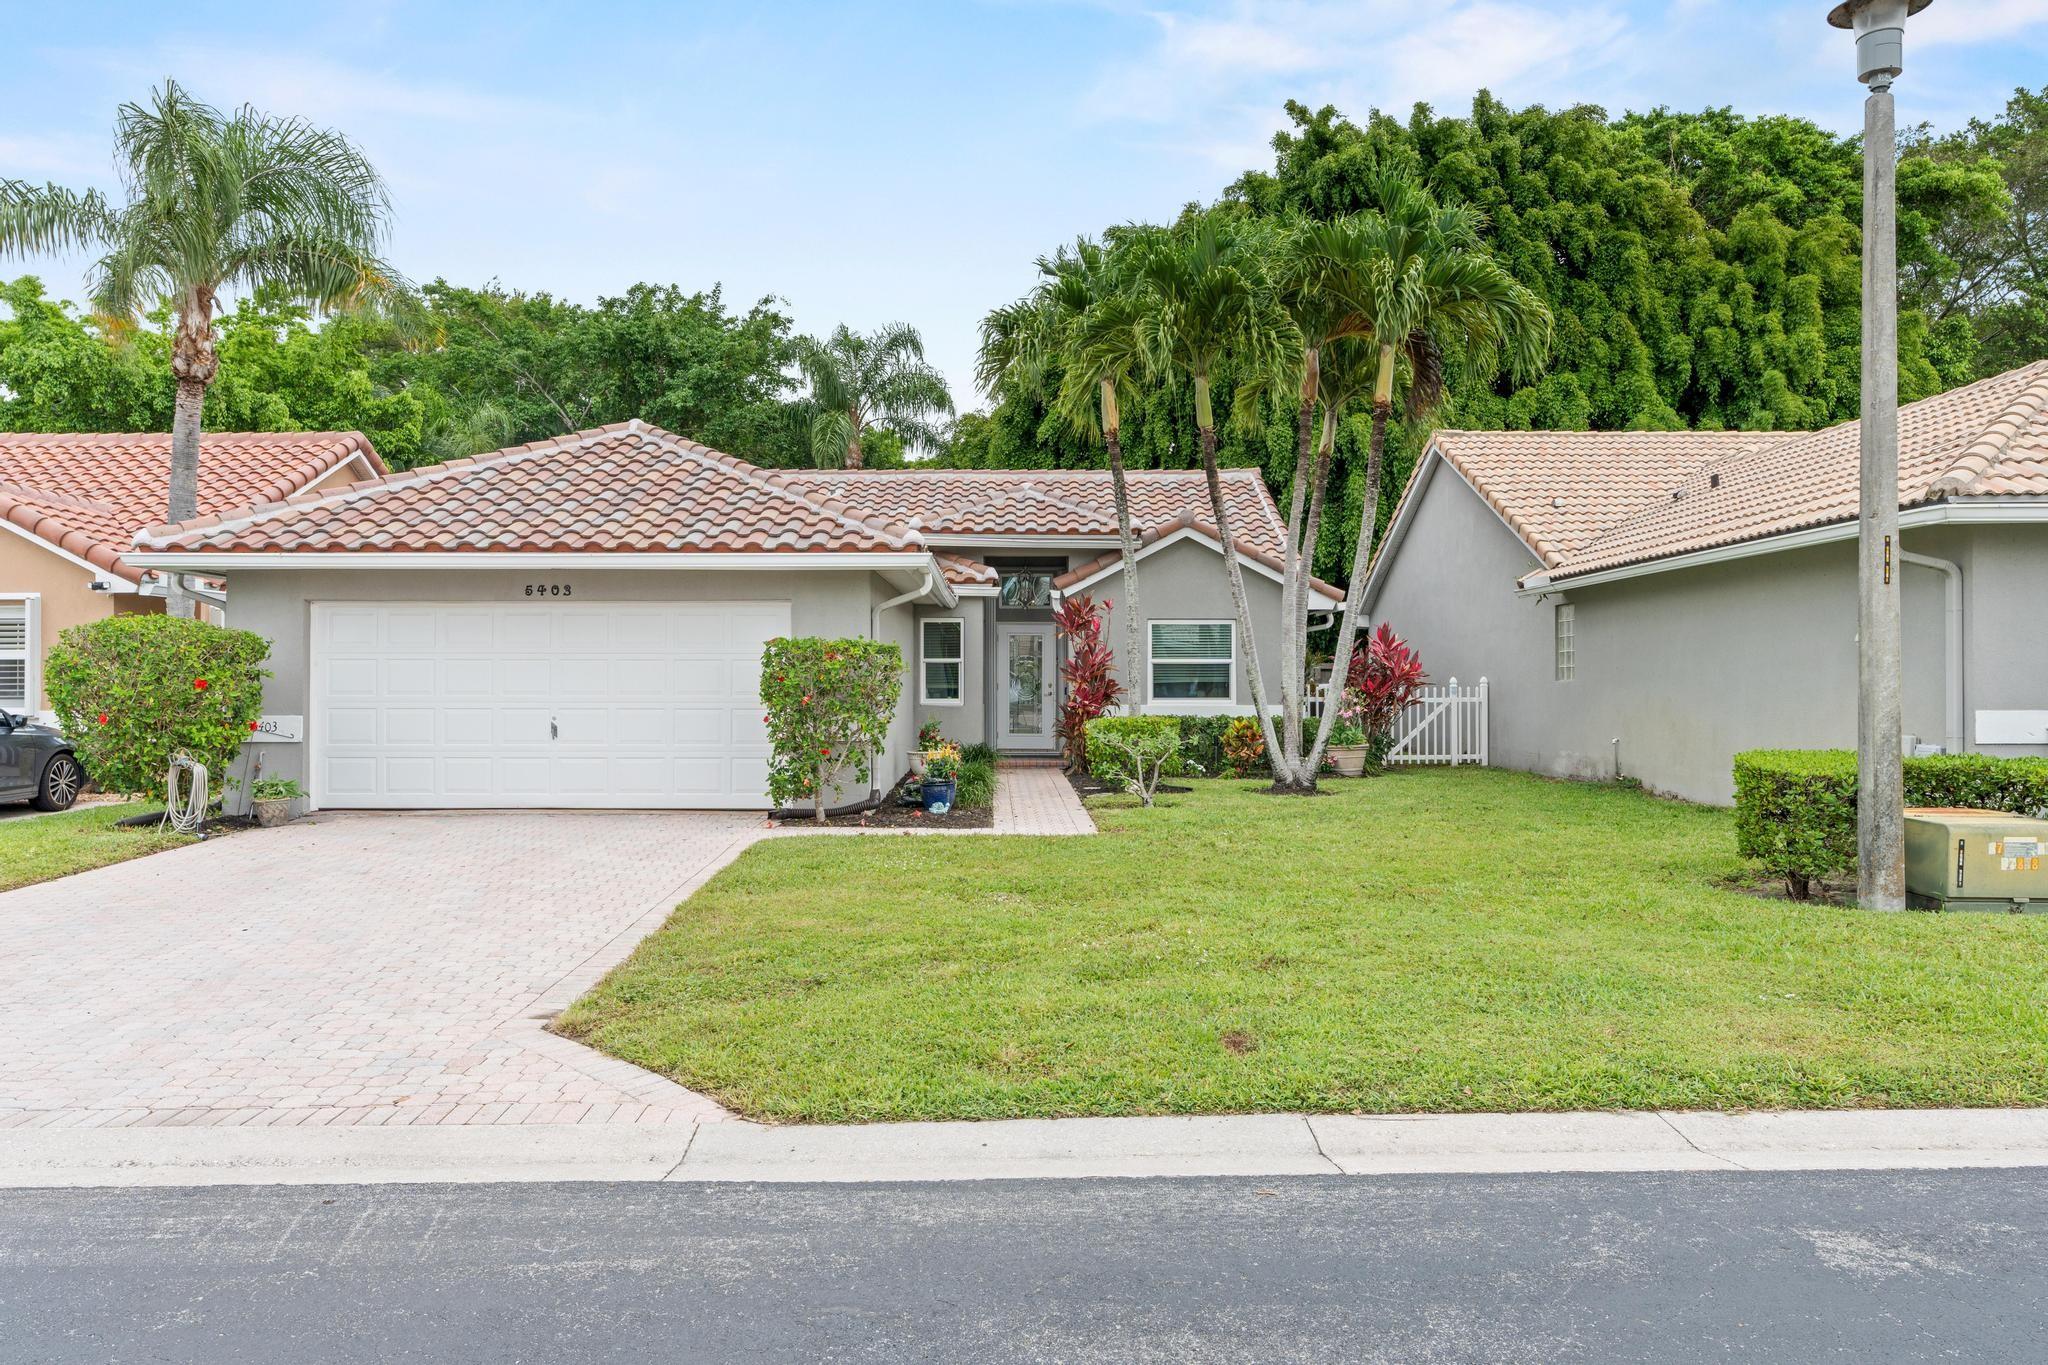
Active
$510,000
3
bds
|
2
ba
|
1,384
sqft
|
built
1996
5403 Grande Palm Cir, Delray Beach, FL 33484
$-1,011
Cash flow
-10.3%
Cash-on-Cash Return
3.8%
Cap rate
0.6%
Rent to Value Ratio
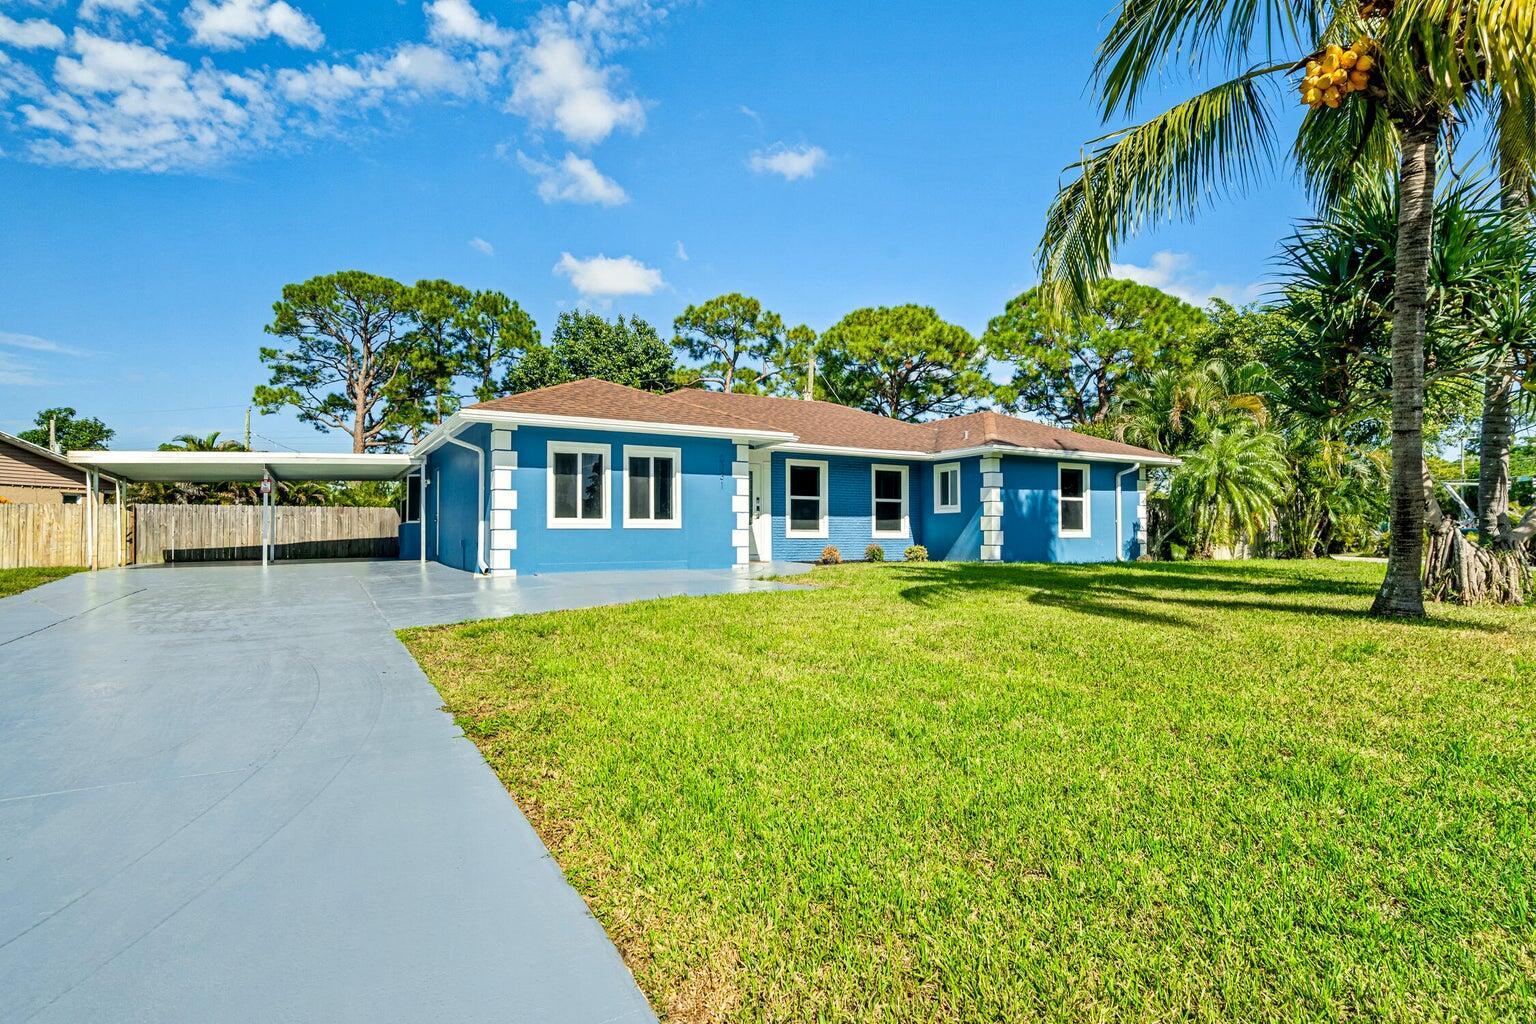
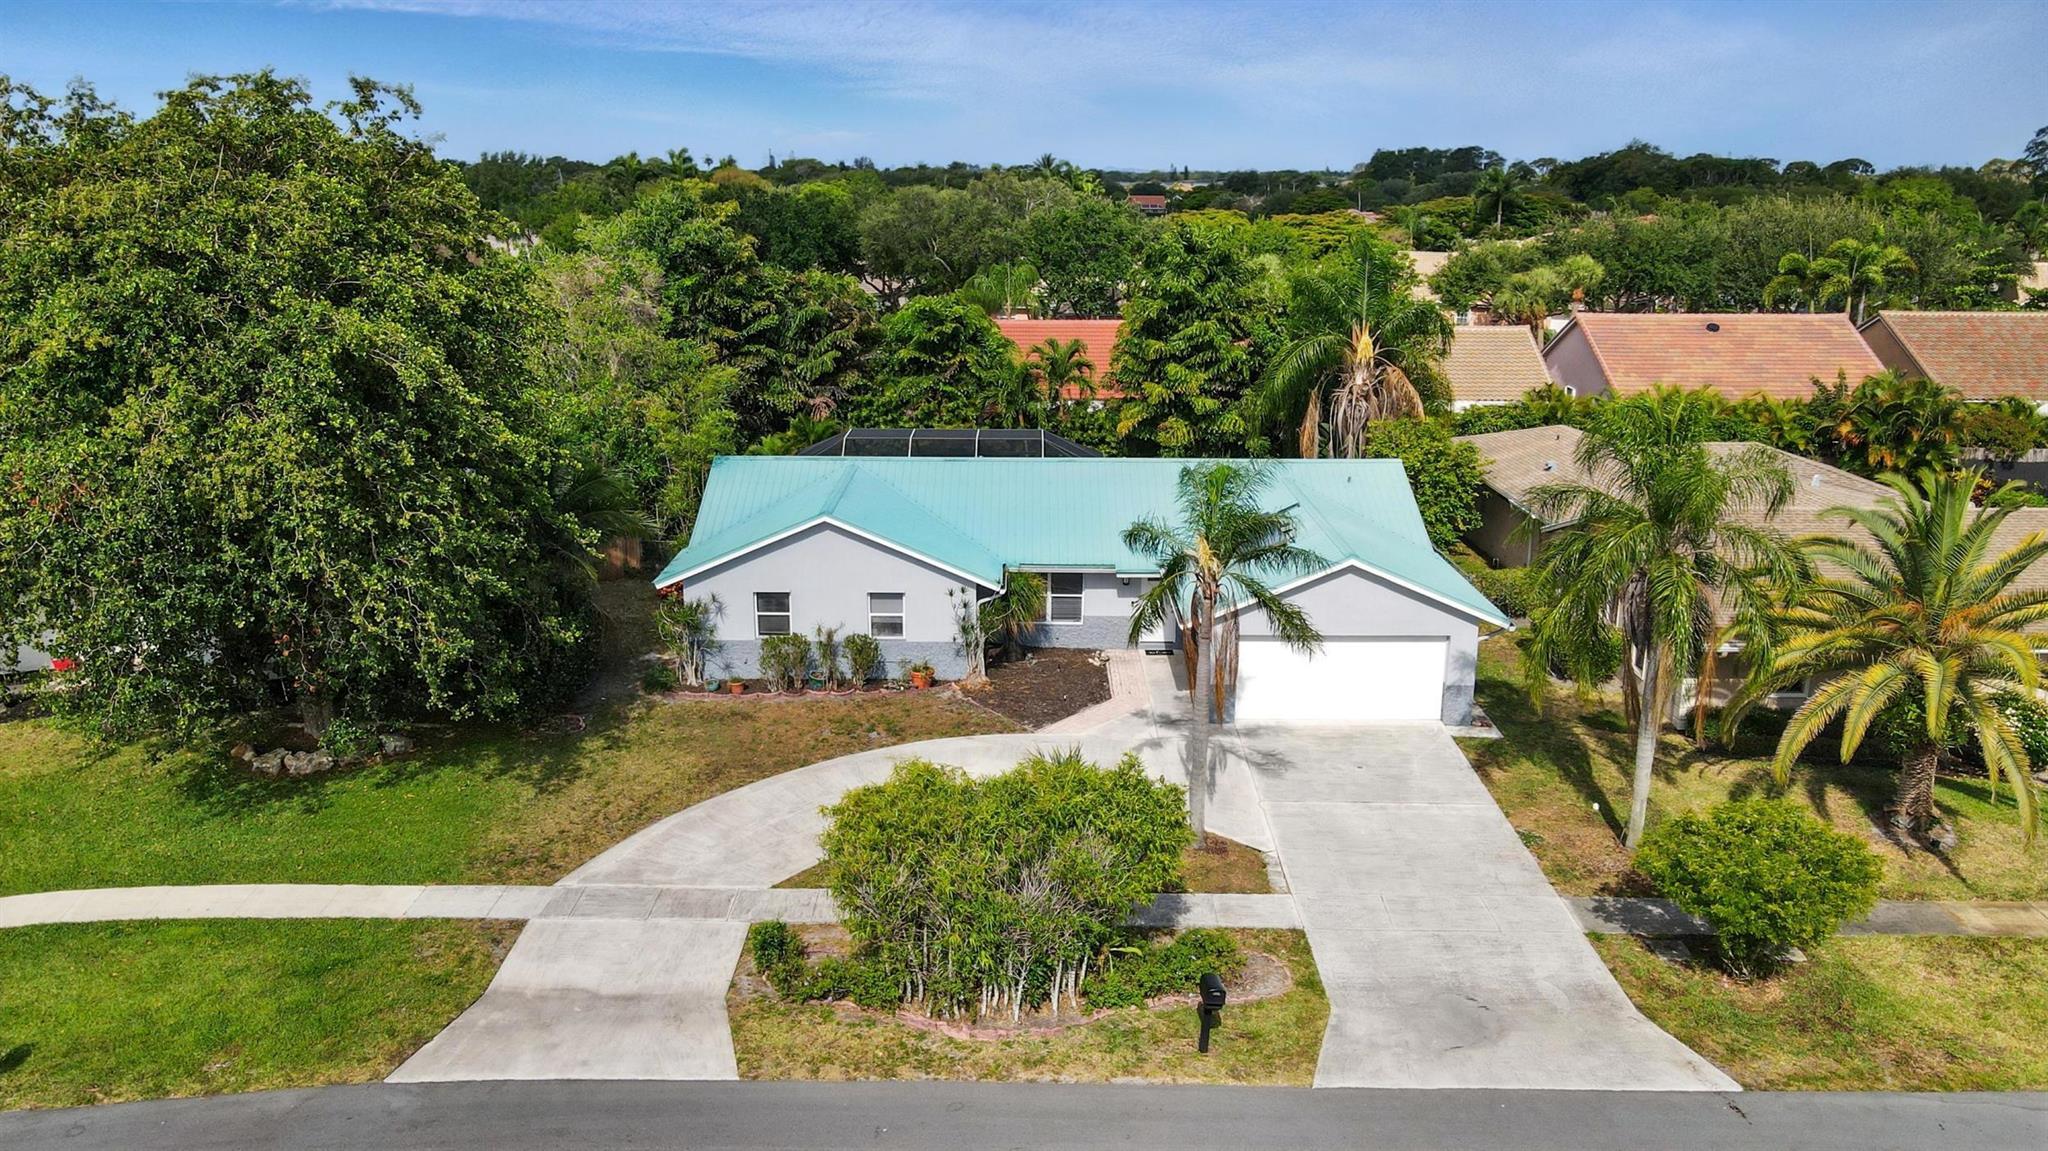
Active
$663,500
3
bds
|
2
ba
|
1,845
sqft
|
built
1968
5031 Van Buren Rd, Delray Beach, FL 33484
$-1,028
Cash flow
-8.1%
Cash-on-Cash Return
4.3%
Cap rate
0.7%
Rent to Value Ratio
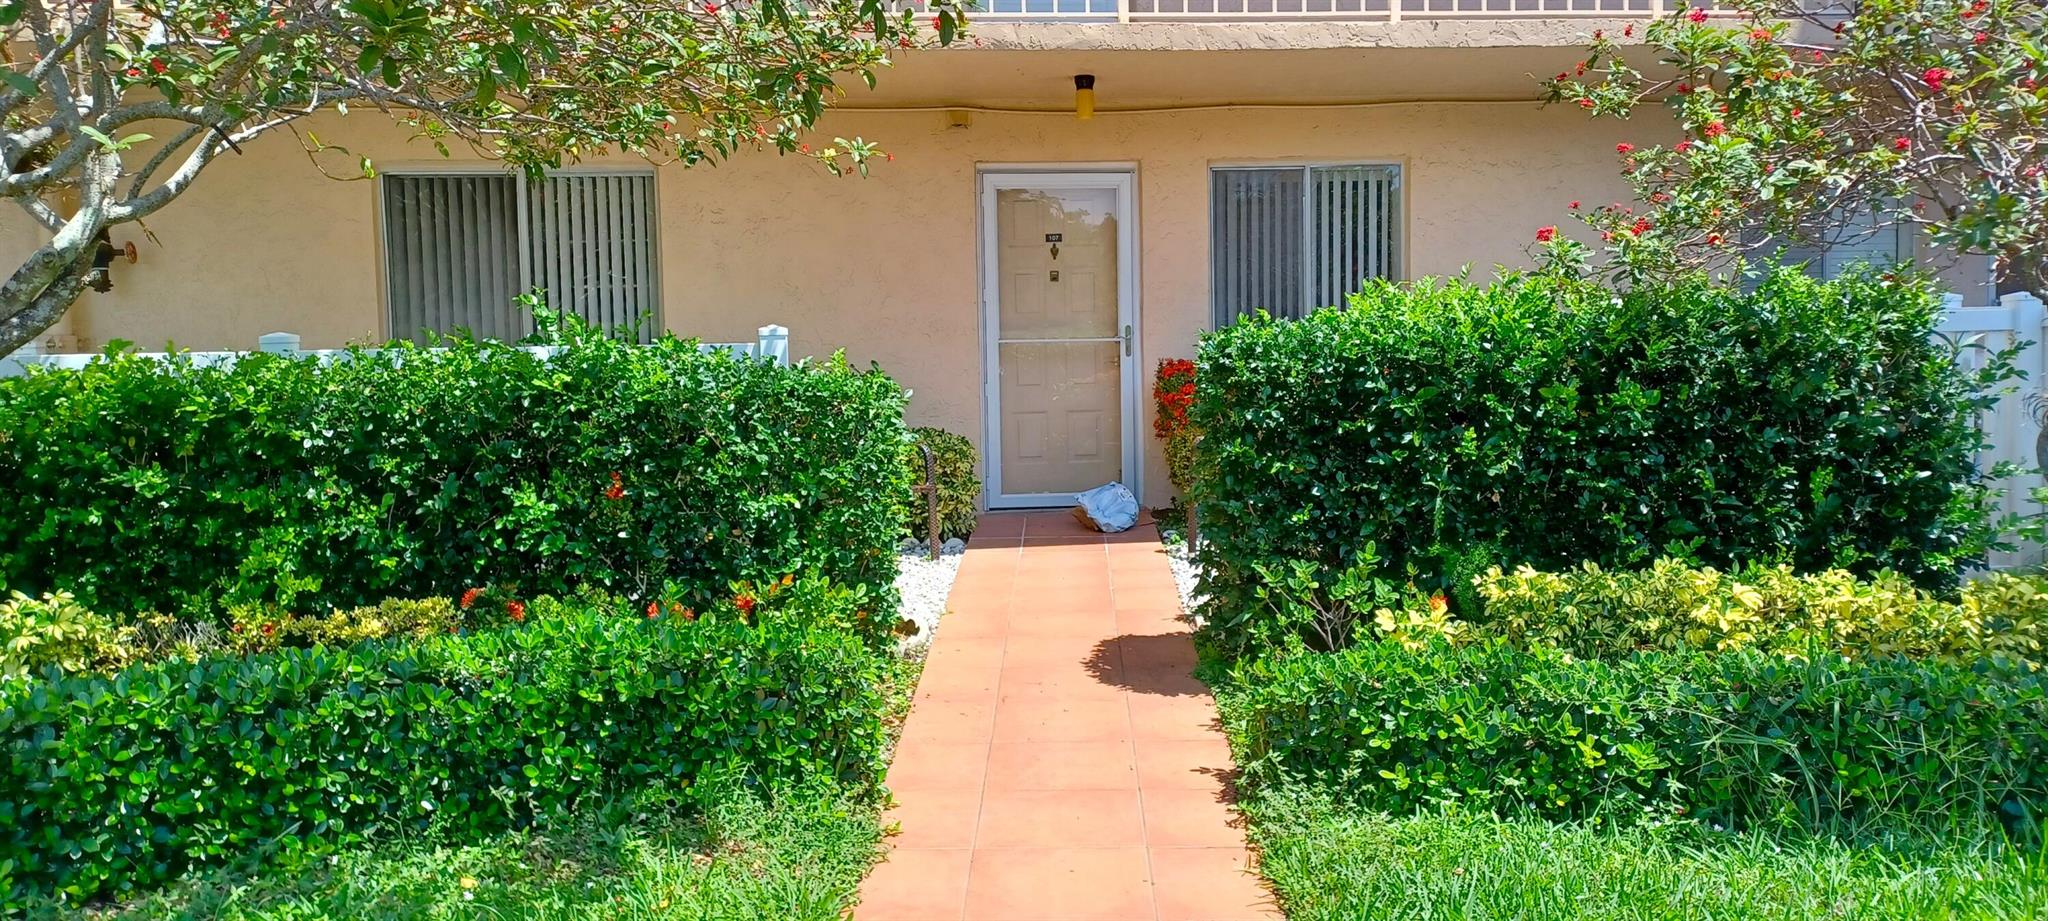
Active
$199,900
2
bds
|
2
ba
|
990
sqft
|
built
1985
6865 Huntington Ln, Delray Beach, FL 33446
$-693
Cash flow
-18.1%
Cash-on-Cash Return
2.0%
Cap rate
1.0%
Rent to Value Ratio
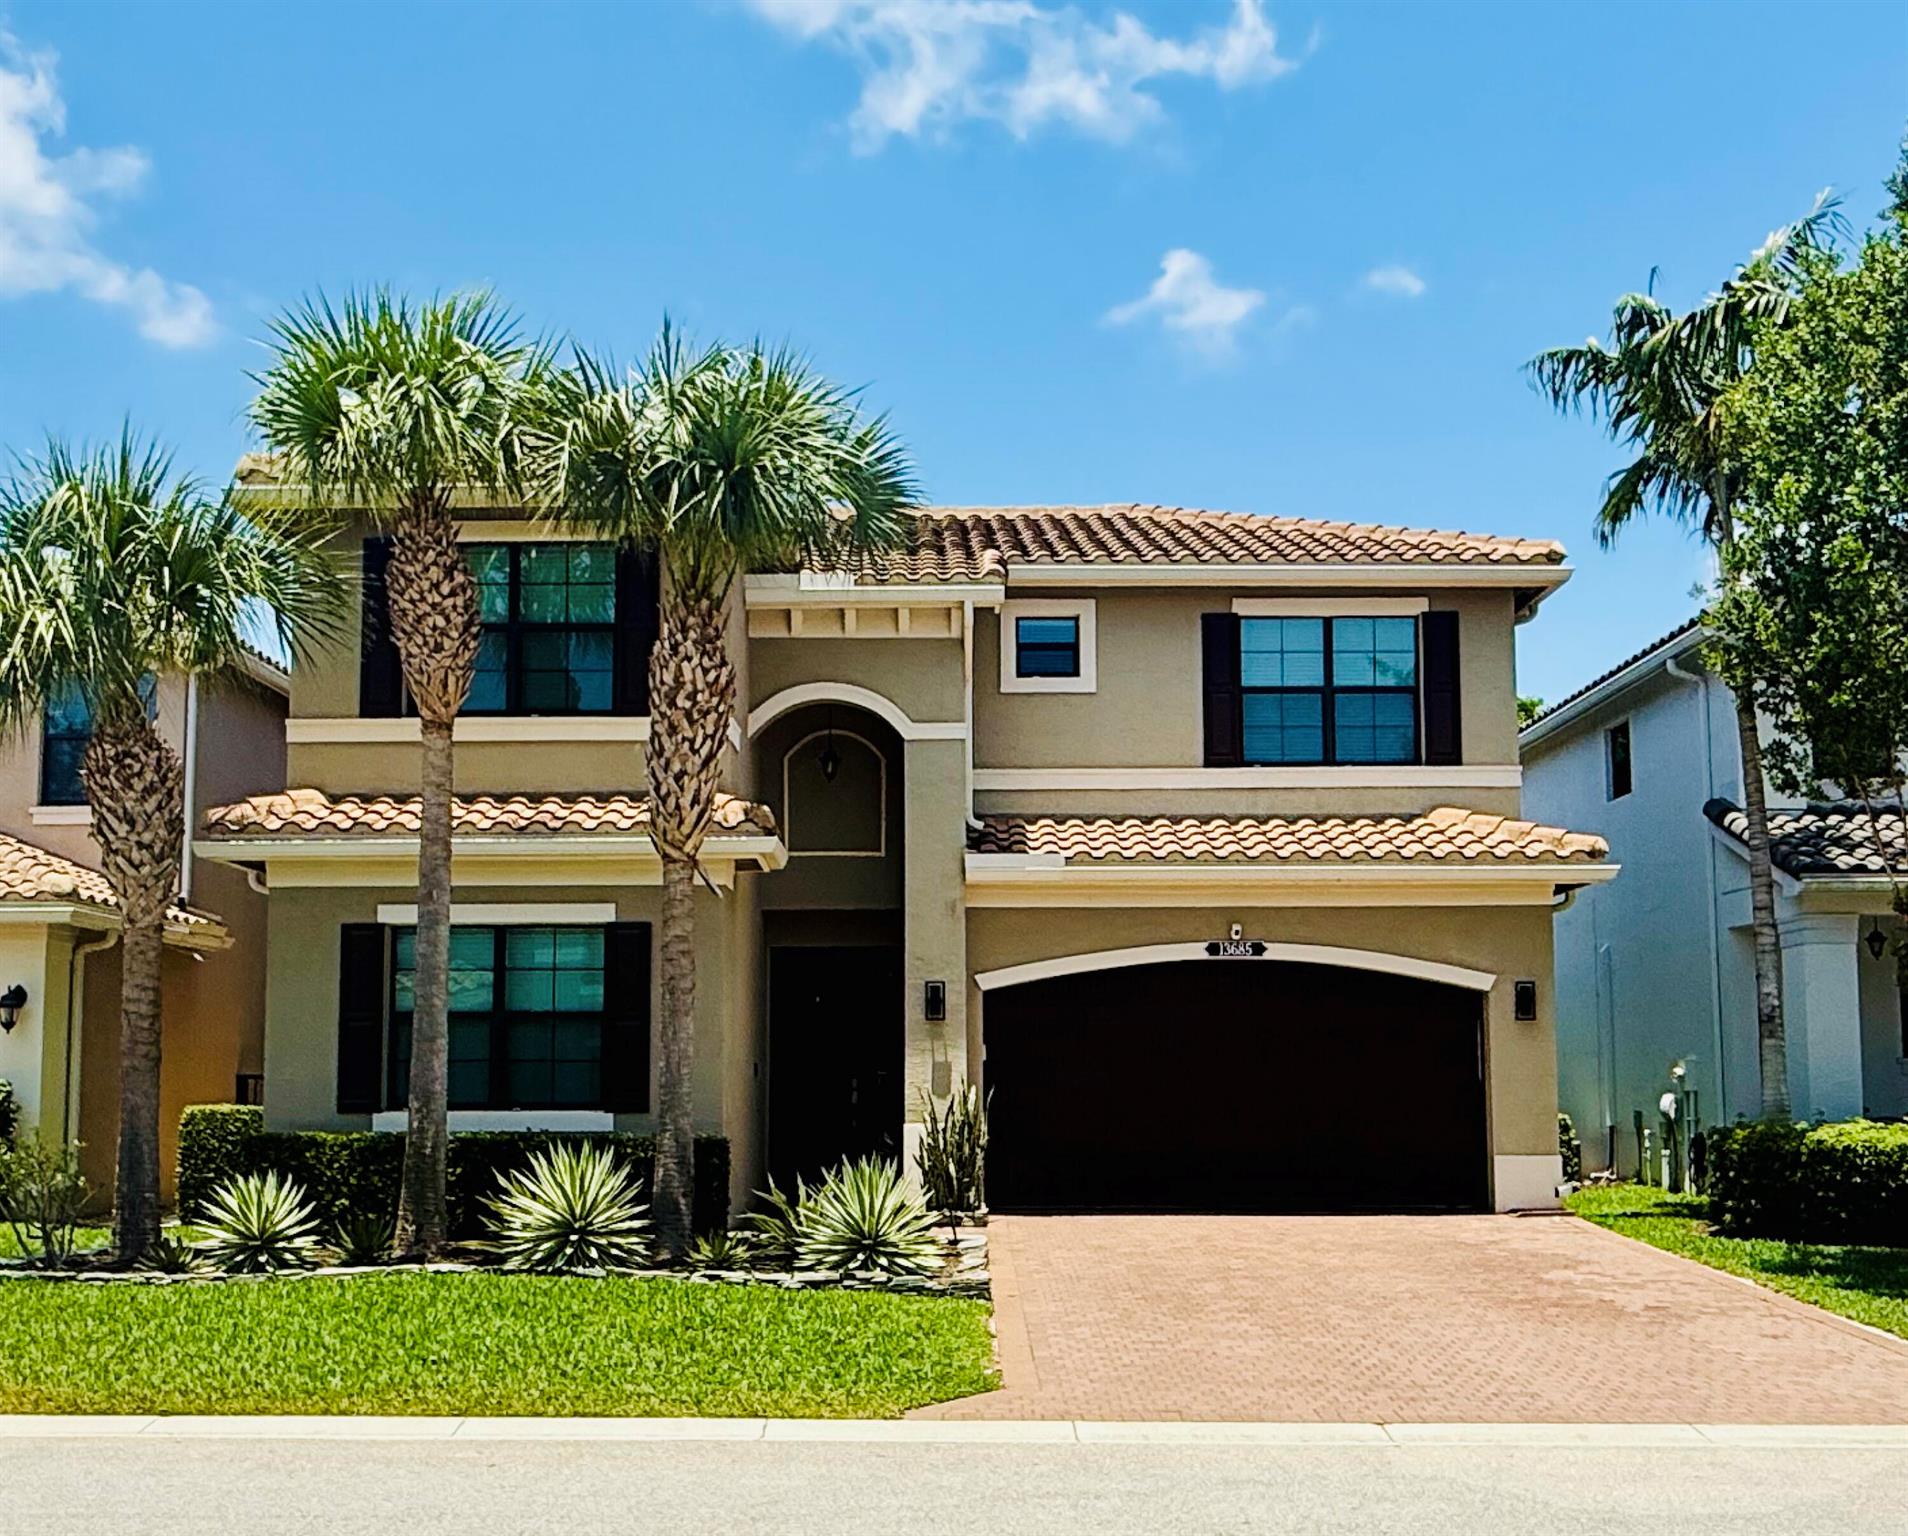
Active
$899,000
4
bds
|
4
ba
|
2,584
sqft
|
built
2016
13685 Moss Agate Ave, Delray Beach, FL 33446
$-2,183
Cash flow
-12.7%
Cash-on-Cash Return
3.2%
Cap rate
0.6%
Rent to Value Ratio
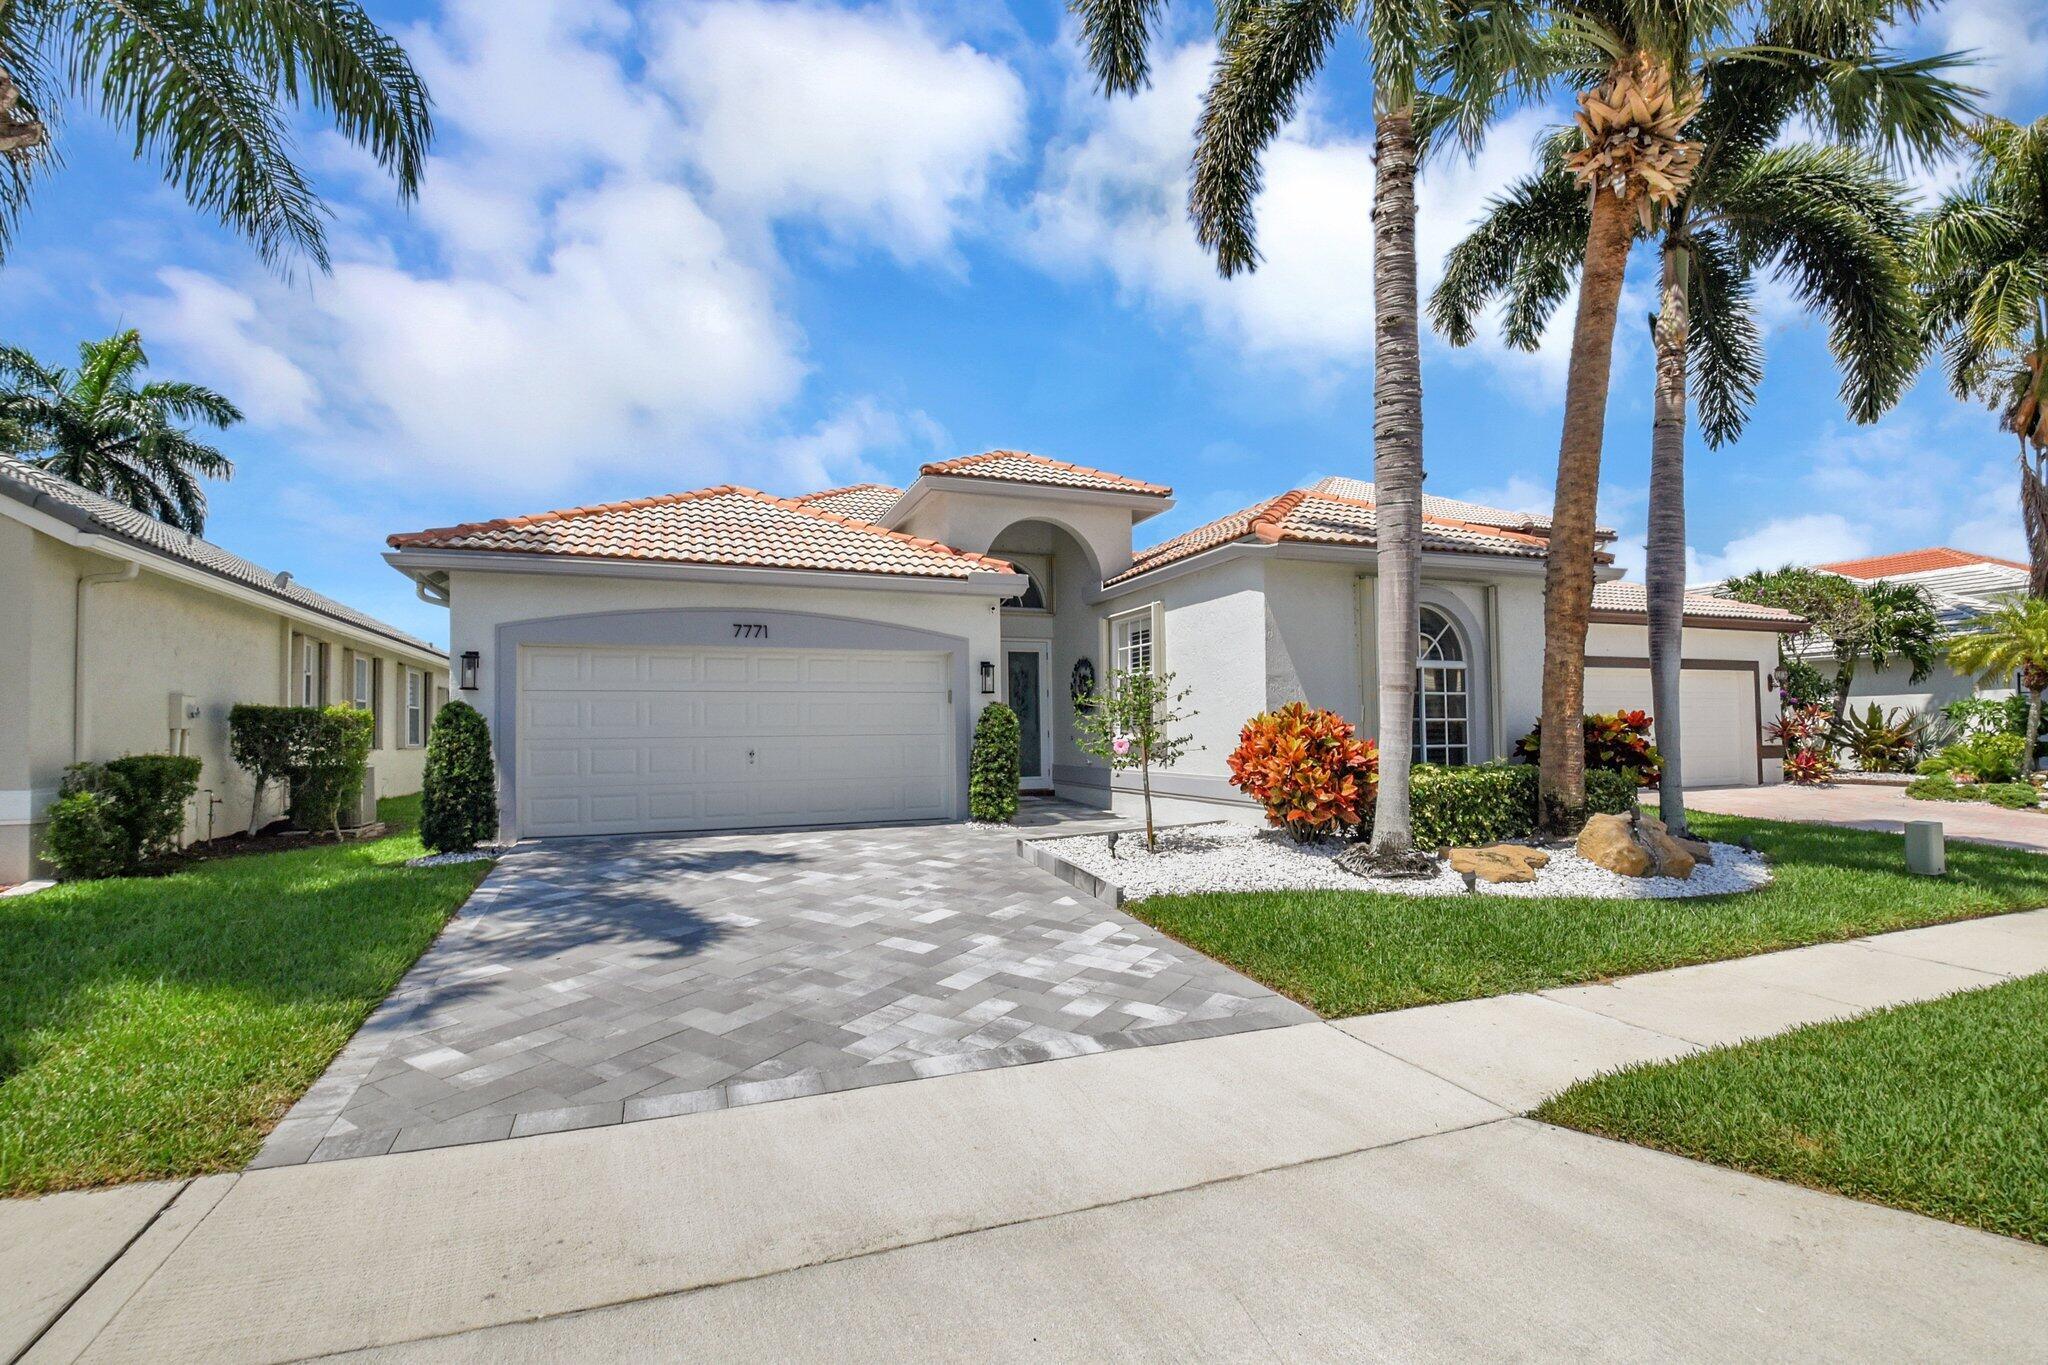
Active under contract
$875,000
3
bds
|
2
ba
|
2,012
sqft
|
built
1999
7771 Monarch Ct, Delray Beach, FL 33446
$-2,498
Cash flow
-14.9%
Cash-on-Cash Return
2.7%
Cap rate
0.6%
Rent to Value Ratio
Active
$1,000,000
2
bds
|
2
ba
|
1,400
sqft
|
built
2008
225 NE 1st St, Delray Beach, FL 33444
$-4,839
Cash flow
-25.2%
Cash-on-Cash Return
0.3%
Cap rate
0.4%
Rent to Value Ratio
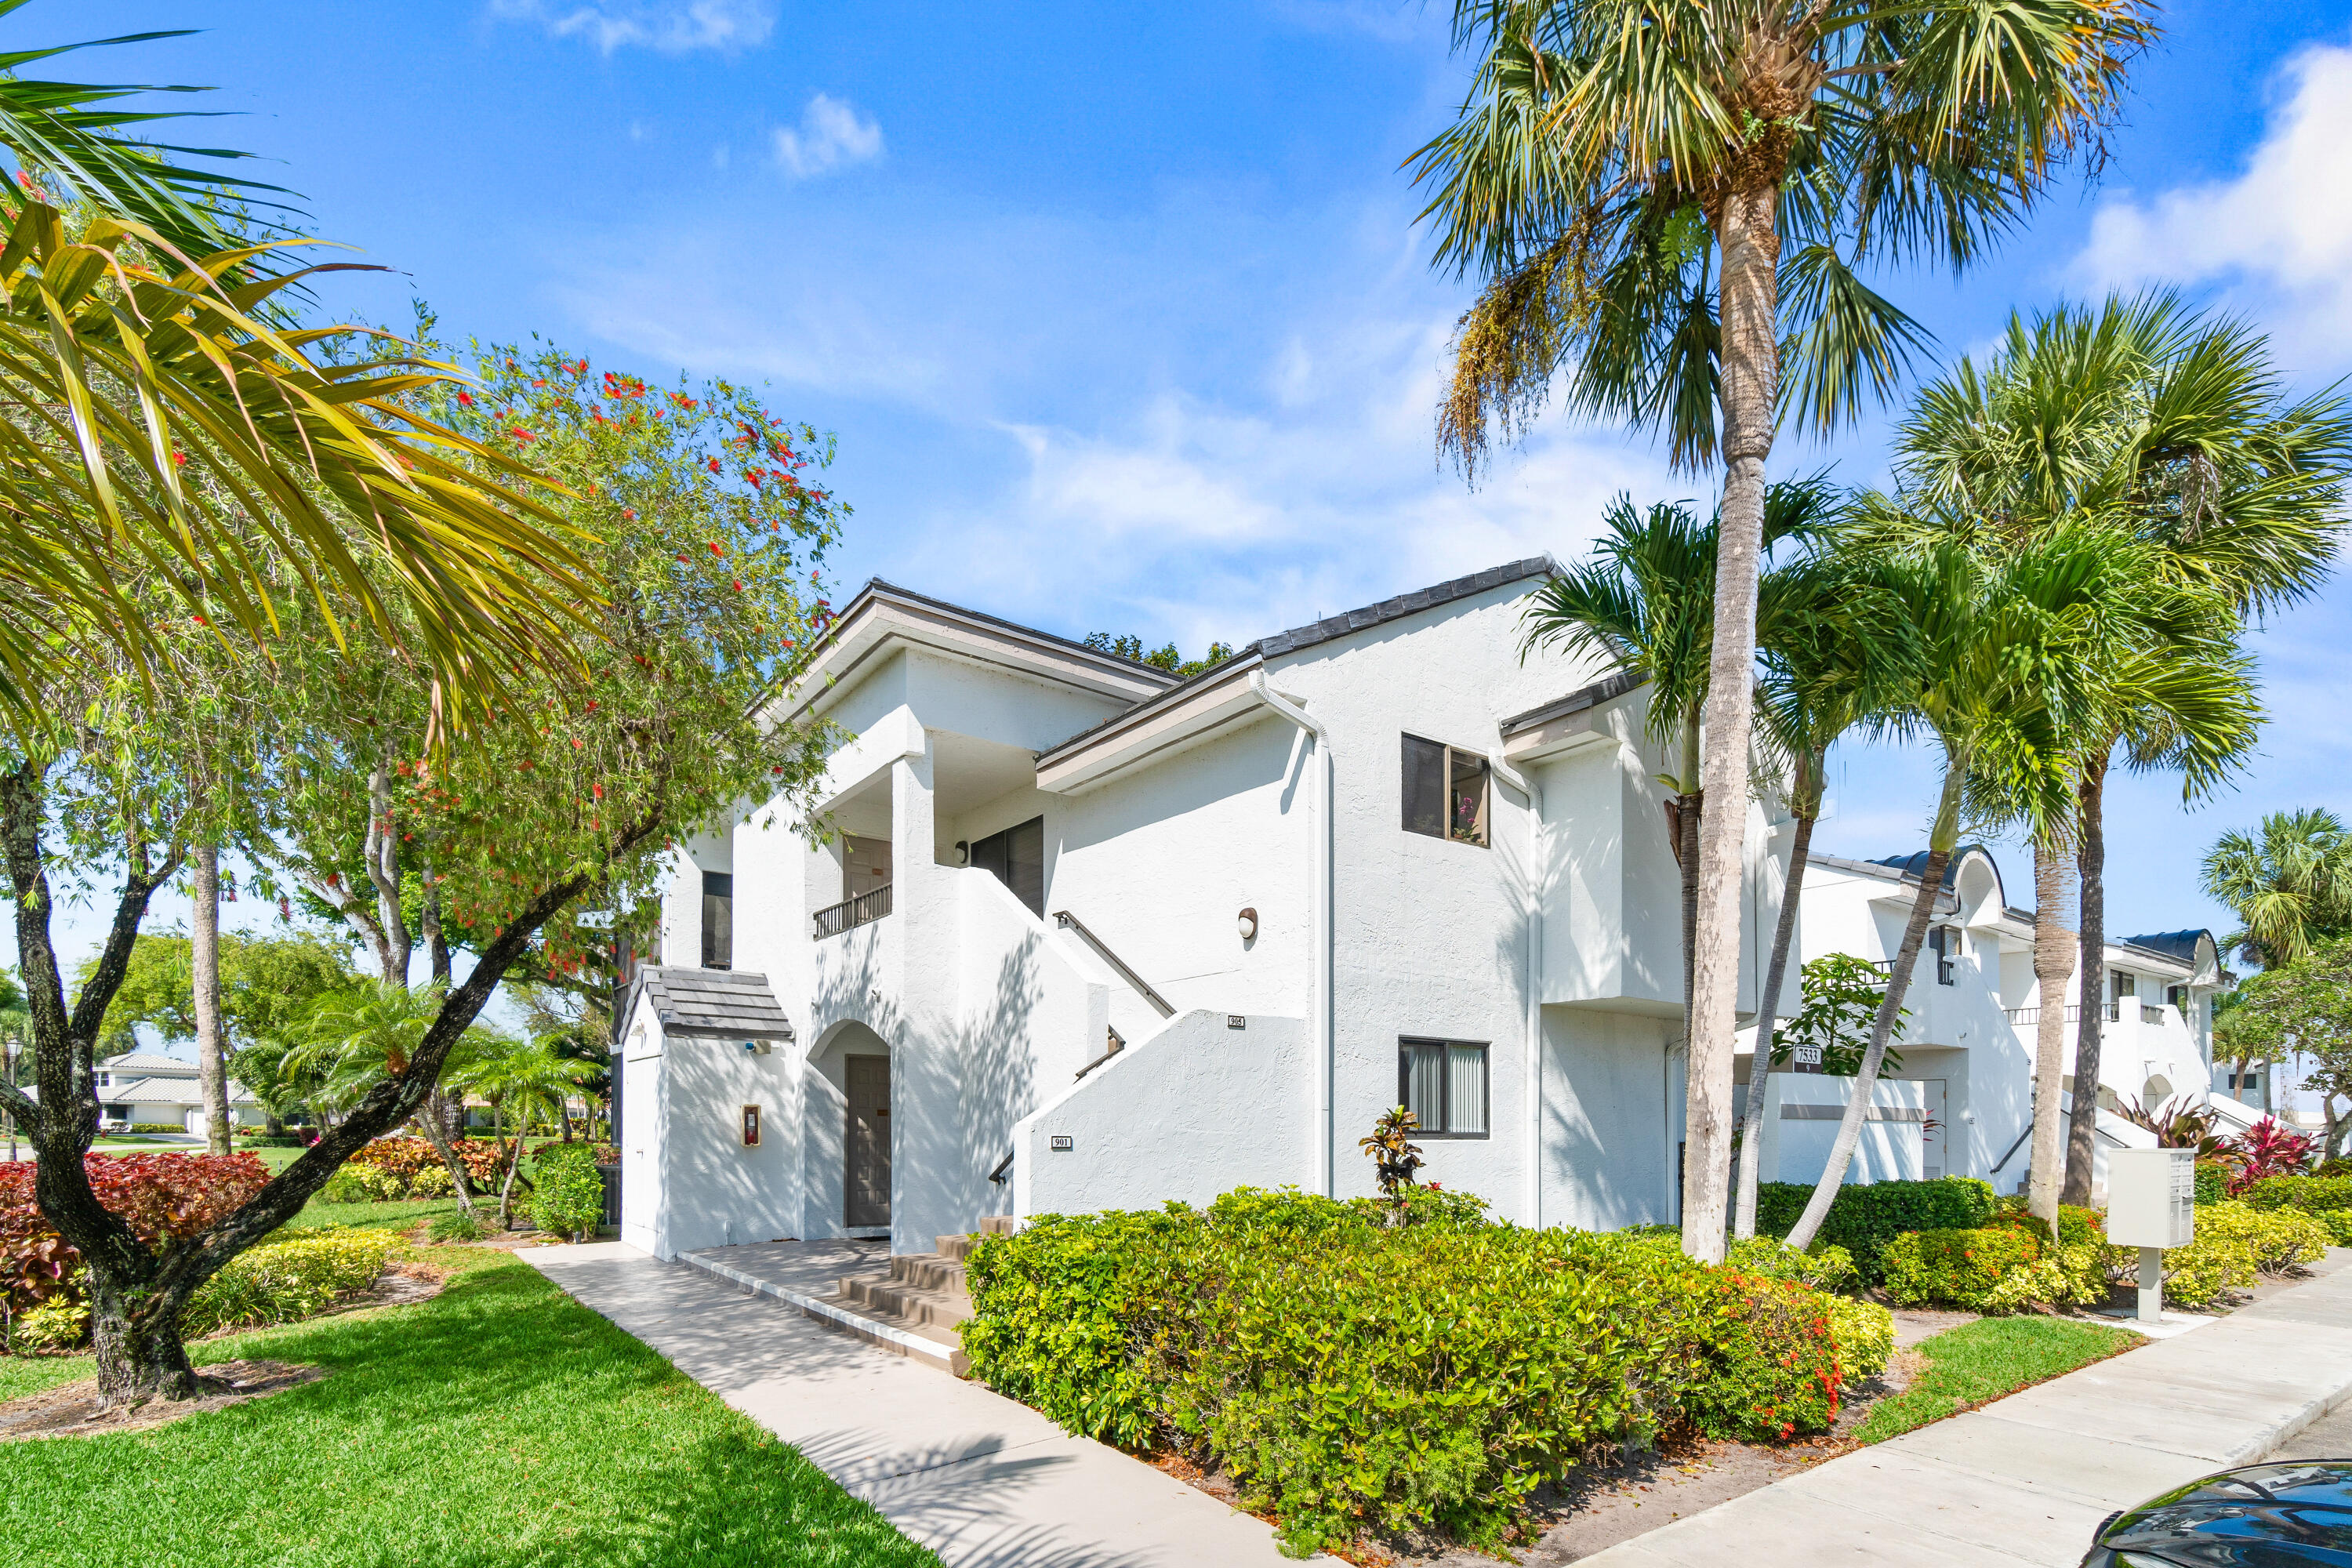
Active
$600,000
2
bds
|
2
ba
|
1,728
sqft
|
built
1985
7533 Glendevon Ln, Delray Beach, FL 33446
$-2,028
Cash flow
-17.6%
Cash-on-Cash Return
2.1%
Cap rate
0.4%
Rent to Value Ratio
Active
$999,000
3
bds
|
2
ba
|
1,508
sqft
|
built
1989
3525 Bosun Cir, Delray Beach, FL 33483
$-2,083
Cash flow
-10.9%
Cash-on-Cash Return
3.6%
Cap rate
0.6%
Rent to Value Ratio
Active
$239,000
2
bds
|
2
ba
|
1,070
sqft
|
built
1981
14360 Strathmore Ln, Delray Beach, FL 33446
$-358
Cash flow
-7.8%
Cash-on-Cash Return
4.3%
Cap rate
1.0%
Rent to Value Ratio
Active
$3,199,000
4
bds
|
3
ba
|
2,398
sqft
|
built
1926
516 N Swinton Ave, Delray Beach, FL 33444
$-12,082
Cash flow
-19.7%
Cash-on-Cash Return
1.6%
Cap rate
0.3%
Rent to Value Ratio
Active
$1,599,000
3
bds
|
4
ba
|
2,401
sqft
|
built
2014
135 N Cannery Row Cir, Delray Beach, FL 33444
$-4,009
Cash flow
-13.1%
Cash-on-Cash Return
3.1%
Cap rate
0.6%
Rent to Value Ratio
Active
$3,249,000
4
bds
|
6
ba
|
3,676
sqft
|
built
1973
960 Cypress Dr, Delray Beach, FL 33483
$-11,498
Cash flow
-18.5%
Cash-on-Cash Return
1.9%
Cap rate
0.3%
Rent to Value Ratio
Active
$1,250,000
3
bds
|
2
ba
|
1,578
sqft
|
built
1973
8 NW 24th St, Delray Beach, FL 33444
$-297
Cash flow
-1.2%
Cash-on-Cash Return
5.9%
Cap rate
0.8%
Rent to Value Ratio
Active
$697,000
2
bds
|
2
ba
|
1,482
sqft
|
built
1970
2200 S Ocean Blvd, Delray Beach, FL 33483
$-2,370
Cash flow
-17.7%
Cash-on-Cash Return
2.1%
Cap rate
0.7%
Rent to Value Ratio
Pending
$995,000
2
bds
|
2
ba
|
1,729
sqft
|
built
1969
400 Seasage Dr, Delray Beach, FL 33483
$-2,648
Cash flow
-13.9%
Cash-on-Cash Return
3.0%
Cap rate
0.6%
Rent to Value Ratio
Active
$9,995,000
5
bds
|
6
ba
|
5,771
sqft
|
built
2001
713 SE 10th St, Delray Beach, FL 33483
$-51,121
Cash flow
-26.7%
Cash-on-Cash Return
0.0%
Cap rate
0.1%
Rent to Value Ratio
Active
$47,500,000
7
bds
|
11
ba
|
17,134
sqft
|
built
2023
16101 Quiet Vista Cir, Delray Beach, FL 33446
$-266,077
Cash flow
-29.2%
Cash-on-Cash Return
-0.6%
Cap rate
0.0%
Rent to Value Ratio
Active
$499,000
3
bds
|
3
ba
|
1,564
sqft
|
built
1981
500 Egret Cir, Delray Beach, FL 33444
$-1,694
Cash flow
-17.7%
Cash-on-Cash Return
2.1%
Cap rate
0.7%
Rent to Value Ratio
Active
$324,900
3
bds
|
2
ba
|
1,393
sqft
|
built
1987
5404 Viburnum Cir, Delray Beach, FL 33484
$-467
Cash flow
-7.5%
Cash-on-Cash Return
4.4%
Cap rate
0.8%
Rent to Value Ratio
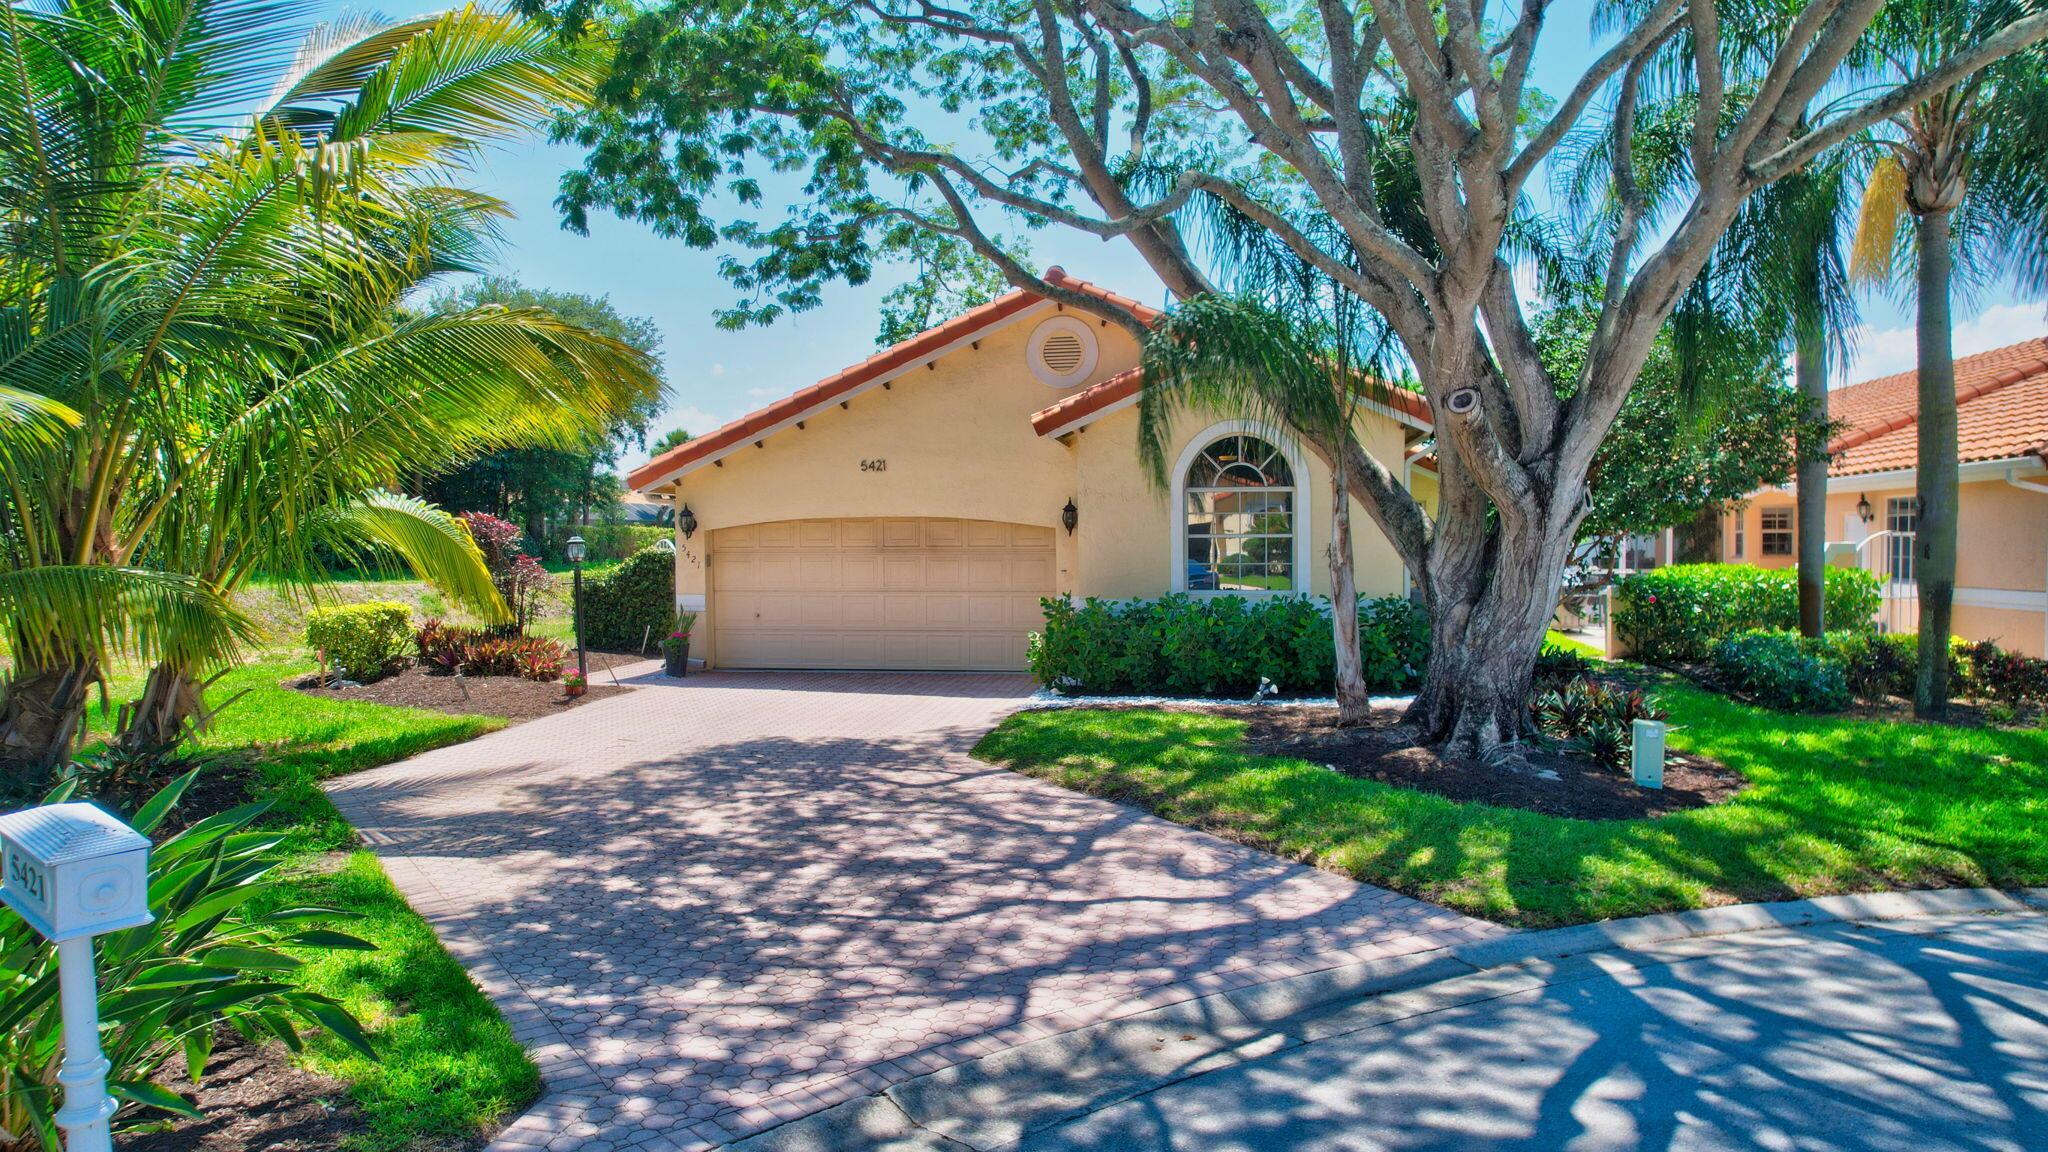
Active
$749,000
3
bds
|
2
ba
|
1,678
sqft
|
built
1992
5421 Casa Real Dr, Delray Beach, FL 33484
$-2,148
Cash flow
-15.0%
Cash-on-Cash Return
2.7%
Cap rate
0.5%
Rent to Value Ratio
Active
$3,400,000
4
bds
|
4
ba
|
4,400
sqft
|
built
2006
702 SE 7th St, Delray Beach, FL 33483
$-12,908
Cash flow
-19.8%
Cash-on-Cash Return
1.6%
Cap rate
0.3%
Rent to Value Ratio
Active
$410,000
2
bds
|
2
ba
|
1,175
sqft
|
built
1980
2255 Lindell Blvd, Delray Beach, FL 33444
$-755
Cash flow
-9.6%
Cash-on-Cash Return
3.9%
Cap rate
0.9%
Rent to Value Ratio
Active
$2,495,000
5
bds
|
6
ba
|
4,687
sqft
|
built
2003
16313 Mira Vista Ln, Delray Beach, FL 33446
$-8,360
Cash flow
-17.5%
Cash-on-Cash Return
2.1%
Cap rate
0.4%
Rent to Value Ratio
Active
$2,300,000
bds
|
0
ba
|
3,202
sqft
|
built
1973
632 Allen Ave, Delray Beach, FL 33483
$-10,149
Cash flow
-23.0%
Cash-on-Cash Return
0.9%
Cap rate
0.2%
Rent to Value Ratio
Active under contract
$529,000
4
bds
|
3
ba
|
1,914
sqft
|
built
1977
5450 Garfield Rd, Delray Beach, FL 33484
$-841
Cash flow
-8.3%
Cash-on-Cash Return
4.2%
Cap rate
0.7%
Rent to Value Ratio