Delray Beach, FL Investment Properties for Sale
Browse homes for sale and investment properties in Delray Beach, FL. Refine your search by price, property type, or more.
Best cash flowing properties in Delray Beach, FL
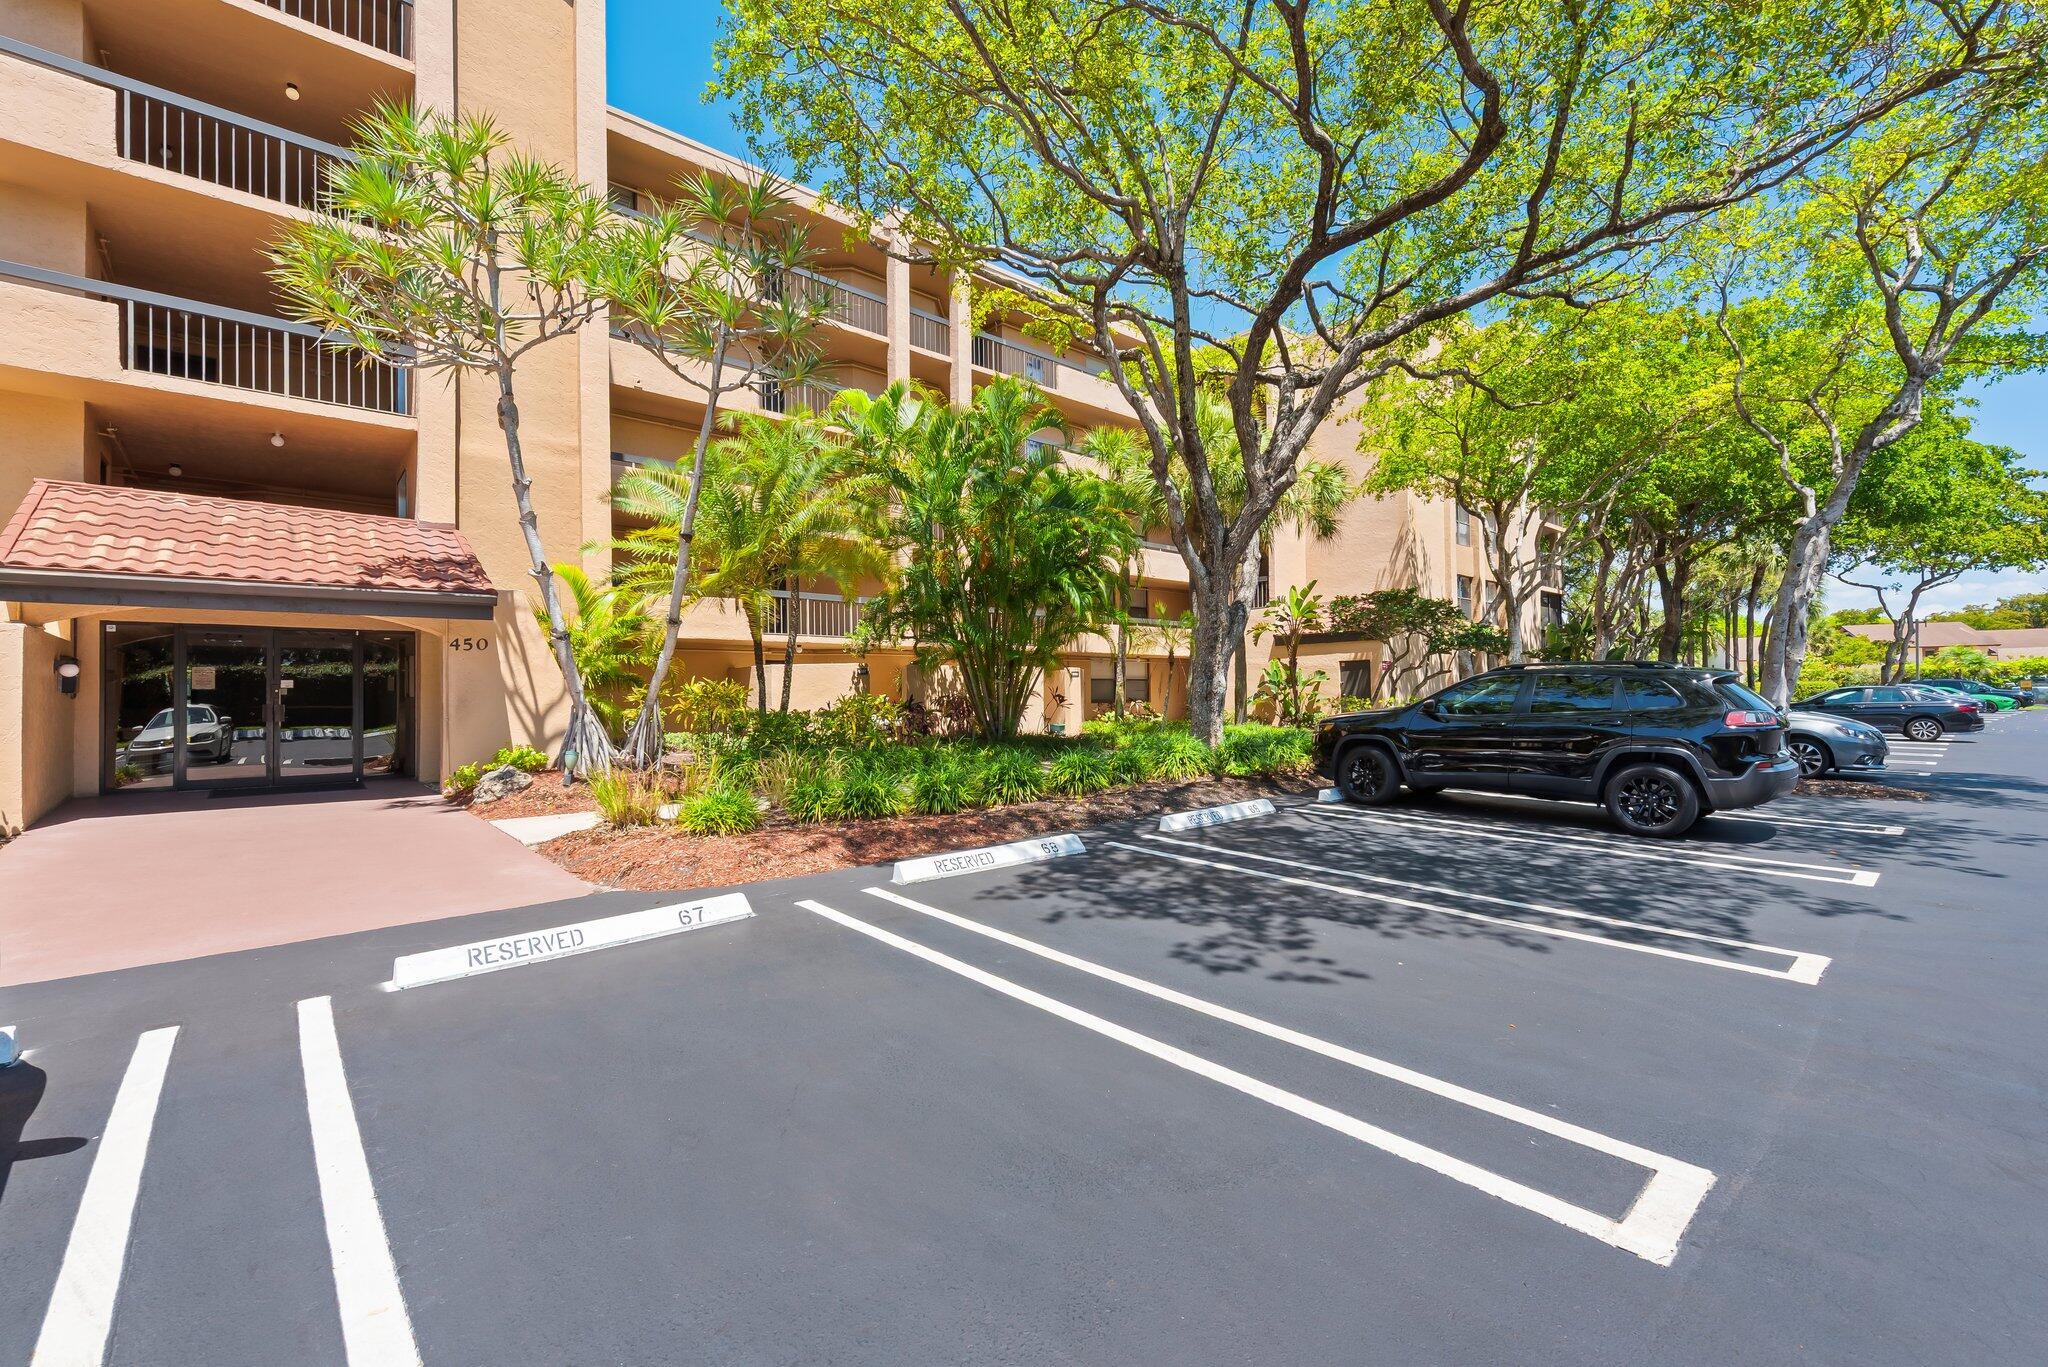
Active
$310,000
1
bds
|
1
ba
|
758
sqft
|
built
1981
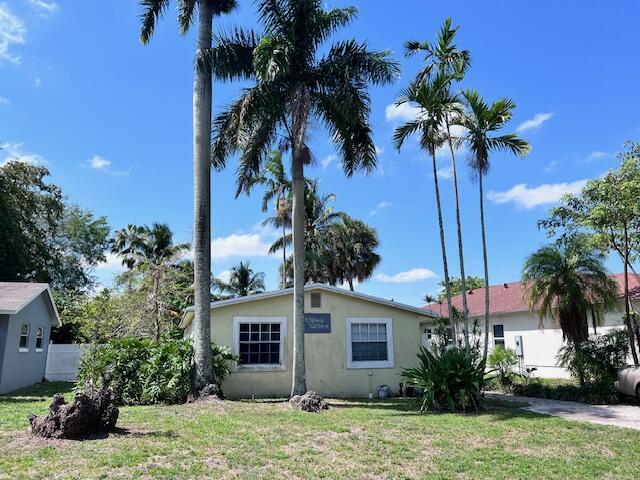
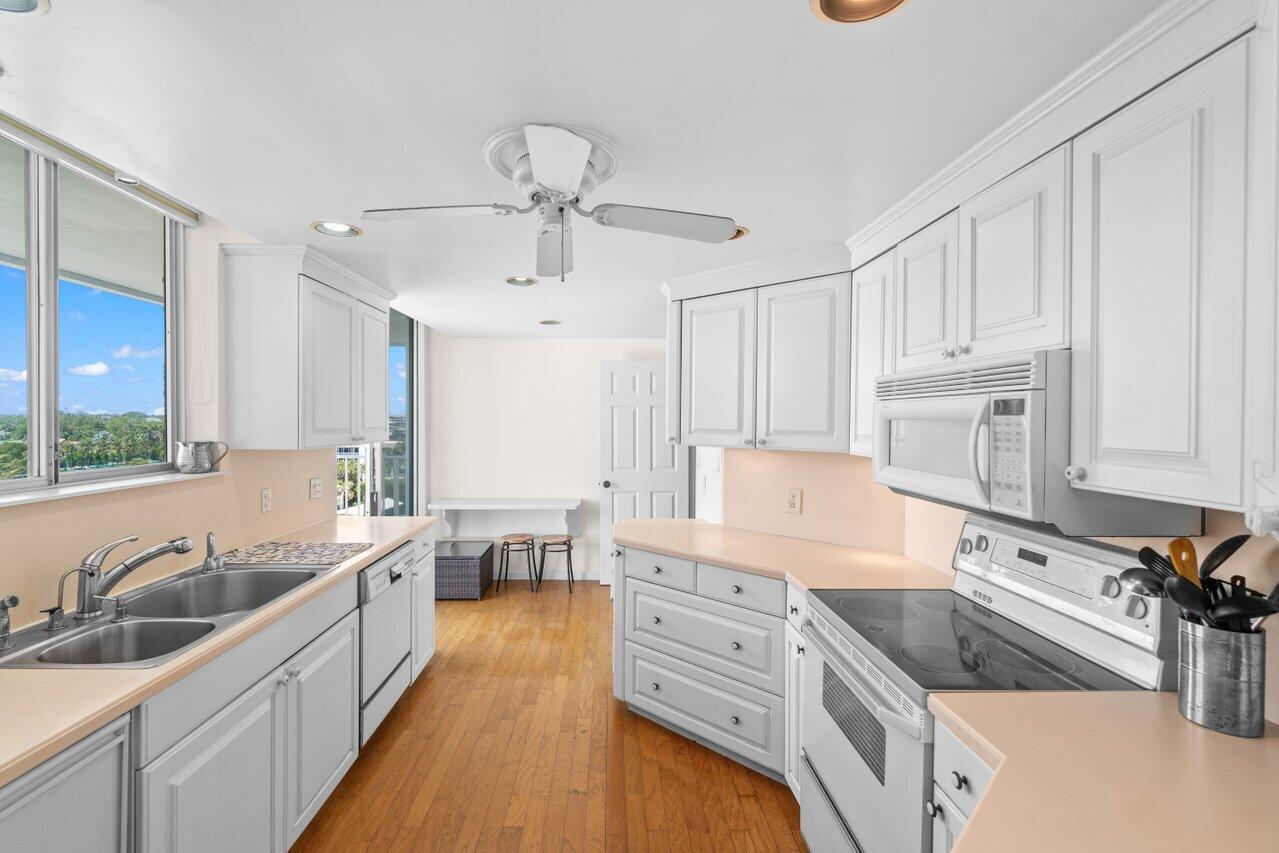
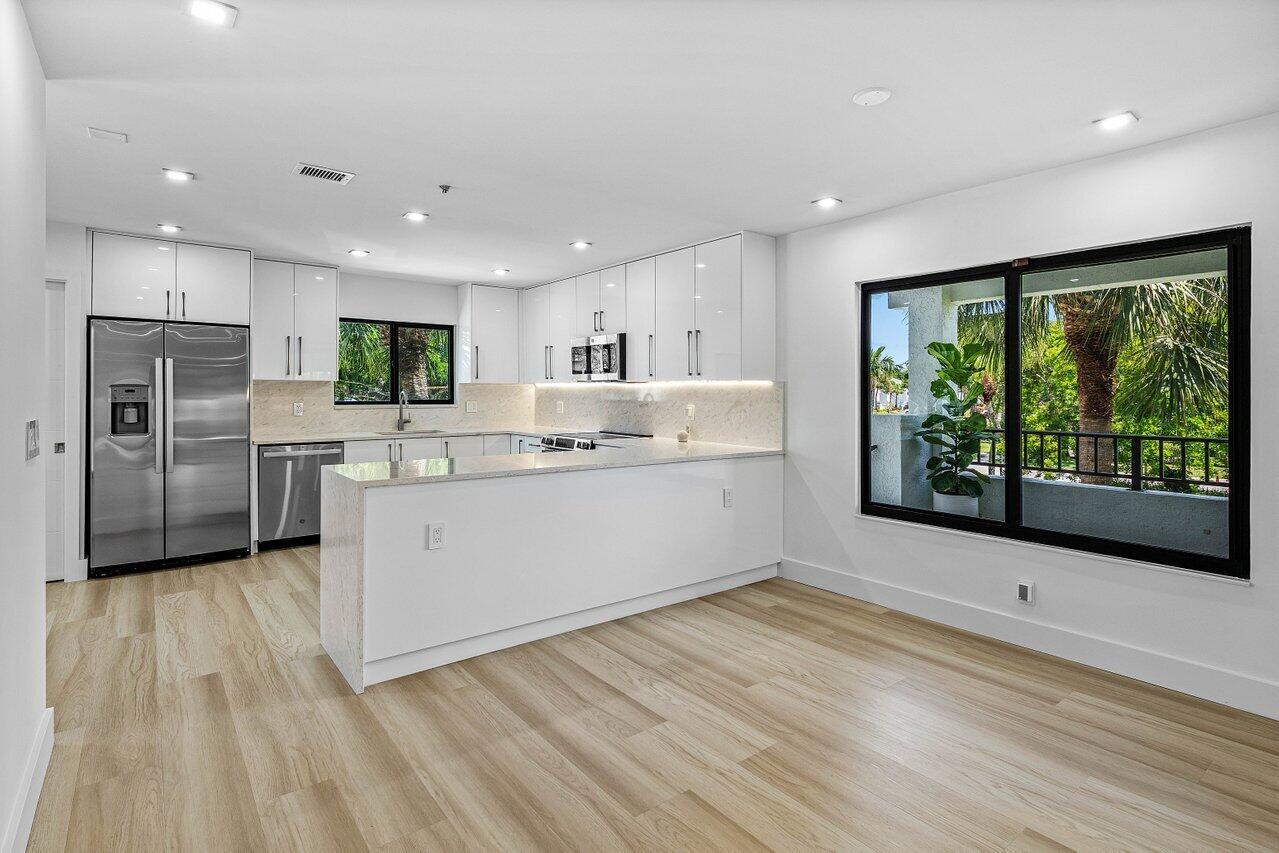
450 Egret Cir, Delray Beach, FL 33444
$519
Cash flow
8.7%
Cash-on-Cash Return
8.2%
Cap rate
1.3%
Rent to Value Ratio
Active
$67,900
1
bds
|
2
ba
|
726
sqft
|
built
1974
215 Monaco E, Delray Beach, FL 33446
$280
Cash flow
4.8%
Cash-on-Cash Return
4.9%
Cap rate
2.4%
Rent to Value Ratio
643 out of 742 properties for sale in Delray Beach, FL
Limited Results Shown
Create a free account, or log in to reveal all property listings and enjoy the complete experience.
Active
$475,000
3
bds
|
2
ba
|
927
sqft
|
built
1958
5305 Cleveland Rd, Delray Beach, FL 33484
$-426
Cash flow
-4.7%
Cash-on-Cash Return
5.1%
Cap rate
0.8%
Rent to Value Ratio
Active
$2,350,000
5
bds
|
8
ba
|
5,188
sqft
|
built
2016
8520 Lewis River Rd, Delray Beach, FL 33446
$-10,450
Cash flow
-23.2%
Cash-on-Cash Return
0.8%
Cap rate
0.3%
Rent to Value Ratio
Active
$1,119,000
4
bds
|
3
ba
|
1,912
sqft
|
built
2014
426 Lucky Ln, Delray Beach, FL 33444
$-1,376
Cash flow
-6.4%
Cash-on-Cash Return
4.7%
Cap rate
0.7%
Rent to Value Ratio
Active under contract
$500,000
4
bds
|
2
ba
|
1,342
sqft
|
built
1980
2543 Dolphin Dr, Delray Beach, FL 33445
$-752
Cash flow
-7.8%
Cash-on-Cash Return
4.3%
Cap rate
0.6%
Rent to Value Ratio
Active
$310,000
1
bds
|
1
ba
|
758
sqft
|
built
1981
450 Egret Cir, Delray Beach, FL 33444
$519
Cash flow
8.7%
Cash-on-Cash Return
8.2%
Cap rate
1.3%
Rent to Value Ratio
Active
$67,900
1
bds
|
2
ba
|
726
sqft
|
built
1974
215 Monaco E, Delray Beach, FL 33446
$280
Cash flow
4.8%
Cash-on-Cash Return
4.9%
Cap rate
2.4%
Rent to Value Ratio
Pending
$329,999
2
bds
|
3
ba
|
1,558
sqft
|
built
1981
475 Canal Pt N, Delray Beach, FL 33444
$-842
Cash flow
-13.3%
Cash-on-Cash Return
3.1%
Cap rate
0.8%
Rent to Value Ratio
Active
$631,000
3
bds
|
2
ba
|
1,722
sqft
|
built
1997
13664 Kiltie Ct, Delray Beach, FL 33446
$-1,726
Cash flow
-14.3%
Cash-on-Cash Return
2.9%
Cap rate
0.6%
Rent to Value Ratio
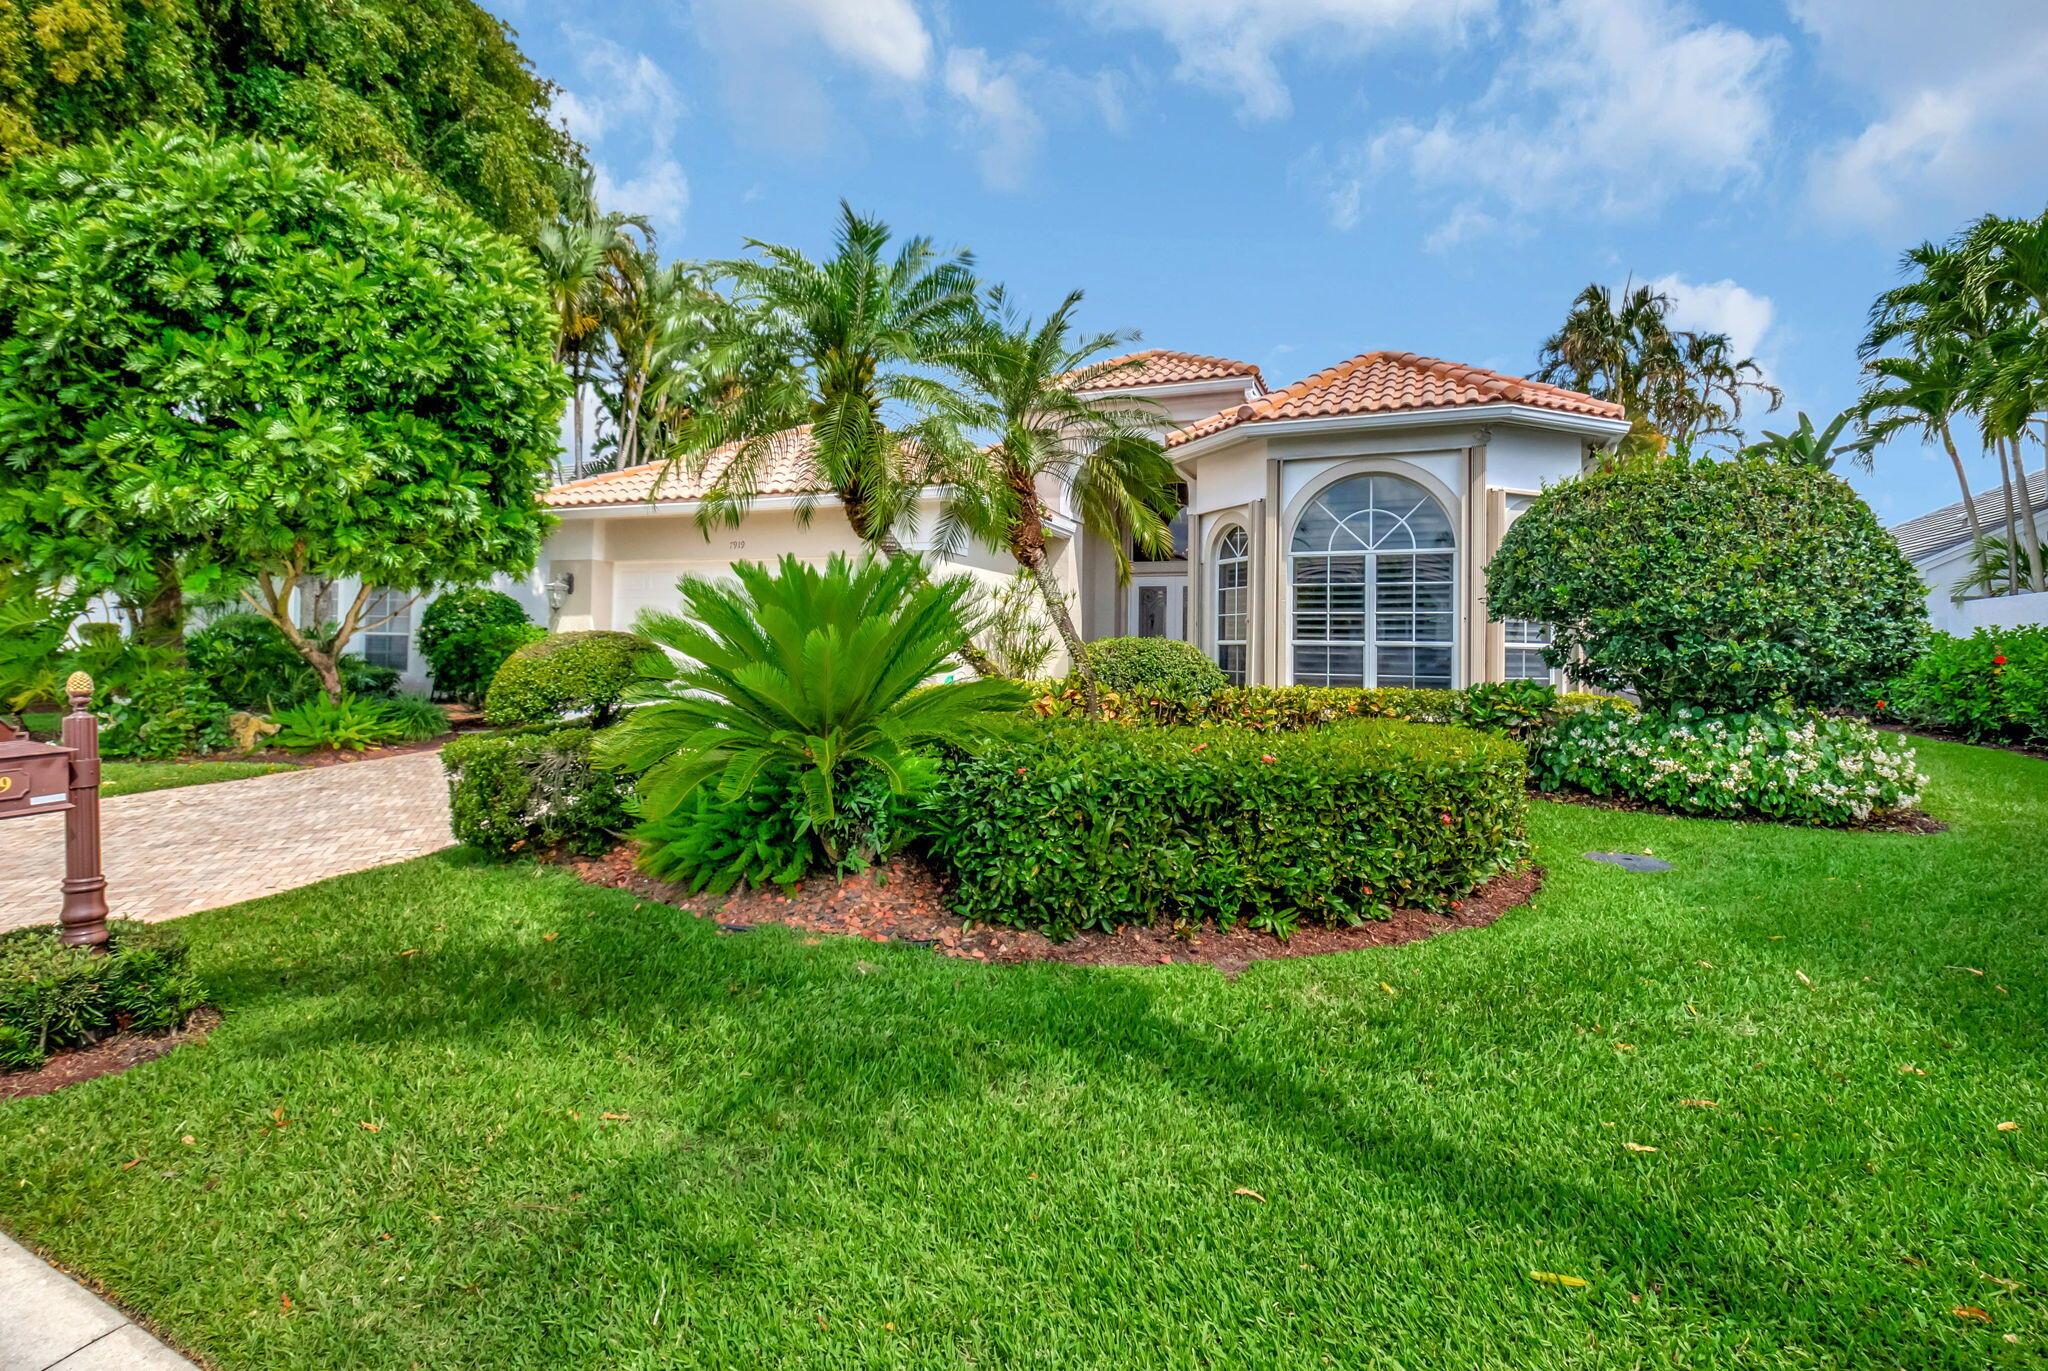
Active under contract
$1,695,000
3
bds
|
3
ba
|
3,148
sqft
|
built
1998
7919 L Aquila Way, Delray Beach, FL 33446
$-4,174
Cash flow
-12.8%
Cash-on-Cash Return
3.2%
Cap rate
0.5%
Rent to Value Ratio
Active
$799,000
1
bds
|
1
ba
|
822
sqft
|
built
2019
236 SE 5th Ave, Delray Beach, FL 33483
$-2,622
Cash flow
-17.1%
Cash-on-Cash Return
2.2%
Cap rate
0.6%
Rent to Value Ratio
Active
$429,900
2
bds
|
2
ba
|
1,175
sqft
|
built
1980
955 Dotterel Rd, Delray Beach, FL 33444
$-1,530
Cash flow
-18.6%
Cash-on-Cash Return
1.9%
Cap rate
0.5%
Rent to Value Ratio
Active
$2,100,000
4
bds
|
5
ba
|
4,248
sqft
|
built
2016
16926 Pavilion Way, Delray Beach, FL 33446
$-7,430
Cash flow
-18.5%
Cash-on-Cash Return
1.9%
Cap rate
0.4%
Rent to Value Ratio
Active
$339,999
2
bds
|
2
ba
|
1,028
sqft
|
built
2005
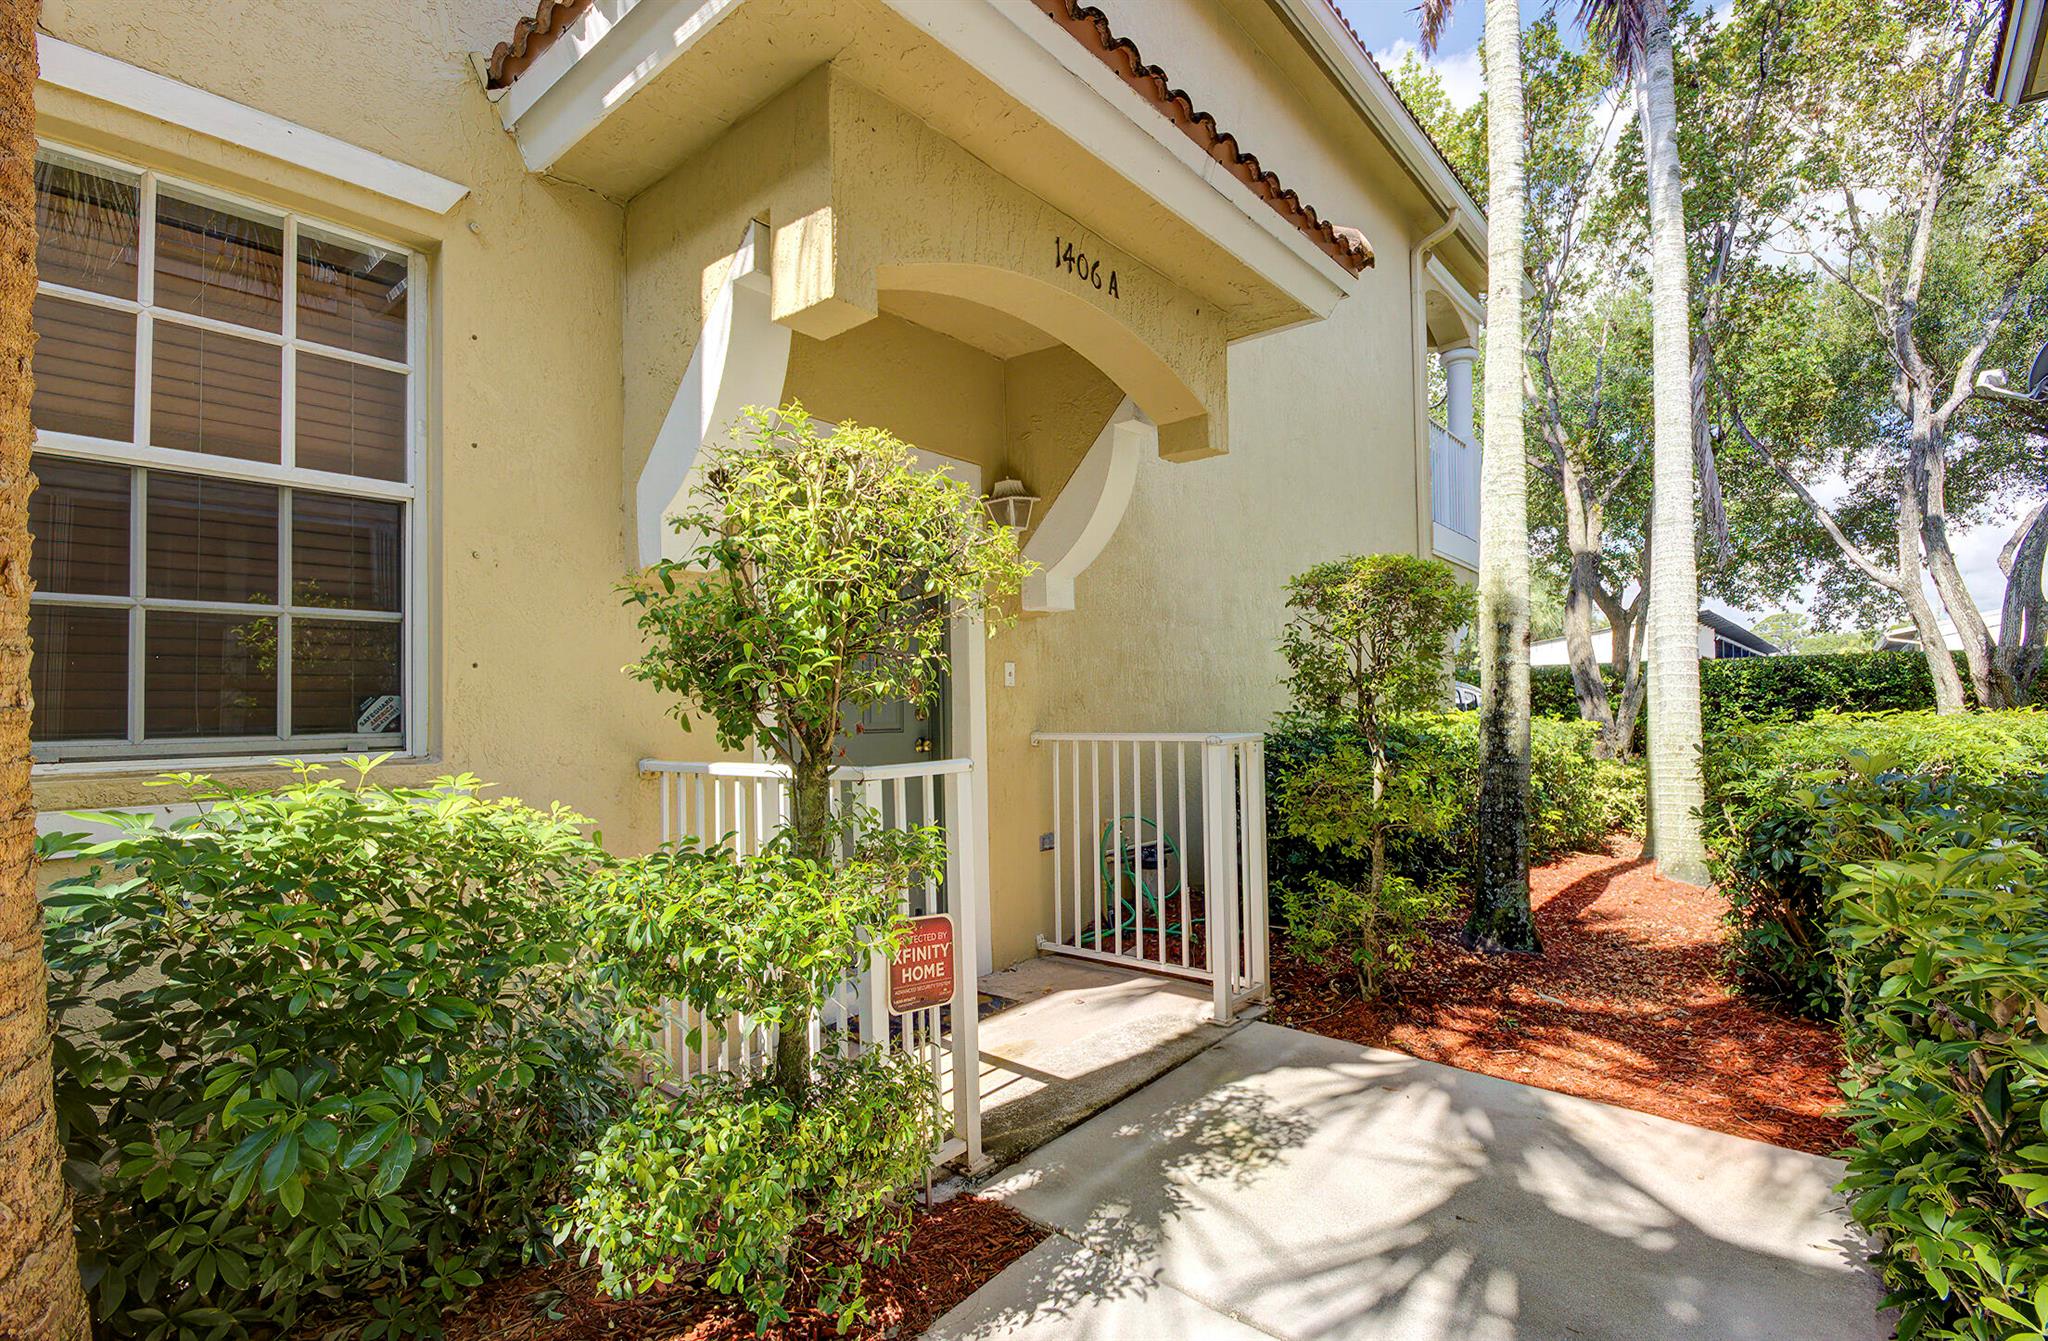
1406 W Wickham Cir, Delray Beach, FL 33445
$-996
Cash flow
-15.3%
Cash-on-Cash Return
2.6%
Cap rate
0.7%
Rent to Value Ratio
Active
$450,000
2
bds
|
1
ba
|
884
sqft
|
built
1968
134 SW 10th Ave, Delray Beach, FL 33444
$-836
Cash flow
-9.7%
Cash-on-Cash Return
3.9%
Cap rate
0.6%
Rent to Value Ratio
Active
$232,000
2
bds
|
1
ba
|
1,000
sqft
|
built
1983
2715 Ponce De Leon Blvd, Delray Beach, FL 33445
$-465
Cash flow
-10.5%
Cash-on-Cash Return
3.7%
Cap rate
0.9%
Rent to Value Ratio
Active
$524,999
3
bds
|
3
ba
|
1,758
sqft
|
built
2013
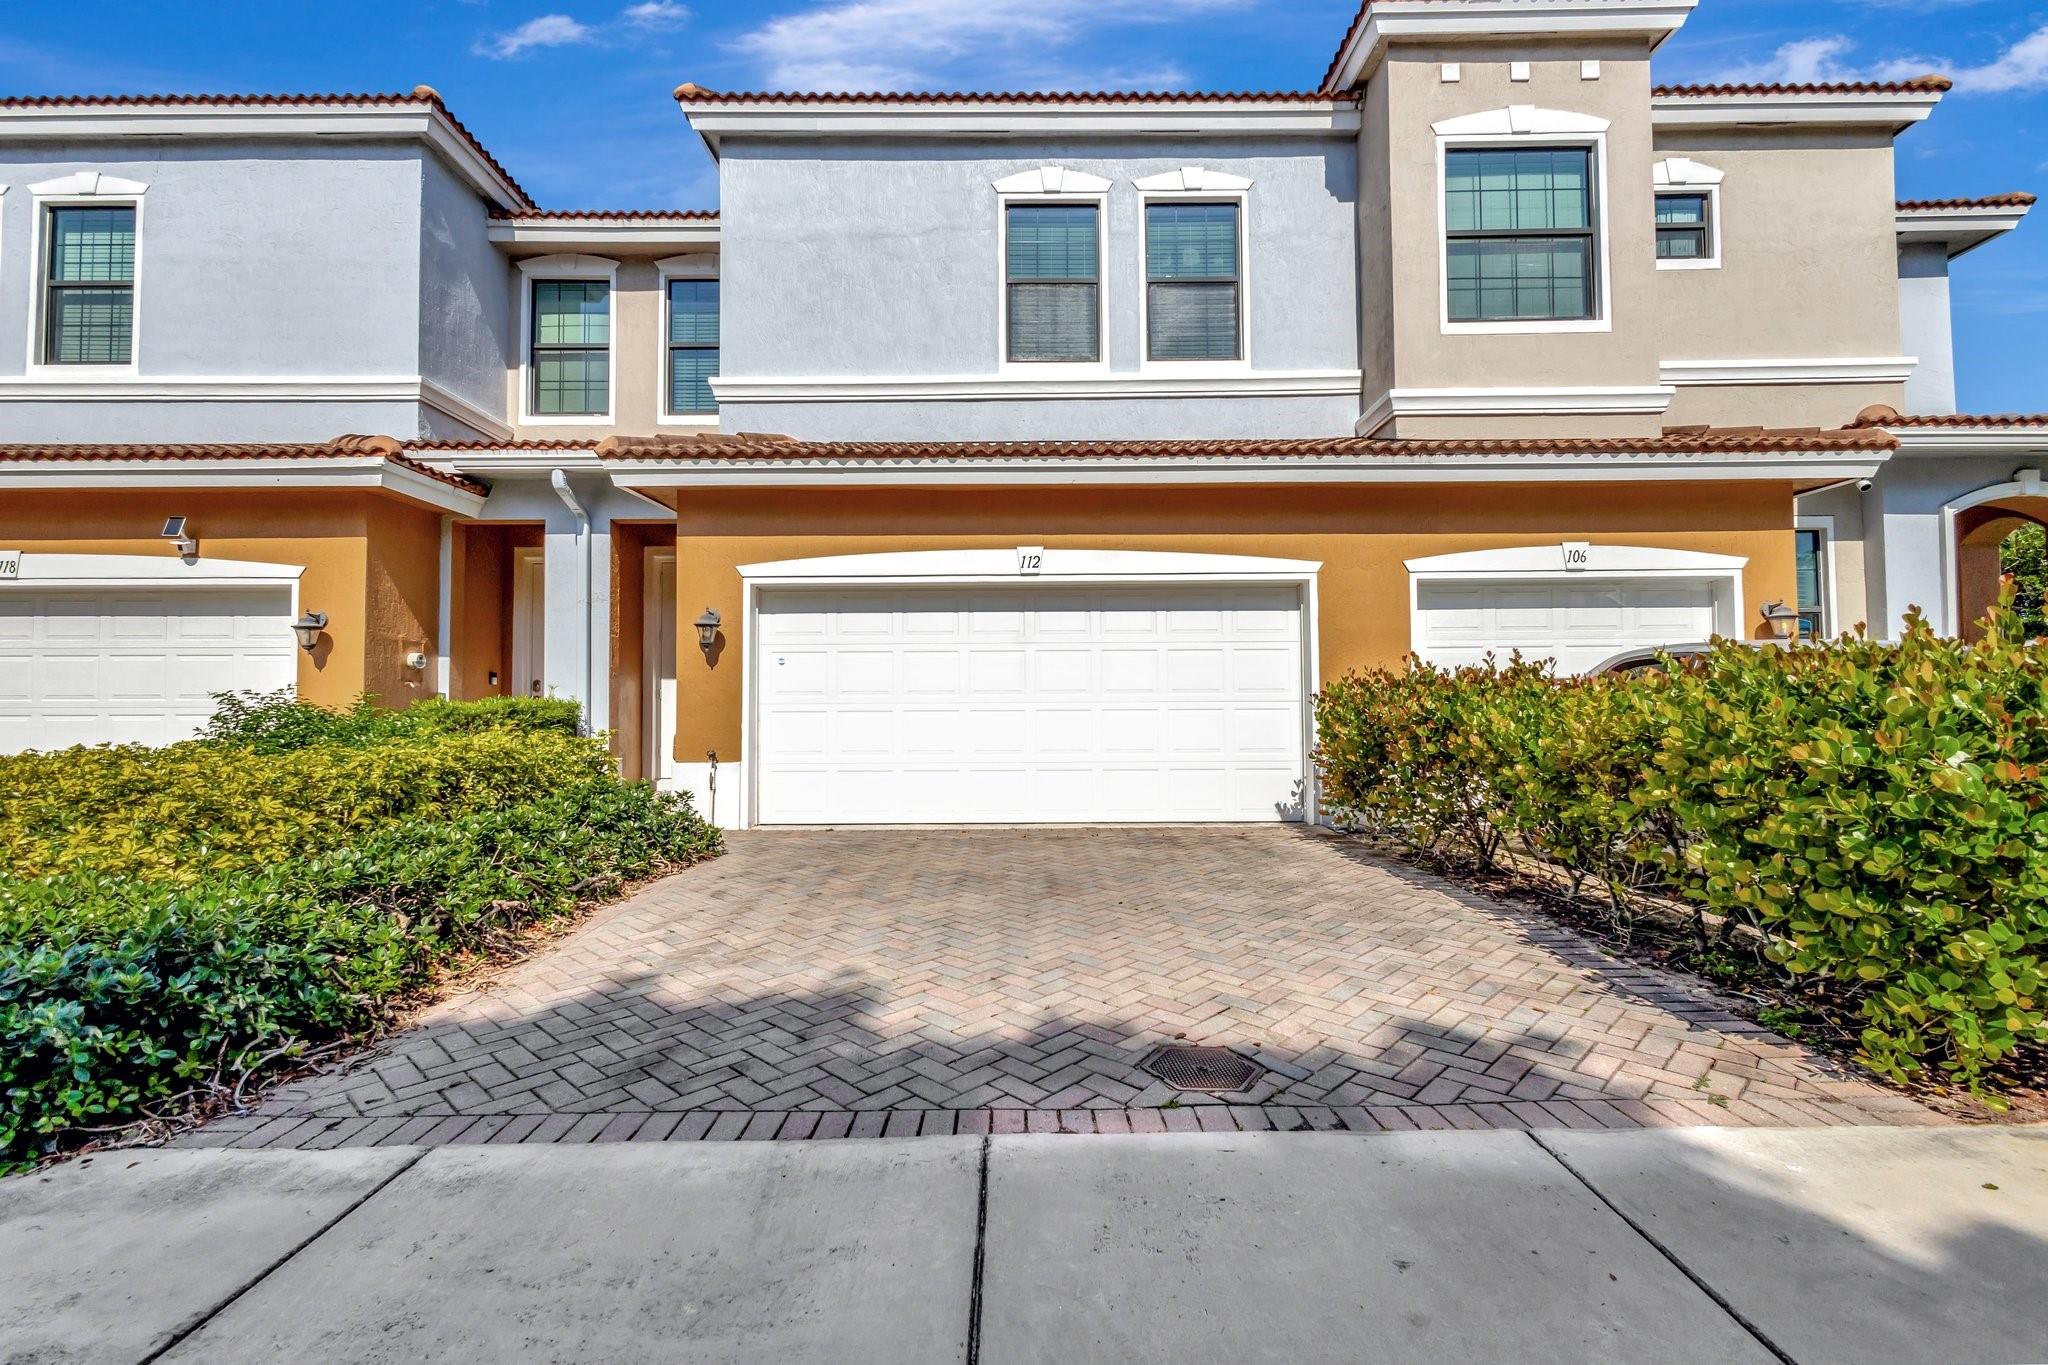
112 W Astor Cir, Delray Beach, FL 33484
$-1,367
Cash flow
-13.6%
Cash-on-Cash Return
3.0%
Cap rate
0.7%
Rent to Value Ratio
Active
$350,000
3
bds
|
1
ba
|
864
sqft
|
built
1957
4928 Jefferson Rd, Delray Beach, FL 33445
$-308
Cash flow
-4.6%
Cash-on-Cash Return
5.1%
Cap rate
0.7%
Rent to Value Ratio
Active
$1,890,000
5
bds
|
8
ba
|
5,188
sqft
|
built
2015
8151 Lost Creek Ln, Delray Beach, FL 33446
$-5,412
Cash flow
-14.9%
Cash-on-Cash Return
2.7%
Cap rate
0.5%
Rent to Value Ratio
Active
$215,000
2
bds
|
2
ba
|
1,138
sqft
|
built
1992
5936 Morningstar Cir, Delray Beach, FL 33484
$-319
Cash flow
-7.7%
Cash-on-Cash Return
4.4%
Cap rate
1.1%
Rent to Value Ratio
Active
$715,000
2
bds
|
2
ba
|
960
sqft
|
built
1965
1228 George Bush Blvd, Delray Beach, FL 33483
$-1,120
Cash flow
-8.2%
Cash-on-Cash Return
4.3%
Cap rate
0.6%
Rent to Value Ratio
Active
$1,299,999
3
bds
|
3
ba
|
2,138
sqft
|
built
1973
2000 S Ocean Blvd, Delray Beach, FL 33483
$-4,865
Cash flow
-19.5%
Cash-on-Cash Return
1.7%
Cap rate
0.6%
Rent to Value Ratio

Active
$550,000
1
bds
|
1
ba
|
864
sqft
|
built
2004
255 NE 3rd Ave, Delray Beach, FL 33444
$-2,213
Cash flow
-21.0%
Cash-on-Cash Return
1.3%
Cap rate
0.5%
Rent to Value Ratio
Active
$319,000
2
bds
|
2
ba
|
1,079
sqft
|
built
2001
15035 Michelangelo Blvd, Delray Beach, FL 33446
$-581
Cash flow
-9.5%
Cash-on-Cash Return
4.0%
Cap rate
0.8%
Rent to Value Ratio
Active under contract
$1,295,000
2
bds
|
2
ba
|
1,491
sqft
|
built
1939
341 NE 7th Ave, Delray Beach, FL 33483
$-3,336
Cash flow
-13.4%
Cash-on-Cash Return
3.1%
Cap rate
0.5%
Rent to Value Ratio
Active
$2,150,000
3
bds
|
4
ba
|
3,373
sqft
|
built
2015
9288 Tropez Ln, Delray Beach, FL 33446
$-8,653
Cash flow
-21.0%
Cash-on-Cash Return
1.3%
Cap rate
0.4%
Rent to Value Ratio
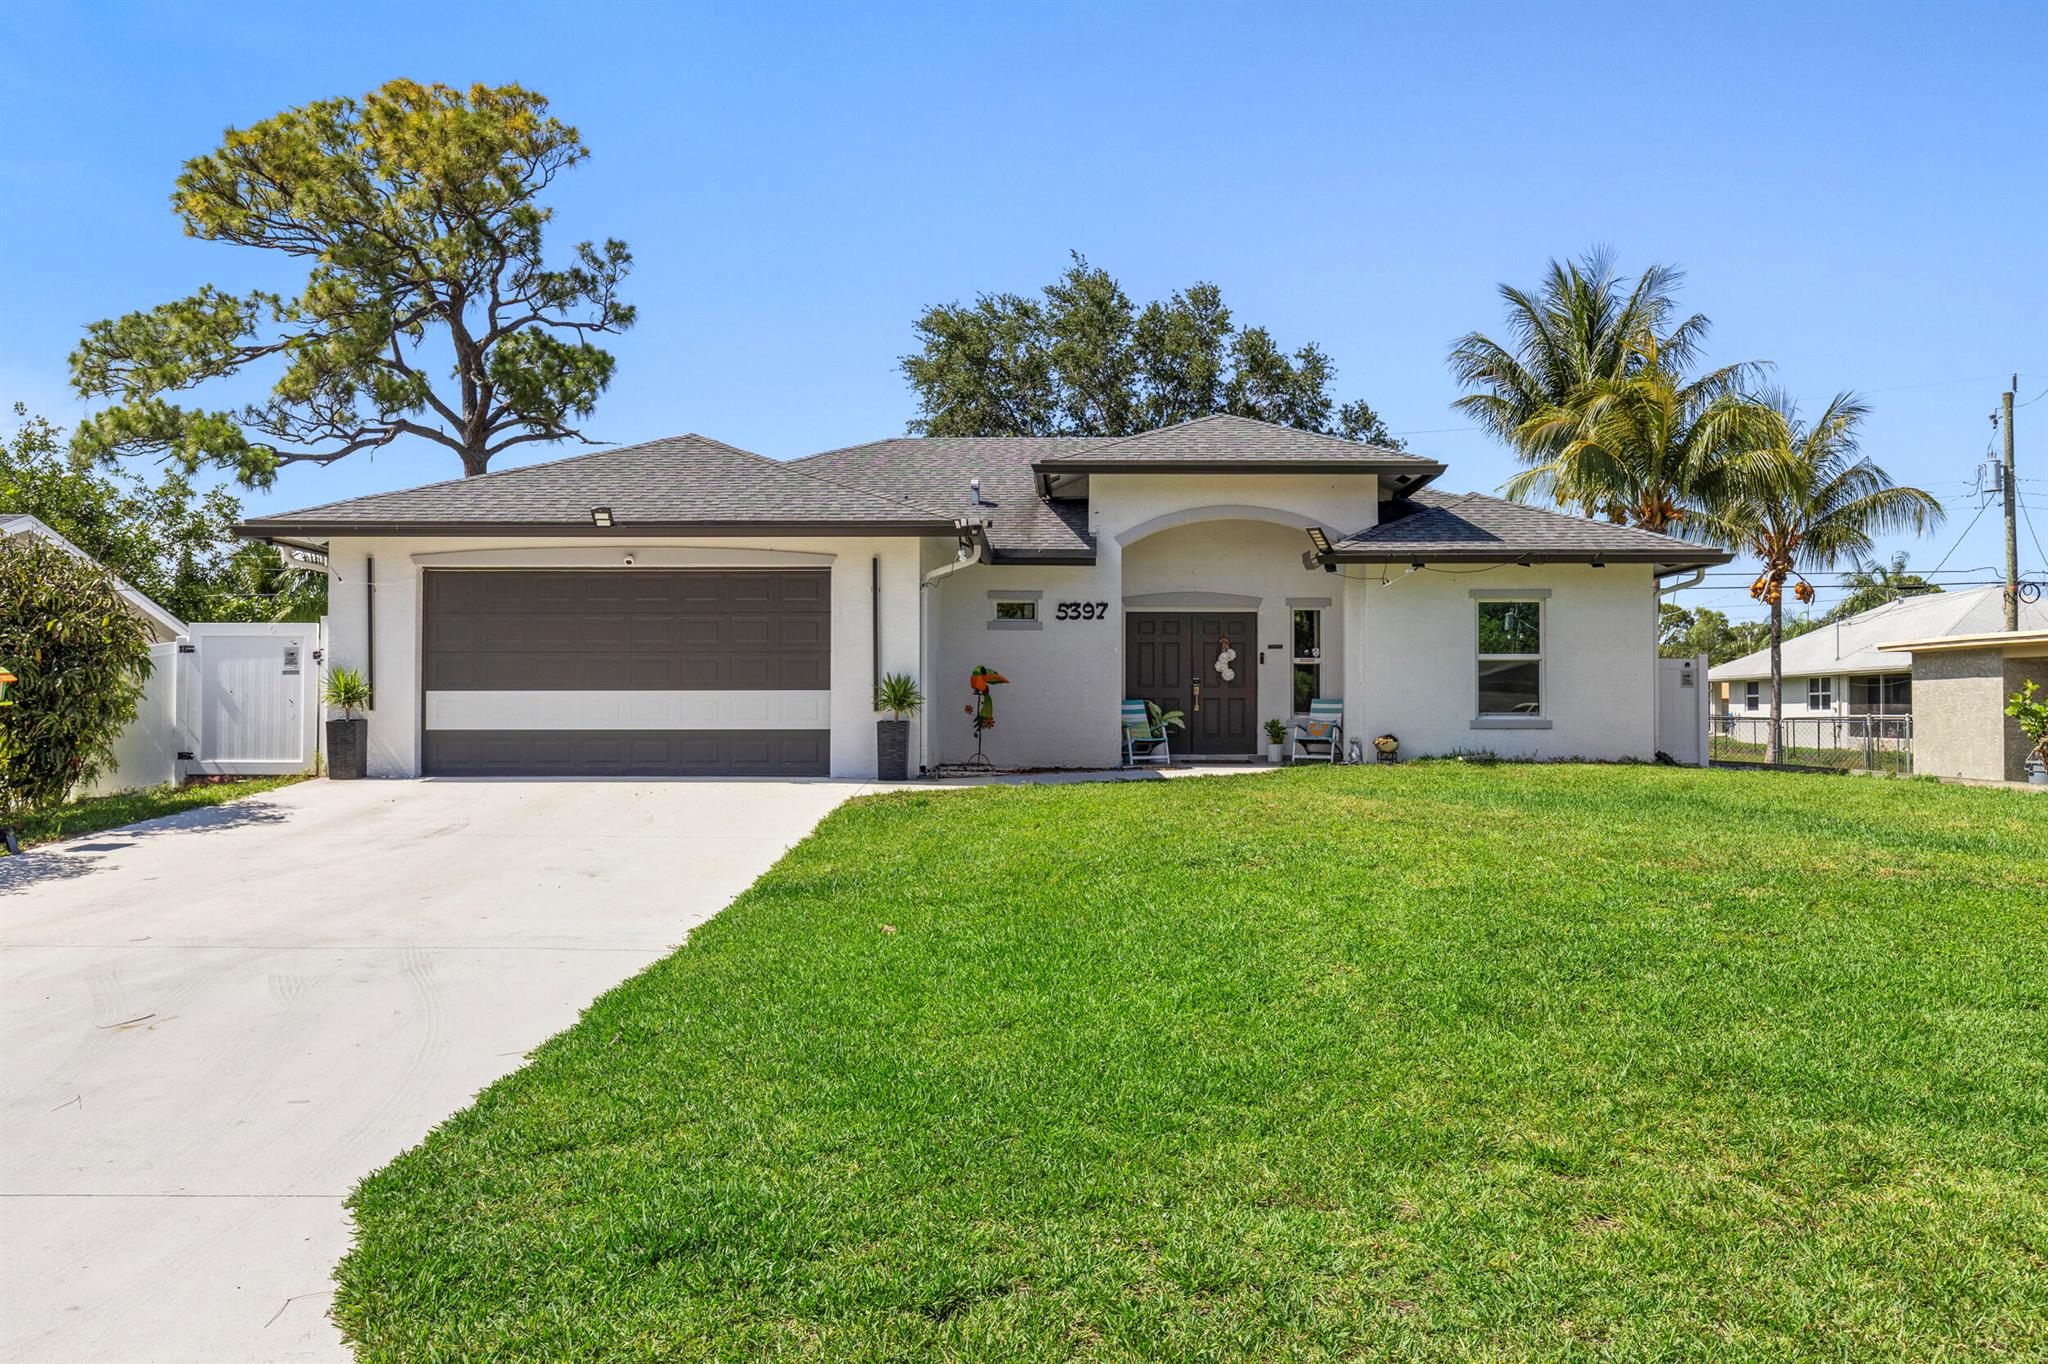
Active
$670,000
3
bds
|
3
ba
|
1,608
sqft
|
built
2018
5397 Cleveland Rd, Delray Beach, FL 33484
$-1,674
Cash flow
-13.0%
Cash-on-Cash Return
3.1%
Cap rate
0.5%
Rent to Value Ratio
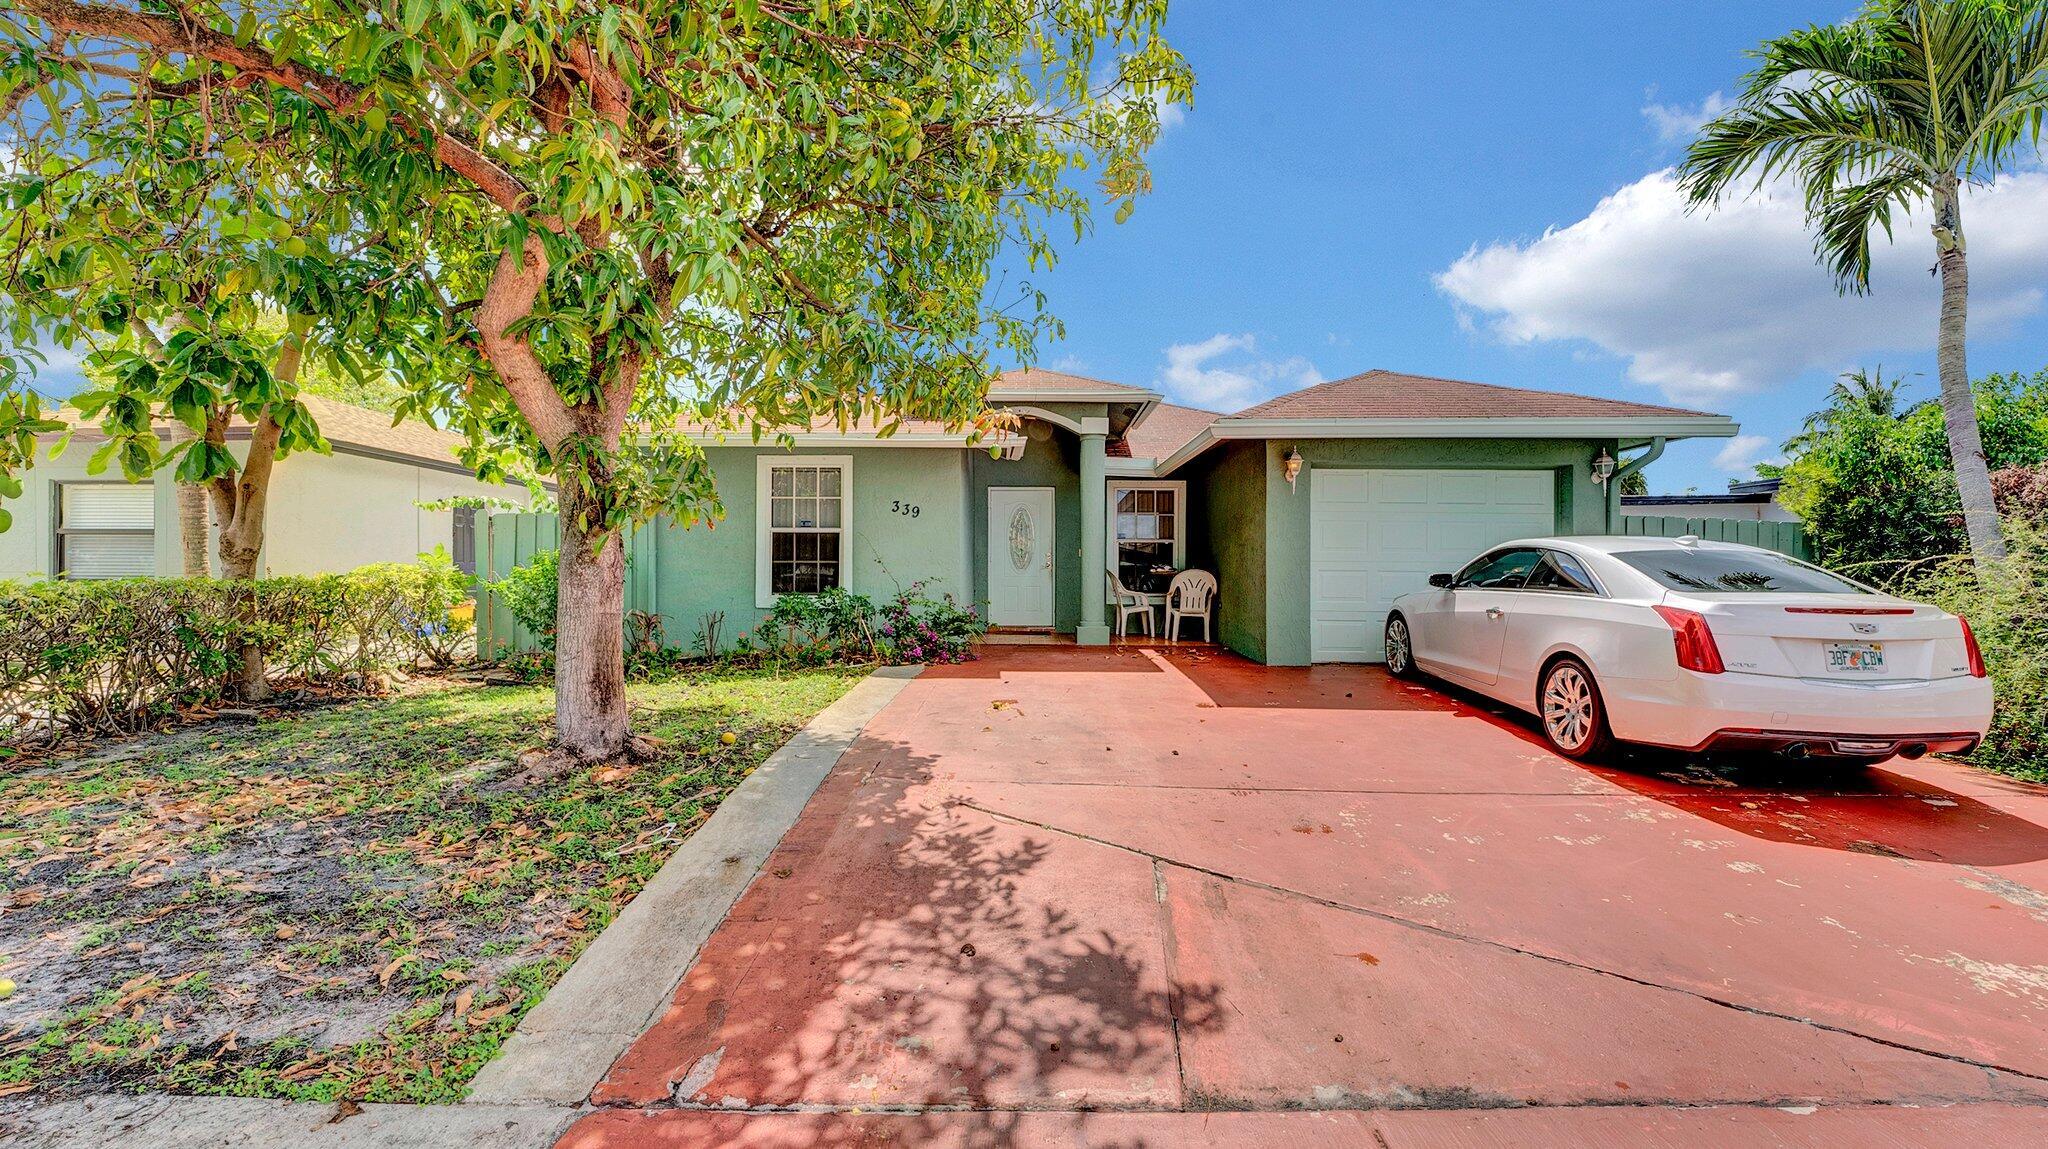
Active
$1,100,000
4
bds
|
2
ba
|
1,360
sqft
|
built
2003
339 NW 5th Ave, Delray Beach, FL 33444
$-3,578
Cash flow
-17.0%
Cash-on-Cash Return
2.2%
Cap rate
0.4%
Rent to Value Ratio
Active
$500,000
3
bds
|
2
ba
|
1,282
sqft
|
built
1972
417 SW 8th Ave, Delray Beach, FL 33444
$-1,139
Cash flow
-11.9%
Cash-on-Cash Return
3.4%
Cap rate
0.5%
Rent to Value Ratio
Active
$725,000
2
bds
|
2
ba
|
1,083
sqft
|
built
2008
111 SE 2nd St, Delray Beach, FL 33444
$-2,651
Cash flow
-19.1%
Cash-on-Cash Return
1.8%
Cap rate
0.5%
Rent to Value Ratio
Active
$279,900
2
bds
|
2
ba
|
1,078
sqft
|
built
1989
13811 Oneida Dr, Delray Beach, FL 33446
$-957
Cash flow
-17.8%
Cash-on-Cash Return
2.0%
Cap rate
0.7%
Rent to Value Ratio
Active
$565,000
3
bds
|
3
ba
|
1,762
sqft
|
built
2013
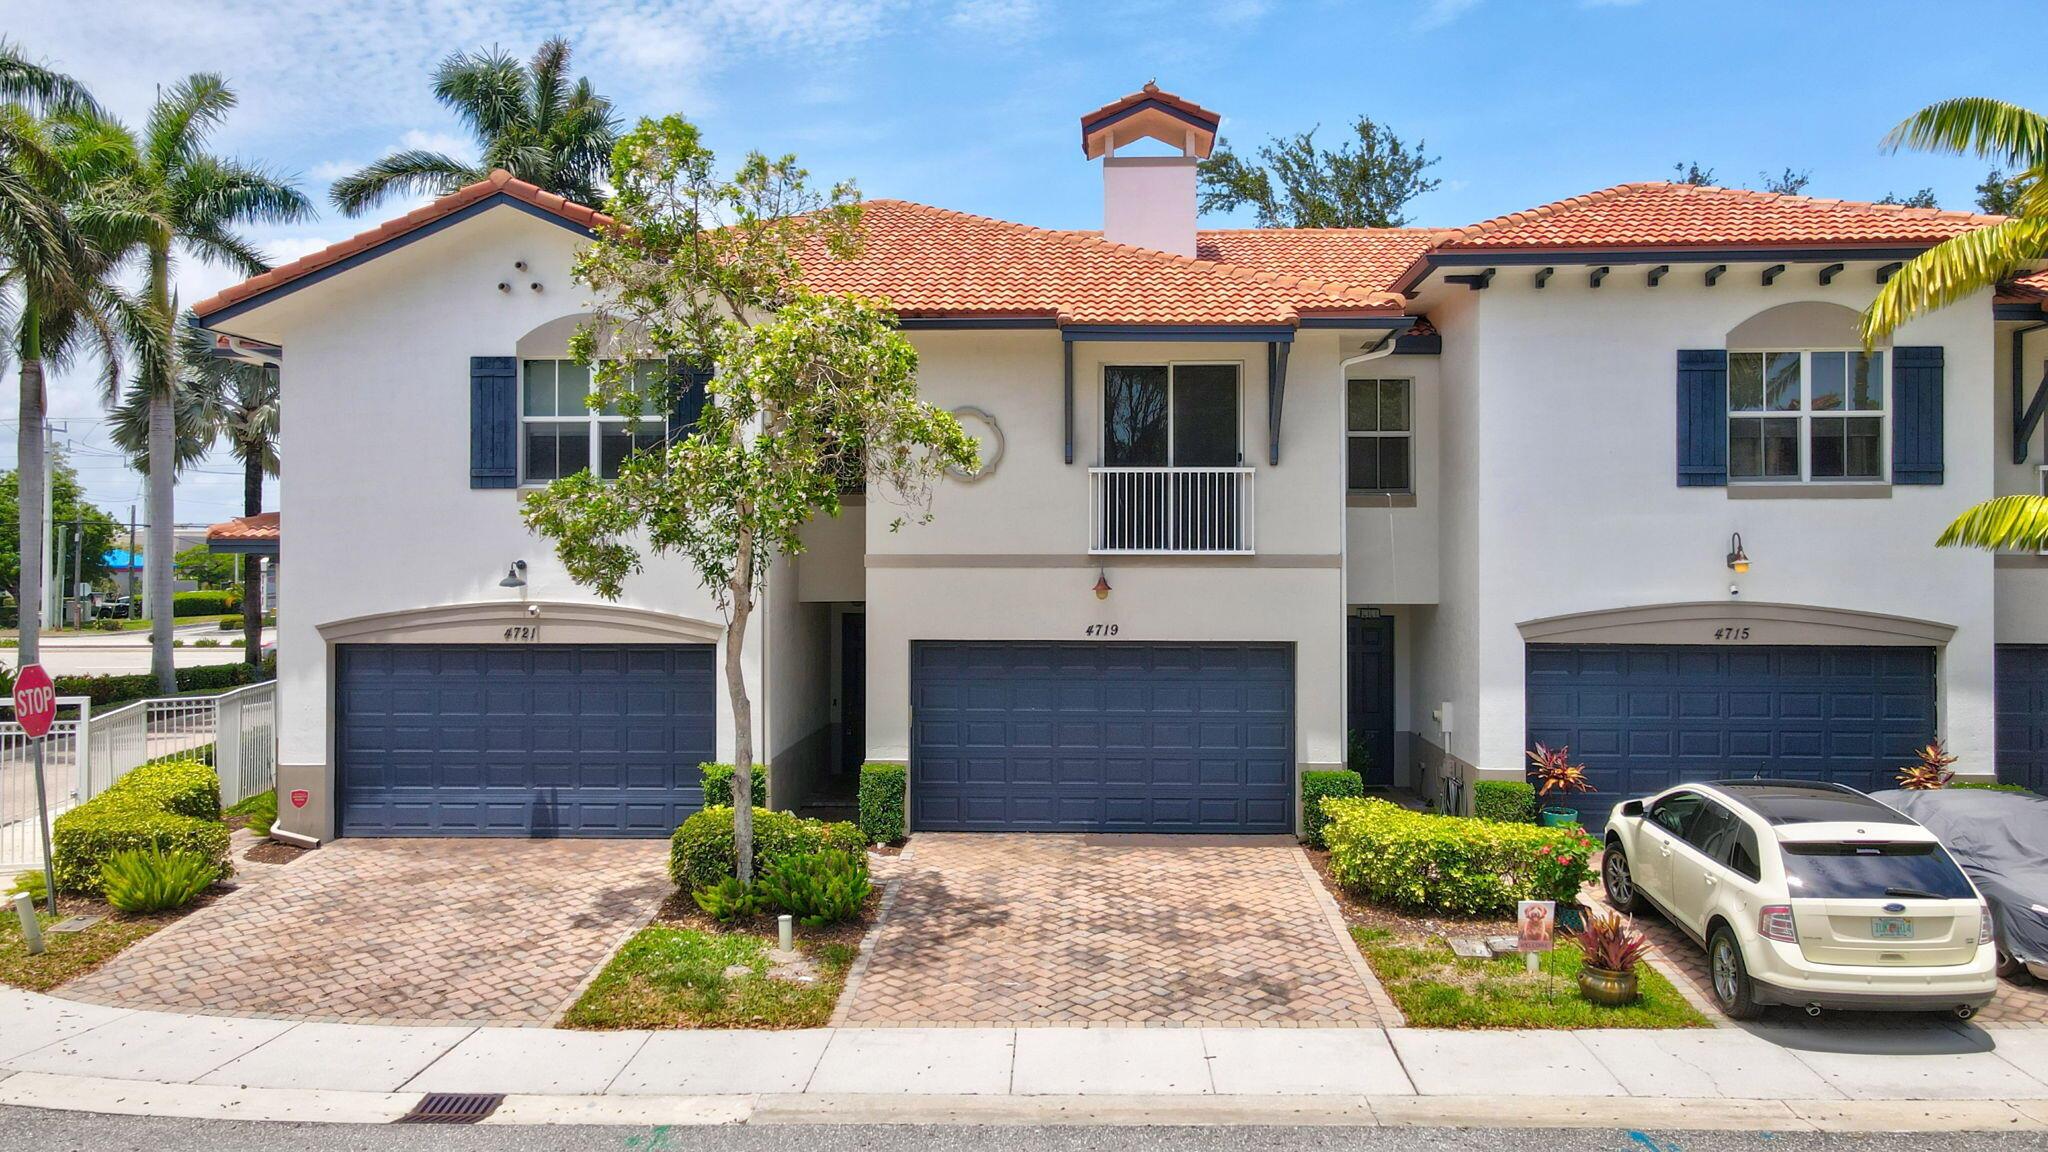
4719 N Prive Cir, Delray Beach, FL 33445
$-1,319
Cash flow
-12.2%
Cash-on-Cash Return
3.3%
Cap rate
0.6%
Rent to Value Ratio
Active
$575,000
4
bds
|
2
ba
|
1,336
sqft
|
built
1994
214 NW 13th Ave, Delray Beach, FL 33444
$-799
Cash flow
-7.2%
Cash-on-Cash Return
4.5%
Cap rate
0.7%
Rent to Value Ratio
Active
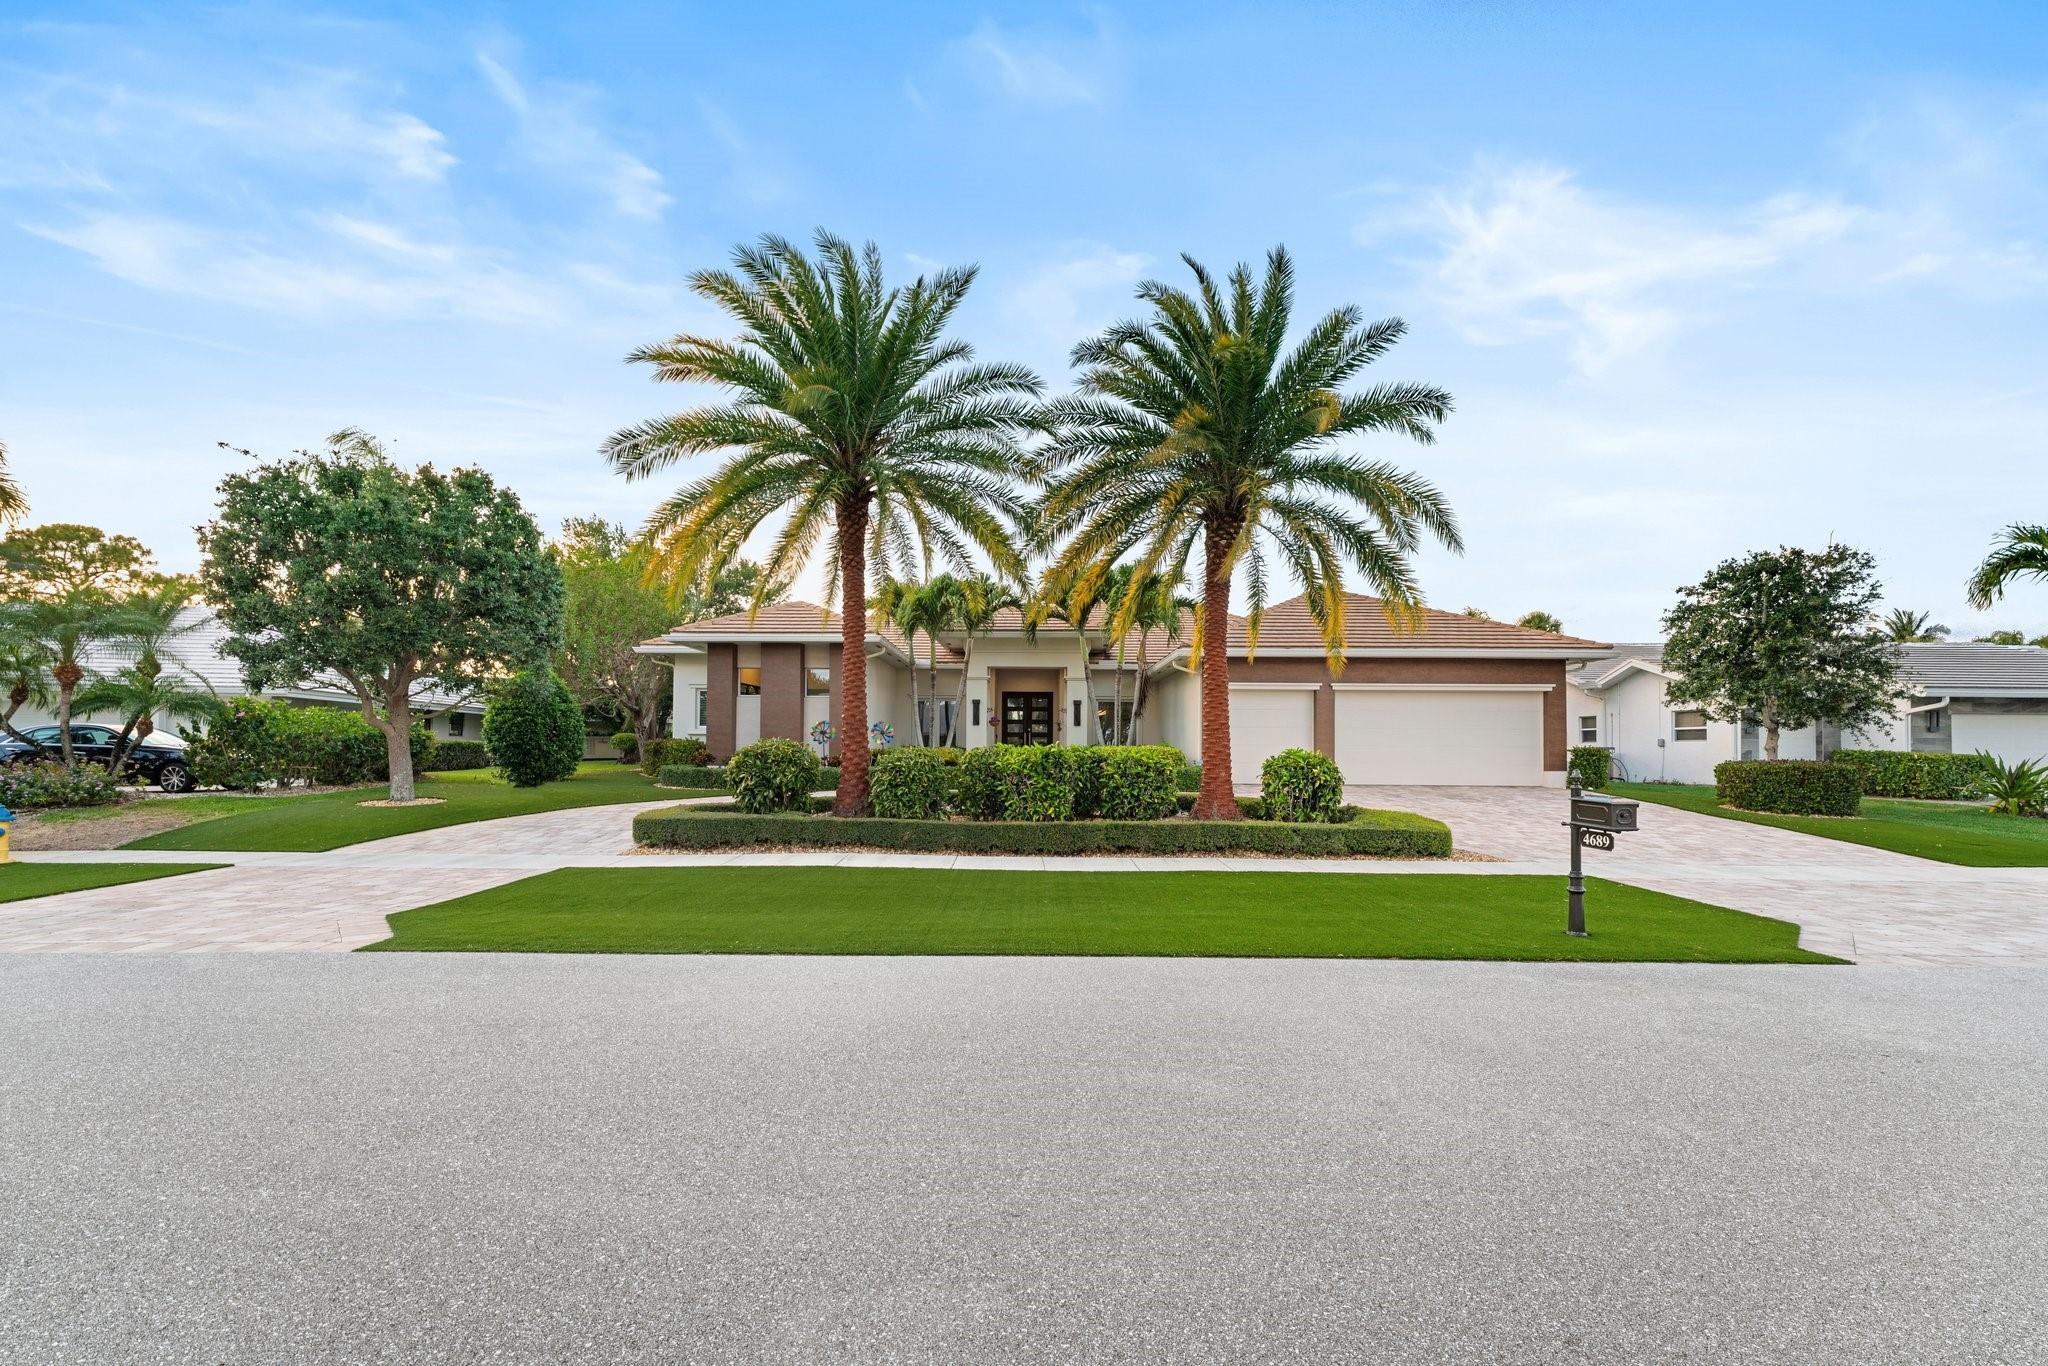
$3,250,000
4
bds
|
5
ba
|
4,139
sqft
|
built
2016
4689 Tree Fern Dr, Delray Beach, FL 33445
$-15,277
Cash flow
-24.5%
Cash-on-Cash Return
0.5%
Cap rate
0.2%
Rent to Value Ratio
Active
$289,000
2
bds
|
2
ba
|
1,175
sqft
|
built
1971
1045 Circle Ter E, Delray Beach, FL 33445
$-896
Cash flow
-16.2%
Cash-on-Cash Return
2.4%
Cap rate
0.7%
Rent to Value Ratio
Active
$859,000
4
bds
|
3
ba
|
3,328
sqft
|
built
2016
8127 Rainforest Jasper Ln, Delray Beach, FL 33446
$-1,658
Cash flow
-10.1%
Cash-on-Cash Return
3.8%
Cap rate
0.7%
Rent to Value Ratio
Active
$249,000
2
bds
|
2
ba
|
1,148
sqft
|
built
1978
6805 Moonlit Dr, Delray Beach, FL 33446
$-566
Cash flow
-11.9%
Cash-on-Cash Return
3.4%
Cap rate
0.8%
Rent to Value Ratio
Active
$639,000
2
bds
|
2
ba
|
1,750
sqft
|
built
1987
15702 Loch Maree Ln, Delray Beach, FL 33446
$-1,837
Cash flow
-15.0%
Cash-on-Cash Return
2.7%
Cap rate
0.5%
Rent to Value Ratio
Active
$579,000
2
bds
|
2
ba
|
1,686
sqft
|
built
1987
15687 Loch Maree Ln, Delray Beach, FL 33446
$-1,385
Cash flow
-12.5%
Cash-on-Cash Return
3.3%
Cap rate
0.7%
Rent to Value Ratio
Active
$355,000
2
bds
|
2
ba
|
1,158
sqft
|
built
1981
2920 SW 22nd Cir, Delray Beach, FL 33445
$-1,234
Cash flow
-18.1%
Cash-on-Cash Return
2.0%
Cap rate
0.6%
Rent to Value Ratio
Active
$699,500
3
bds
|
2
ba
|
1,619
sqft
|
built
1977
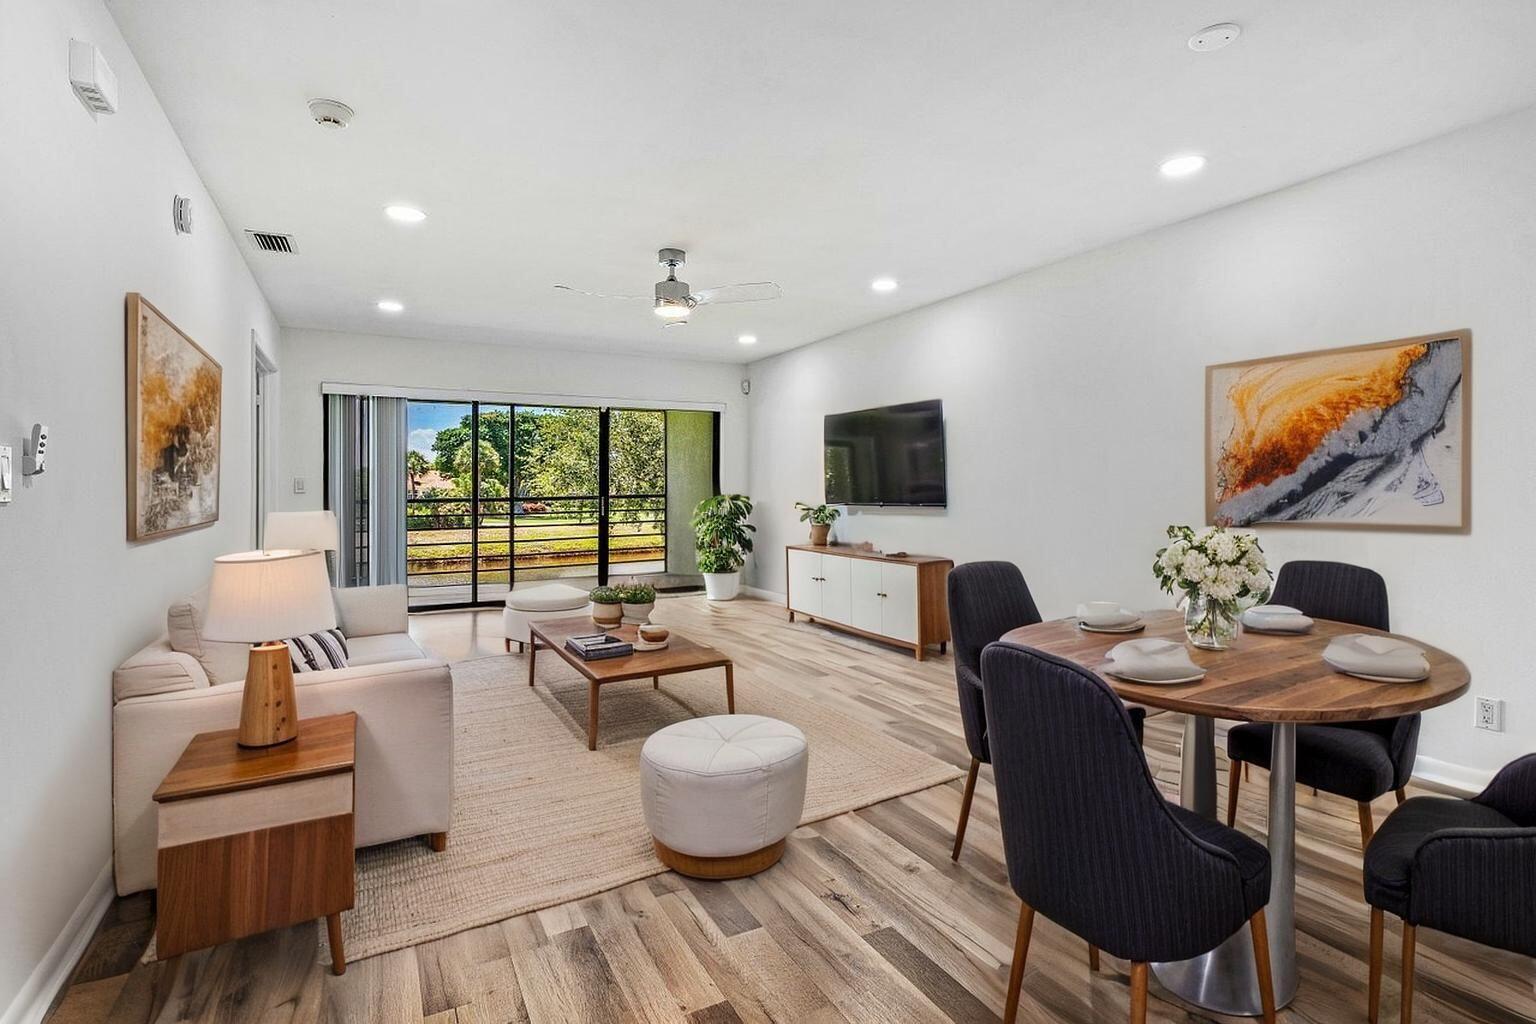
639 Mallard Dr, Delray Beach, FL 33444
$-1,560
Cash flow
-11.6%
Cash-on-Cash Return
3.5%
Cap rate
0.5%
Rent to Value Ratio