Denver, CO Investment Properties for Sale
Browse homes for sale and investment properties in Denver, CO. Refine your search by price, property type, or more.
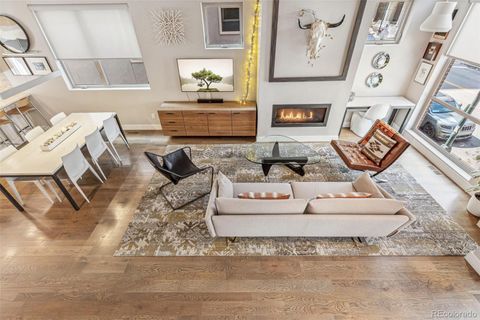
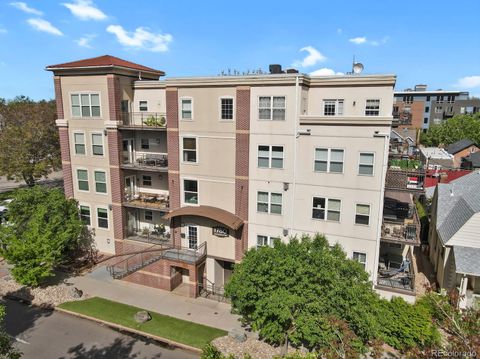
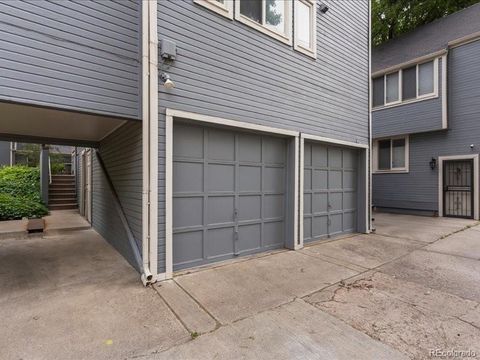
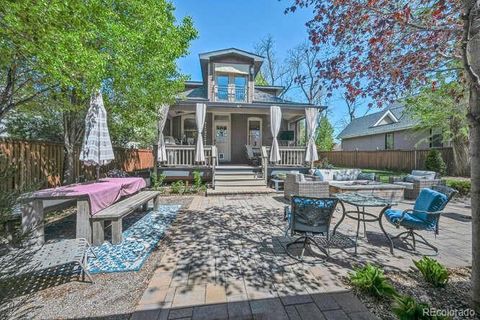
Best cash flowing properties in Denver, CO
Active
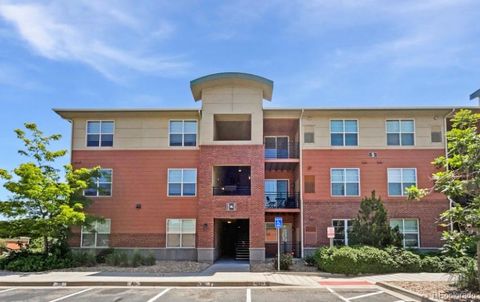
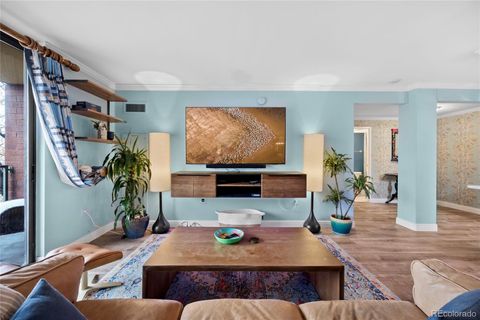
$187,500
1
bds
|
1
ba
|
763
sqft
|
built
1971
7615 E Quincy Ave, Denver, CO 80237
$-368
Cash flow
-10.2%
Cash-on-Cash Return
3.9%
Cap rate
0.9%
Rent to Value Ratio
Active
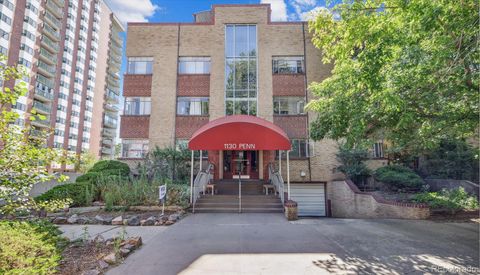
$199,900
1
bds
|
1
ba
|
565
sqft
|
built
1926
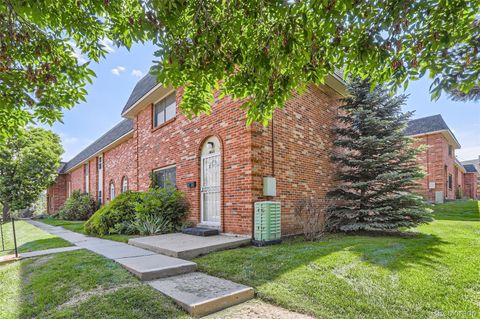
1341 N Washington St, Denver, CO 80203
$-444
Cash flow
-11.6%
Cash-on-Cash Return
3.6%
Cap rate
0.8%
Rent to Value Ratio
3,429 out of 3,556 properties for sale in Denver, CO
Limited Results Shown
Create a free account, or log in to reveal all property listings and enjoy the complete experience.
Active
$540,000
3
bds
|
2
ba
|
2,179
sqft
|
built
1956
2939 S Zurich Ct, Denver, CO 80236
$-632
Cash flow
-6.1%
Cash-on-Cash Return
4.3%
Cap rate
0.6%
Rent to Value Ratio
Active
$500,000
4
bds
|
2
ba
|
1,700
sqft
|
built
1959
7066 Jennie Dr, Denver, CO 80221
$-618
Cash flow
-6.4%
Cash-on-Cash Return
4.2%
Cap rate
0.6%
Rent to Value Ratio
Active
$2,299,000
4
bds
|
5
ba
|
4,098
sqft
|
built
2020
863 S Race St, Denver, CO 80209
$-7,535
Cash flow
-17.1%
Cash-on-Cash Return
2.3%
Cap rate
0.3%
Rent to Value Ratio
Active
$535,000
3
bds
|
2
ba
|
1,136
sqft
|
built
1964
1785 S Zuni St, Denver, CO 80223
$-1,073
Cash flow
-10.5%
Cash-on-Cash Return
3.9%
Cap rate
0.5%
Rent to Value Ratio
Active
$699,000
4
bds
|
2
ba
|
1,450
sqft
|
built
1937
1712 S Gilpin St, Denver, CO 80210
$-1,677
Cash flow
-12.5%
Cash-on-Cash Return
3.4%
Cap rate
0.5%
Rent to Value Ratio
Active
$860,000
4
bds
|
4
ba
|
2,122
sqft
|
built
2006
4545 S Monaco St, Denver, CO 80237
$-2,927
Cash flow
-17.8%
Cash-on-Cash Return
2.2%
Cap rate
0.4%
Rent to Value Ratio
Active
$349,999
2
bds
|
2
ba
|
1,203
sqft
|
built
1979
1160 Monaco Pkwy, Denver, CO 80220
$-634
Cash flow
-9.5%
Cash-on-Cash Return
4.1%
Cap rate
0.7%
Rent to Value Ratio
Active
$799,500
2
bds
|
2
ba
|
1,317
sqft
|
built
1998
111 S Monroe St, Denver, CO 80209
$-1,798
Cash flow
-11.7%
Cash-on-Cash Return
3.6%
Cap rate
0.6%
Rent to Value Ratio
Active
$187,500
1
bds
|
1
ba
|
763
sqft
|
built
1971
7615 E Quincy Ave, Denver, CO 80237
$-368
Cash flow
-10.2%
Cash-on-Cash Return
3.9%
Cap rate
0.9%
Rent to Value Ratio

Active
$475,000
3
bds
|
2
ba
|
863
sqft
|
built
1982
5167 Sable St, Denver, CO 80239
$-518
Cash flow
-5.7%
Cash-on-Cash Return
5.0%
Cap rate
0.7%
Rent to Value Ratio
Active
$1,775,000
5
bds
|
4
ba
|
4,117
sqft
|
built
2015
2377 S Humboldt St, Denver, CO 80210
$-5,059
Cash flow
-14.9%
Cash-on-Cash Return
2.8%
Cap rate
0.4%
Rent to Value Ratio

Active
$639,900
3
bds
|
2
ba
|
1,618
sqft
|
built
1949
6005 E Iowa Ave, Denver, CO 80224
$-885
Cash flow
-7.2%
Cash-on-Cash Return
4.0%
Cap rate
0.5%
Rent to Value Ratio
Active
$349,000
3
bds
|
2
ba
|
1,415
sqft
|
built
1973
2525 S Dayton Way, Denver, CO 80231
$-747
Cash flow
-11.2%
Cash-on-Cash Return
3.7%
Cap rate
0.7%
Rent to Value Ratio
Active
$499,900
2
bds
|
2
ba
|
1,371
sqft
|
built
1970
675 S University Blvd, Denver, CO 80209
$-1,696
Cash flow
-17.7%
Cash-on-Cash Return
2.2%
Cap rate
0.5%
Rent to Value Ratio
Active
$799,500
3
bds
|
3
ba
|
1,945
sqft
|
built
2015
4950 Lowell Blvd, Denver, CO 80221
$-1,479
Cash flow
-9.7%
Cash-on-Cash Return
4.0%
Cap rate
0.6%
Rent to Value Ratio
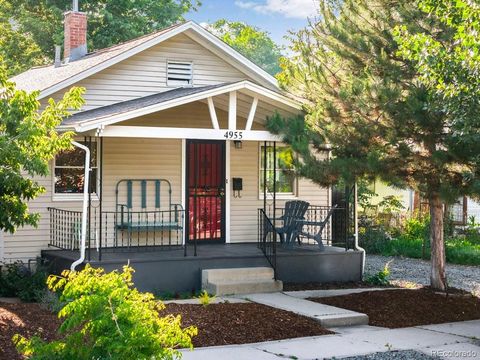
Active
$525,000
2
bds
|
1
ba
|
1,009
sqft
|
built
1922
4955 Julian St, Denver, CO 80221
$-1,007
Cash flow
-10.0%
Cash-on-Cash Return
4.0%
Cap rate
0.5%
Rent to Value Ratio
Active
$485,000
3
bds
|
1
ba
|
1,023
sqft
|
built
1955
1374 S Beach Ct, Denver, CO 80219
$-979
Cash flow
-10.5%
Cash-on-Cash Return
3.8%
Cap rate
0.5%
Rent to Value Ratio
Active
$905,000
3
bds
|
4
ba
|
2,082
sqft
|
built
2014
1012 Bannock St, Denver, CO 80204
$-2,741
Cash flow
-15.8%
Cash-on-Cash Return
2.6%
Cap rate
0.4%
Rent to Value Ratio
Active
$450,000
2
bds
|
2
ba
|
963
sqft
|
built
1999
1780 N Washington St, Denver, CO 80203
$-1,315
Cash flow
-15.2%
Cash-on-Cash Return
2.8%
Cap rate
0.5%
Rent to Value Ratio
Active
$199,900
1
bds
|
1
ba
|
565
sqft
|
built
1926
1341 N Washington St, Denver, CO 80203
$-444
Cash flow
-11.6%
Cash-on-Cash Return
3.6%
Cap rate
0.8%
Rent to Value Ratio
Active
$600,000
2
bds
|
3
ba
|
1,300
sqft
|
built
1984
101 S Downing St, Denver, CO 80209
$-1,626
Cash flow
-14.1%
Cash-on-Cash Return
3.0%
Cap rate
0.5%
Rent to Value Ratio
Active
$1,325,000
3
bds
|
2
ba
|
1,747
sqft
|
built
1906
1027 S University Blvd, Denver, CO 80209
$-4,449
Cash flow
-17.5%
Cash-on-Cash Return
2.2%
Cap rate
0.3%
Rent to Value Ratio
Active
$1,050,000
4
bds
|
3
ba
|
2,747
sqft
|
built
1924
772 Garfield St, Denver, CO 80206
$-2,781
Cash flow
-13.8%
Cash-on-Cash Return
3.1%
Cap rate
0.4%
Rent to Value Ratio
Active
$290,000
2
bds
|
2
ba
|
1,006
sqft
|
built
1973
5300 E Cherry Creek South Dr, Denver, CO 80246
$-891
Cash flow
-16.0%
Cash-on-Cash Return
2.6%
Cap rate
0.6%
Rent to Value Ratio
Active
$799,000
5
bds
|
3
ba
|
2,167
sqft
|
built
1953
1856 S Monroe St, Denver, CO 80210
$-2,129
Cash flow
-13.9%
Cash-on-Cash Return
3.1%
Cap rate
0.5%
Rent to Value Ratio

Active
$395,000
2
bds
|
1
ba
|
840
sqft
|
built
1953
3555 Leyden St, Denver, CO 80207
$-830
Cash flow
-11.0%
Cash-on-Cash Return
3.7%
Cap rate
0.5%
Rent to Value Ratio
Active
$1,025,000
4
bds
|
3
ba
|
1,964
sqft
|
built
1925
3361 W 36th Ave, Denver, CO 80211
$-3,522
Cash flow
-17.9%
Cash-on-Cash Return
2.1%
Cap rate
0.3%
Rent to Value Ratio
Active
$450,000
2
bds
|
2
ba
|
918
sqft
|
built
2006
1975 N Grant St, Denver, CO 80203
$-1,476
Cash flow
-17.1%
Cash-on-Cash Return
2.3%
Cap rate
0.5%
Rent to Value Ratio
Active
$476,000
3
bds
|
3
ba
|
1,420
sqft
|
built
2012
5550 Malta St, Denver, CO 80249
$-851
Cash flow
-9.3%
Cash-on-Cash Return
4.1%
Cap rate
0.6%
Rent to Value Ratio
Active
$659,900
3
bds
|
4
ba
|
1,691
sqft
|
built
2016
852 Kalamath St, Denver, CO 80204
$-1,320
Cash flow
-10.4%
Cash-on-Cash Return
3.9%
Cap rate
0.5%
Rent to Value Ratio
Active
$570,000
5
bds
|
2
ba
|
925
sqft
|
built
1970
7961 Granada Rd, Denver, CO 80221
$-1,208
Cash flow
-11.1%
Cash-on-Cash Return
3.7%
Cap rate
0.5%
Rent to Value Ratio
Active
$255,000
1
bds
|
1
ba
|
698
sqft
|
built
2005
4100 Albion St, Denver, CO 80216
$-750
Cash flow
-15.3%
Cash-on-Cash Return
2.7%
Cap rate
0.7%
Rent to Value Ratio
Active
$244,000
1
bds
|
1
ba
|
496
sqft
|
built
1953
1130 N Pennsylvania St, Denver, CO 80203
$-659
Cash flow
-14.1%
Cash-on-Cash Return
3.0%
Cap rate
0.7%
Rent to Value Ratio
Active
$745,000
3
bds
|
4
ba
|
2,025
sqft
|
built
2022
3017 W 53rd Ave, Denver, CO 80221
$-1,701
Cash flow
-11.9%
Cash-on-Cash Return
3.5%
Cap rate
0.5%
Rent to Value Ratio
Active
$484,000
3
bds
|
3
ba
|
1,815
sqft
|
built
2022
5121 N Yampa St, Denver, CO 80249
$-1,068
Cash flow
-11.5%
Cash-on-Cash Return
3.6%
Cap rate
0.6%
Rent to Value Ratio

Active
$715,000
1
bds
|
1
ba
|
1,049
sqft
|
built
2017
4200 W 17th Ave, Denver, CO 80204
$-2,407
Cash flow
-17.6%
Cash-on-Cash Return
2.2%
Cap rate
0.5%
Rent to Value Ratio
Active
$329,000
2
bds
|
2
ba
|
919
sqft
|
built
1982
1301 Speer Blvd, Denver, CO 80204
$-1,349
Cash flow
-21.4%
Cash-on-Cash Return
1.3%
Cap rate
0.6%
Rent to Value Ratio

Active
$335,000
2
bds
|
3
ba
|
1,088
sqft
|
built
2000
8199 Welby Rd, Denver, CO 80229
$-755
Cash flow
-11.8%
Cash-on-Cash Return
3.6%
Cap rate
0.7%
Rent to Value Ratio

Active
$1,050,000
4
bds
|
5
ba
|
3,264
sqft
|
built
2015
2562 S Kendrick St, Denver, CO 80228
$-3,725
Cash flow
-18.5%
Cash-on-Cash Return
2.0%
Cap rate
0.4%
Rent to Value Ratio
Active
$305,000
2
bds
|
2
ba
|
1,170
sqft
|
built
1972
3659 W Union Ave, Denver, CO 80236
$-636
Cash flow
-10.9%
Cash-on-Cash Return
3.8%
Cap rate
0.7%
Rent to Value Ratio