Dunlap, IL Investment Properties for Sale
Browse homes for sale and investment properties in Dunlap, IL. Refine your search by price, property type, or more.
Best cash flowing properties in Dunlap, IL
Active
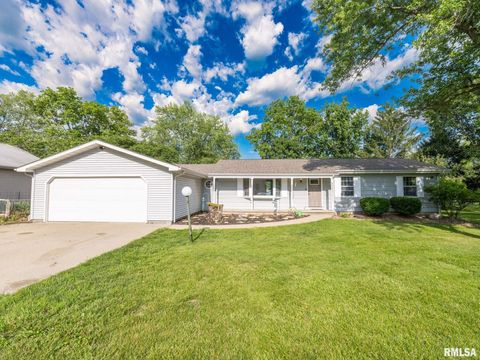
$219,900
3
bds
|
2
ba
|
1,680
sqft
|
built
1977
106 N 5th St, Dunlap, IL 61525
$-55
Cash flow
-1.3%
Cash-on-Cash Return
5.4%
Cap rate
0.8%
Rent to Value Ratio
Active
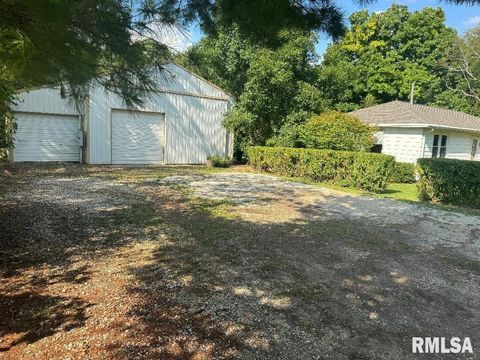
$274,900
3
bds
|
1
ba
|
1,248
sqft
|
built
1955
10800 N Trigger Rd, Dunlap, IL 61525
$-362
Cash flow
-6.9%
Cash-on-Cash Return
4.1%
Cap rate
0.7%
Rent to Value Ratio
12 out of 12 properties for sale in Dunlap, IL
Limited Results Shown
Create a free account, or log in to reveal all property listings and enjoy the complete experience.
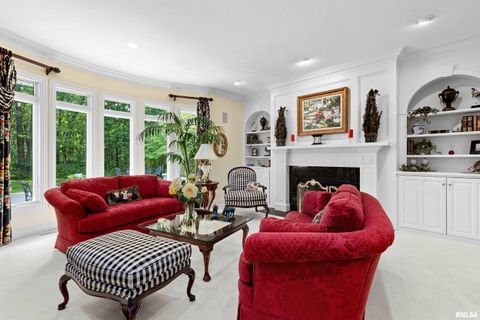
Active
$699,900
5
bds
|
5
ba
|
4,929
sqft
|
built
1994
119 W Greystone Ct, Dunlap, IL 61525
$-2,405
Cash flow
-17.9%
Cash-on-Cash Return
1.6%
Cap rate
0.5%
Rent to Value Ratio
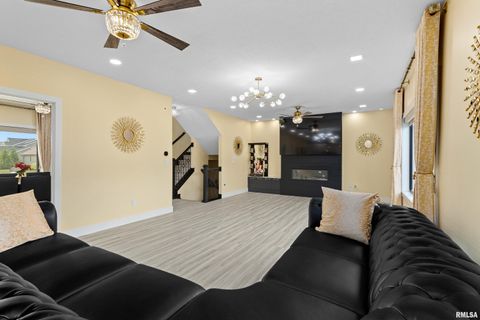
Active
$575,000
5
bds
|
4
ba
|
6,444
sqft
|
built
1986
234 W Windflower Way, Dunlap, IL 61525
$-1,995
Cash flow
-18.1%
Cash-on-Cash Return
1.5%
Cap rate
0.4%
Rent to Value Ratio
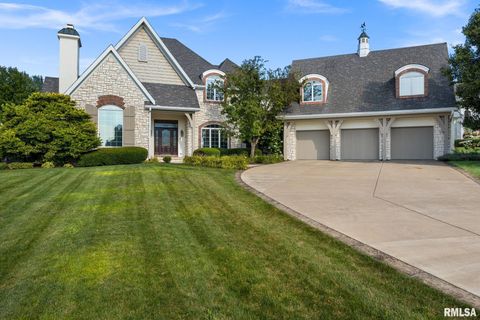
Active
$929,900
4
bds
|
6
ba
|
5,428
sqft
|
built
2001
11518 N Nettle Creek Dr, Dunlap, IL 61525
$-3,973
Cash flow
-22.3%
Cash-on-Cash Return
0.6%
Cap rate
0.3%
Rent to Value Ratio
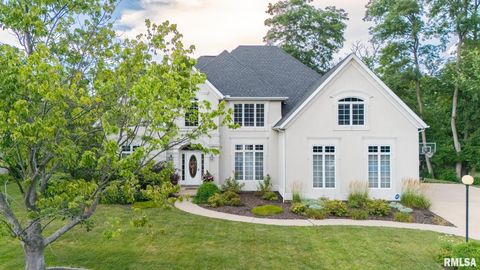
Active
$585,000
5
bds
|
4
ba
|
3,112
sqft
|
built
2022
2817 W Lake Trail Ct, Dunlap, IL 61525
$-1,633
Cash flow
-14.6%
Cash-on-Cash Return
2.3%
Cap rate
0.5%
Rent to Value Ratio

Active
$539,900
5
bds
|
4
ba
|
3,068
sqft
|
built
2021
2821 W Lake Trail Ct, Dunlap, IL 61525
$-1,509
Cash flow
-14.6%
Cash-on-Cash Return
2.3%
Cap rate
0.6%
Rent to Value Ratio
Active
$979,000
5
bds
|
5
ba
|
5,110
sqft
|
built
2003
2233 W Augusta Dr, Dunlap, IL 61525
$-4,720
Cash flow
-25.2%
Cash-on-Cash Return
-0.1%
Cap rate
0.3%
Rent to Value Ratio
Active
$649,900
4
bds
|
5
ba
|
4,547
sqft
|
built
1999
1205 W Poplar Woods Ct, Dunlap, IL 61525
$-2,363
Cash flow
-19.0%
Cash-on-Cash Return
1.3%
Cap rate
0.4%
Rent to Value Ratio
Active
$434,900
4
bds
|
3
ba
|
3,652
sqft
|
built
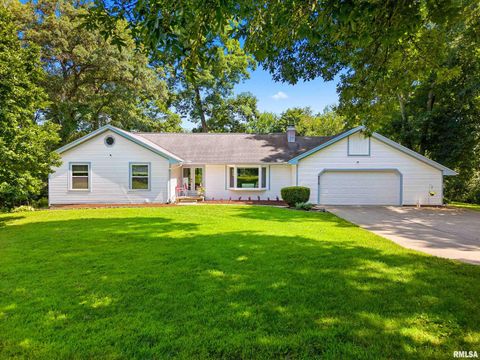
1979
9628 W Brimfield Jubilee Rd, Dunlap, IL 61525
$-962
Cash flow
-11.5%
Cash-on-Cash Return
3.0%
Cap rate
0.6%
Rent to Value Ratio
Active
$750,000
5
bds
|
5
ba
|
4,902
sqft
|
built
1998
5821 W Dickison Cemetery Rd, Dunlap, IL 61525
$-2,815
Cash flow
-19.6%
Cash-on-Cash Return
1.2%
Cap rate
0.3%
Rent to Value Ratio
Active
$574,900
5
bds
|
4
ba
|
4,244
sqft
|
built
1989
11417 N State Route 91, Dunlap, IL 61525
$-1,708
Cash flow
-15.5%
Cash-on-Cash Return
2.1%
Cap rate
0.5%
Rent to Value Ratio