Elgin, IL Investment Properties for Sale
Browse homes for sale and investment properties in Elgin, IL. Refine your search by price, property type, or more.
Best cash flowing properties in Elgin, IL
Active
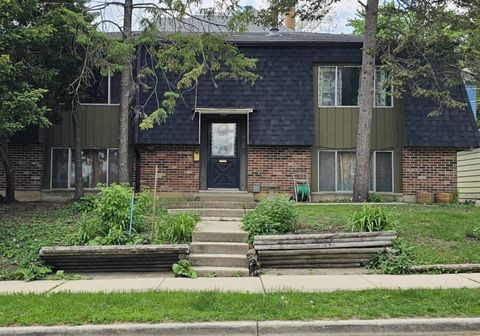
$259,900
4
bds
|
2
ba
|
2,150
sqft
|
built
1968
422 Ryerson Ave, Elgin, IL 60123
$53
Cash flow
1.1%
Cash-on-Cash Return
5.9%
Cap rate
1.0%
Rent to Value Ratio

Active
$443,800
5
bds
|
3
ba
|
3,920
sqft
|
built
1892
600 E Chicago St, Elgin, IL 60120
$2
Cash flow
0.0%
Cash-on-Cash Return
5.7%
Cap rate
0.9%
Rent to Value Ratio
56 out of 94 properties for sale in Elgin, IL
Limited Results Shown
Create a free account, or log in to reveal all property listings and enjoy the complete experience.
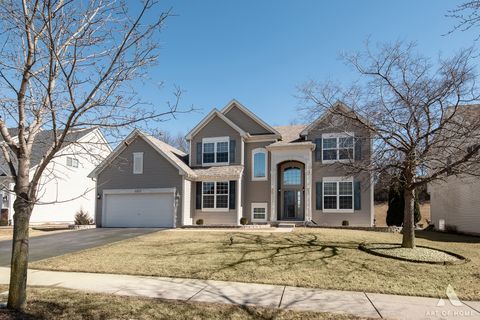
Active
$575,000
4
bds
|
3
ba
|
2,850
sqft
|
built
2006
1007 Biltmore Dr, Elgin, IL 60120
$-1,165
Cash flow
-10.6%
Cash-on-Cash Return
3.2%
Cap rate
0.6%
Rent to Value Ratio

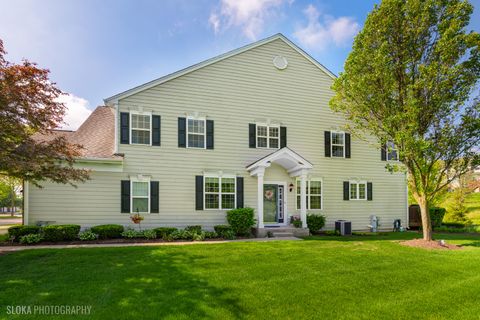
Active
$299,000
2
bds
|
2
ba
|
1,449
sqft
|
built
1993
924 Millcreek Cir, Elgin, IL 60123
$-559
Cash flow
-9.8%
Cash-on-Cash Return
3.4%
Cap rate
0.8%
Rent to Value Ratio

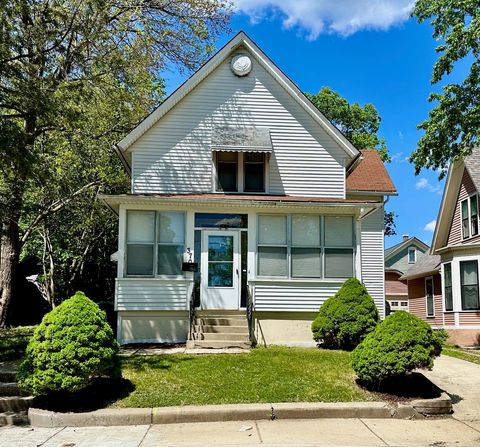
Active
$450,000
3
bds
|
3
ba
|
0
sqft
|
built
1880
422 Locust St, Elgin, IL 60123
$-1,104
Cash flow
-12.8%
Cash-on-Cash Return
2.7%
Cap rate
0.5%
Rent to Value Ratio
Active
$443,800
5
bds
|
3
ba
|
3,920
sqft
|
built
1892
600 E Chicago St, Elgin, IL 60120
$2
Cash flow
0.0%
Cash-on-Cash Return
5.7%
Cap rate
0.9%
Rent to Value Ratio

Active
$265,500
3
bds
|
2
ba
|
2,136
sqft
|
built
1890
484 Hickory Pl, Elgin, IL 60120
$-200
Cash flow
-3.9%
Cash-on-Cash Return
4.8%
Cap rate
0.8%
Rent to Value Ratio
Active
$400,000
3
bds
|
3
ba
|
2,258
sqft
|
built
2007
1110 Pine Valley Ct, Elgin, IL 60124
$-26
Cash flow
-0.3%
Cash-on-Cash Return
5.6%
Cap rate
0.8%
Rent to Value Ratio

Active
$549,900
4
bds
|
3
ba
|
3,246
sqft
|
built
2005
244 Prescott Ave, Elgin, IL 60124
$-1,252
Cash flow
-11.9%
Cash-on-Cash Return
2.9%
Cap rate
0.6%
Rent to Value Ratio
Active
$270,000
4
bds
|
1
ba
|
1,574
sqft
|
built
1900
370 North St, Elgin, IL 60120
$-324
Cash flow
-6.3%
Cash-on-Cash Return
4.2%
Cap rate
0.7%
Rent to Value Ratio

Active
$324,900
3
bds
|
3
ba
|
1,880
sqft
|
built
2007
2441 Emily Ln, Elgin, IL 60124
$-536
Cash flow
-8.6%
Cash-on-Cash Return
3.7%
Cap rate
0.8%
Rent to Value Ratio
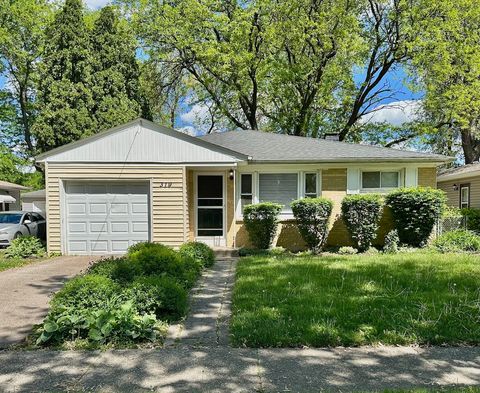
Active
$326,000
3
bds
|
2
ba
|
1,450
sqft
|
built
1961
319 Triggs Ave, Elgin, IL 60123
$-454
Cash flow
-7.3%
Cash-on-Cash Return
4.0%
Cap rate
0.7%
Rent to Value Ratio

Active
$375,000
4
bds
|
3
ba
|
2,200
sqft
|
built
1910
558 N Crystal St, Elgin, IL 60123
$-395
Cash flow
-5.5%
Cash-on-Cash Return
4.4%
Cap rate
0.7%
Rent to Value Ratio

Active
$369,900
3
bds
|
3
ba
|
1,662
sqft
|
built
1993
881 Dandridge Ct, Elgin, IL 60120
$-836
Cash flow
-11.8%
Cash-on-Cash Return
3.0%
Cap rate
0.7%
Rent to Value Ratio

Active
$439,900
3
bds
|
3
ba
|
1,677
sqft
|
built
1996
2855 Weld Rd, Elgin, IL 60124
$-679
Cash flow
-8.1%
Cash-on-Cash Return
3.8%
Cap rate
0.7%
Rent to Value Ratio

Active
$299,000
3
bds
|
2
ba
|
1,154
sqft
|
built
1949
475 S Edison Ave, Elgin, IL 60123
$-332
Cash flow
-5.8%
Cash-on-Cash Return
4.3%
Cap rate
0.7%
Rent to Value Ratio

Active
$300,000
4
bds
|
2
ba
|
0
sqft
|
built
1900
478 Barrett St, Elgin, IL 60120
$-206
Cash flow
-3.6%
Cash-on-Cash Return
4.9%
Cap rate
0.8%
Rent to Value Ratio

Active
$599,000
4
bds
|
3
ba
|
2,897
sqft
|
built
2023
3751 Peregrine Way, Elgin, IL 60124
$-1,688
Cash flow
-14.7%
Cash-on-Cash Return
2.3%
Cap rate
0.6%
Rent to Value Ratio

Active
$285,000
3
bds
|
1
ba
|
1,600
sqft
|
built
1863
552 Walnut Ave, Elgin, IL 60123
$-471
Cash flow
-8.6%
Cash-on-Cash Return
3.7%
Cap rate
0.7%
Rent to Value Ratio

Active
$489,900
6
bds
|
4
ba
|
3,437
sqft
|
built
1878
956 South St, Elgin, IL 60123
$-964
Cash flow
-10.3%
Cash-on-Cash Return
3.3%
Cap rate
0.7%
Rent to Value Ratio

Active
$320,000
3
bds
|
3
ba
|
1,900
sqft
|
built
2004
2503 Emily Ln, Elgin, IL 60124
$-473
Cash flow
-7.7%
Cash-on-Cash Return
3.9%
Cap rate
0.8%
Rent to Value Ratio

Active
$499,000
4
bds
|
3
ba
|
2,750
sqft
|
built
2012
3077 Wickenden Ave, Elgin, IL 60124
$-1,135
Cash flow
-11.9%
Cash-on-Cash Return
2.9%
Cap rate
0.6%
Rent to Value Ratio

Active
$539,900
4
bds
|
3
ba
|
2,952
sqft
|
built
2014
3645 Thornhill Dr, Elgin, IL 60124
$-1,143
Cash flow
-11.0%
Cash-on-Cash Return
3.1%
Cap rate
0.7%
Rent to Value Ratio

Active
$510,000
3
bds
|
3
ba
|
2,470
sqft
|
built
2013
3879 Seigle Dr, Elgin, IL 60124
$-1,382
Cash flow
-14.1%
Cash-on-Cash Return
2.4%
Cap rate
0.6%
Rent to Value Ratio

Active
$560,000
3
bds
|
4
ba
|
3,873
sqft
|
built
1992
2760 Glendower Ter, Elgin, IL 60124
$-1,355
Cash flow
-12.6%
Cash-on-Cash Return
2.8%
Cap rate
0.6%
Rent to Value Ratio

Active
$375,000
3
bds
|
2
ba
|
1,834
sqft
|
built
1930
1310 Larkin Ave, Elgin, IL 60123
$-725
Cash flow
-10.1%
Cash-on-Cash Return
3.4%
Cap rate
0.7%
Rent to Value Ratio

Active
$336,555
3
bds
|
3
ba
|
2,655
sqft
|
built
2005
3116 Taunton St, Elgin, IL 60124
$-603
Cash flow
-9.3%
Cash-on-Cash Return
3.5%
Cap rate
0.8%
Rent to Value Ratio
Active
$289,900
2
bds
|
2
ba
|
837
sqft
|
built
1951
673 Slade Ave, Elgin, IL 60120
$-386
Cash flow
-6.9%
Cash-on-Cash Return
4.1%
Cap rate
0.7%
Rent to Value Ratio
Active
$239,500
3
bds
|
2
ba
|
1,200
sqft
|
built
1920
315 Vandalia St, Elgin, IL 60123
$-204
Cash flow
-4.4%
Cash-on-Cash Return
4.7%
Cap rate
0.8%
Rent to Value Ratio

Active
$599,900
4
bds
|
3
ba
|
3,100
sqft
|
built
2006
879 Oak Ridge Blvd, Elgin, IL 60120
$-1,395
Cash flow
-12.1%
Cash-on-Cash Return
2.9%
Cap rate
0.6%
Rent to Value Ratio

Active
$329,900
3
bds
|
2
ba
|
0
sqft
|
built
1900
558 Franklin Blvd, Elgin, IL 60120
$-413
Cash flow
-6.5%
Cash-on-Cash Return
4.2%
Cap rate
0.7%
Rent to Value Ratio

Active
$565,000
4
bds
|
3
ba
|
2,932
sqft
|
built
2022
752 Kentshire Cir, Elgin, IL 60124
$-1,518
Cash flow
-14.0%
Cash-on-Cash Return
2.5%
Cap rate
0.6%
Rent to Value Ratio

Active
$310,000
2
bds
|
3
ba
|
1,711
sqft
|
built
2001
740 Countryfield Ln, Elgin, IL 60120
$-536
Cash flow
-9.0%
Cash-on-Cash Return
3.6%
Cap rate
0.8%
Rent to Value Ratio

Active
$449,900
4
bds
|
4
ba
|
2,143
sqft
|
built
1991
1070 Hobble Bush Ln, Elgin, IL 60120
$-599
Cash flow
-6.9%
Cash-on-Cash Return
4.1%
Cap rate
0.7%
Rent to Value Ratio

Active
$439,000
4
bds
|
3
ba
|
2,000
sqft
|
built
1989
1010 Hampshire Ln, Elgin, IL 60120
$-650
Cash flow
-7.7%
Cash-on-Cash Return
3.9%
Cap rate
0.7%
Rent to Value Ratio

Active
$499,900
3
bds
|
3
ba
|
2,523
sqft
|
built
2018
166 Morning Glory Way, Elgin, IL 60124
$-1,030
Cash flow
-10.7%
Cash-on-Cash Return
3.2%
Cap rate
0.6%
Rent to Value Ratio
Active
$229,000
2
bds
|
2
ba
|
0
sqft
|
built
1997
1023 Berkshire Ct, Elgin, IL 60120
$-380
Cash flow
-8.7%
Cash-on-Cash Return
3.7%
Cap rate
0.9%
Rent to Value Ratio
Active
$259,900
4
bds
|
2
ba
|
2,150
sqft
|
built
1968
422 Ryerson Ave, Elgin, IL 60123
$53
Cash flow
1.1%
Cash-on-Cash Return
5.9%
Cap rate
1.0%
Rent to Value Ratio
Active
$539,000
4
bds
|
3
ba
|
2,512
sqft
|
built
2006
591 Waterford Rd, Elgin, IL 60124
$-1,316
Cash flow
-12.7%
Cash-on-Cash Return
2.7%
Cap rate
0.6%
Rent to Value Ratio

Active
$299,500
2
bds
|
3
ba
|
1,875
sqft
|
built
2005
179 S Grove Ave, Elgin, IL 60120
$-33
Cash flow
-0.6%
Cash-on-Cash Return
5.5%
Cap rate
1.0%
Rent to Value Ratio
Active
$165,000
2
bds
|
1
ba
|
864
sqft
|
built
1987
764 Terrace Ct, Elgin, IL 60120
$-535
Cash flow
-16.9%
Cash-on-Cash Return
1.8%
Cap rate
1.0%
Rent to Value Ratio
Active
$263,000
2
bds
|
2
ba
|
1,270
sqft
|
built
1995
1373 Grayshire Ct, Elgin, IL 60120
$-316
Cash flow
-6.3%
Cash-on-Cash Return
4.2%
Cap rate
0.9%
Rent to Value Ratio