Englewood, CO Investment Properties for Sale
Browse homes for sale and investment properties in Englewood, CO. Refine your search by price, property type, or more.
Best cash flowing properties in Englewood, CO

Active
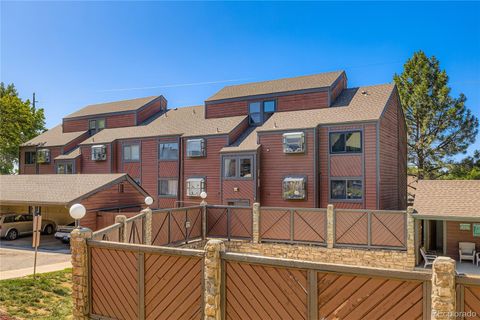
$220,000
1
bds
|
1
ba
|
648
sqft
|
built
1984
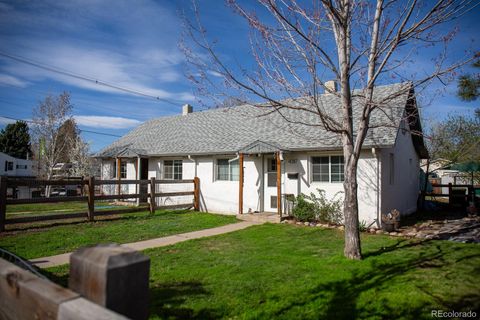
4681 S Decatur St, Englewood, CO 80110
$-390
Cash flow
-9.2%
Cash-on-Cash Return
4.1%
Cap rate
0.7%
Rent to Value Ratio
Active
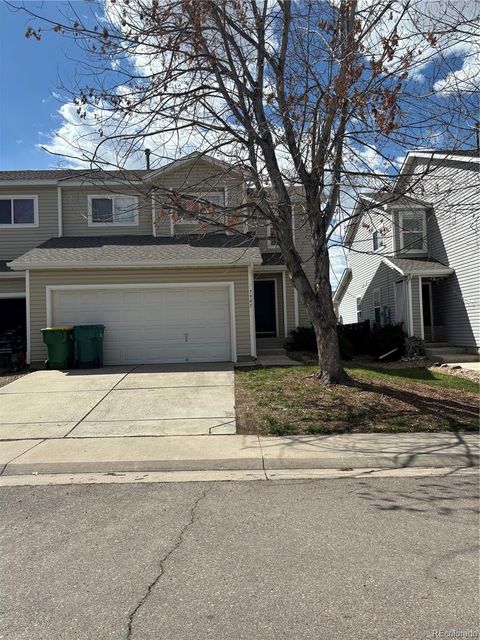
$299,000
3
bds
|
1
ba
|
1,004
sqft
|
built
1982
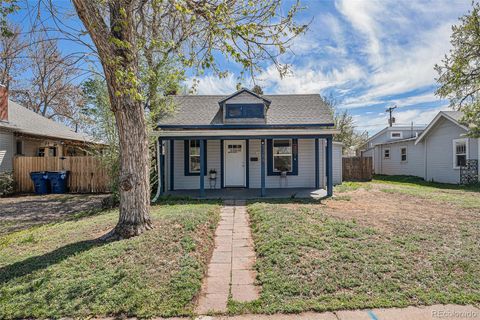
303 W Lehow Ave, Englewood, CO 80110
$-514
Cash flow
-9.0%
Cash-on-Cash Return
4.2%
Cap rate
0.7%
Rent to Value Ratio
167 out of 191 properties for sale in Englewood, CO
Limited Results Shown
Create a free account, or log in to reveal all property listings and enjoy the complete experience.

Active
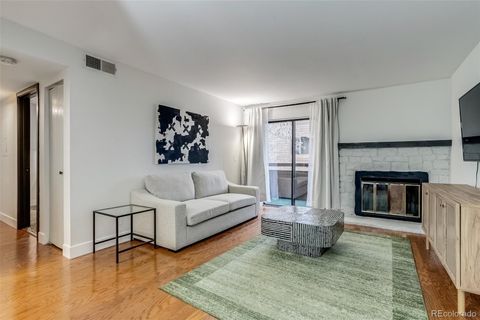
$290,000
1
bds
|
1
ba
|
702
sqft
|
built
1994
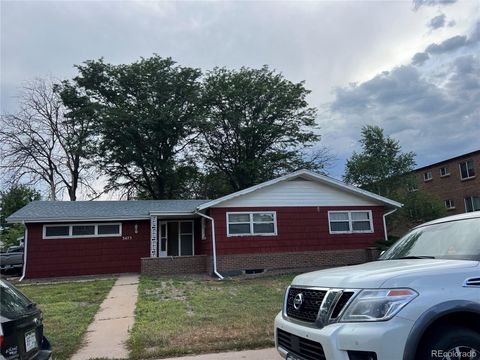
8621 E Dry Creek Rd, Englewood, CO 80112
$-905
Cash flow
-16.3%
Cash-on-Cash Return
2.5%
Cap rate
0.6%
Rent to Value Ratio
Active
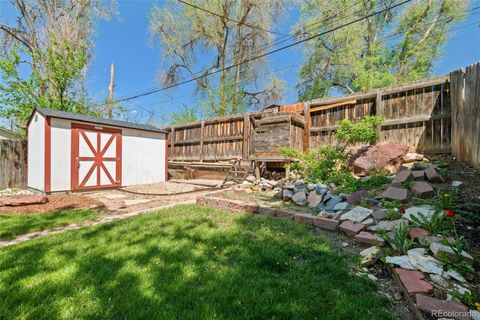
$472,900
3
bds
|
3
ba
|
1,599
sqft
|
built
2000
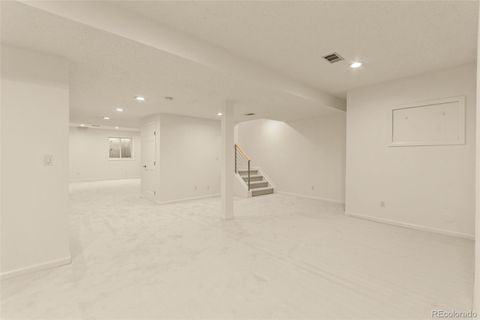
7945 S Kittredge St, Englewood, CO 80112
$-1,077
Cash flow
-11.9%
Cash-on-Cash Return
3.5%
Cap rate
0.5%
Rent to Value Ratio

Active
$500,000
3
bds
|
1
ba
|
884
sqft
|
built
1925
4476 S Lincoln St, Englewood, CO 80113
$-1,100
Cash flow
-11.5%
Cash-on-Cash Return
3.6%
Cap rate
0.5%
Rent to Value Ratio

Active
$1,242,000
5
bds
|
4
ba
|
4,190
sqft
|
built
1981
6062 S Emporia Cir, Englewood, CO 80111
$-4,172
Cash flow
-17.5%
Cash-on-Cash Return
2.2%
Cap rate
0.4%
Rent to Value Ratio

Active
$2,290,000
5
bds
|
4
ba
|
3,886
sqft
|
built
1969
5880 S Happy Canyon Dr, Englewood, CO 80111
$-8,950
Cash flow
-20.4%
Cash-on-Cash Return
1.6%
Cap rate
0.2%
Rent to Value Ratio

Active
$540,000
2
bds
|
4
ba
|
1,728
sqft
|
built
1986
2060 W Iliff Ave, Englewood, CO 80110
$-1,308
Cash flow
-12.6%
Cash-on-Cash Return
3.4%
Cap rate
0.5%
Rent to Value Ratio

Active
$450,000
2
bds
|
2
ba
|
1,255
sqft
|
built
2015
301 Inverness Way S, Englewood, CO 80112
$-1,217
Cash flow
-14.1%
Cash-on-Cash Return
3.0%
Cap rate
0.6%
Rent to Value Ratio

Active
$1,999,998
8
bds
|
7
ba
|
6,088
sqft
|
built
2022
4960 S Lipan Dr, Englewood, CO 80110
$-4,332
Cash flow
-11.3%
Cash-on-Cash Return
3.7%
Cap rate
0.5%
Rent to Value Ratio

Active
$359,900
1
bds
|
1
ba
|
1,023
sqft
|
built
2009
307 Inverness Way S, Englewood, CO 80112
$-982
Cash flow
-14.2%
Cash-on-Cash Return
3.0%
Cap rate
0.6%
Rent to Value Ratio
Active
$248,000
1
bds
|
1
ba
|
648
sqft
|
built
1984
4671 S Decatur St, Englewood, CO 80110
$-612
Cash flow
-12.9%
Cash-on-Cash Return
3.3%
Cap rate
0.6%
Rent to Value Ratio
Active
$567,000
2
bds
|
2
ba
|
978
sqft
|
built
1902
3024 S Sherman St, Englewood, CO 80113
$-1,159
Cash flow
-10.7%
Cash-on-Cash Return
3.8%
Cap rate
0.5%
Rent to Value Ratio

Active
$739,000
5
bds
|
3
ba
|
2,016
sqft
|
built
1963
4350 S Delaware St, Englewood, CO 80110
$-2,257
Cash flow
-15.9%
Cash-on-Cash Return
2.6%
Cap rate
0.4%
Rent to Value Ratio

Active
$1,750,000
4
bds
|
3
ba
|
2,886
sqft
|
built
1967
4011 S Ivy Ln, Englewood, CO 80111
$-6,639
Cash flow
-19.8%
Cash-on-Cash Return
1.7%
Cap rate
0.3%
Rent to Value Ratio

Active
$475,000
3
bds
|
1
ba
|
1,140
sqft
|
built
1964
4163 S Decatur St, Englewood, CO 80110
$-947
Cash flow
-10.4%
Cash-on-Cash Return
3.9%
Cap rate
0.5%
Rent to Value Ratio

Active
$670,000
5
bds
|
3
ba
|
2,468
sqft
|
built
1959
4643 S Cherokee St, Englewood, CO 80110
$-1,264
Cash flow
-9.8%
Cash-on-Cash Return
4.0%
Cap rate
0.5%
Rent to Value Ratio
Active
$1,350,000
8
bds
|
4
ba
|
3,308
sqft
|
built
1931
4087 S Clarkson St, Englewood, CO 80113
$-6,286
Cash flow
-24.3%
Cash-on-Cash Return
0.7%
Cap rate
0.1%
Rent to Value Ratio

Active
$4,800,000
5
bds
|
6
ba
|
6,507
sqft
|
built
1977
4181 S Colorado Blvd, Englewood, CO 80113
$-22,176
Cash flow
-24.1%
Cash-on-Cash Return
0.7%
Cap rate
0.1%
Rent to Value Ratio
Active
$455,000
2
bds
|
1
ba
|
1,260
sqft
|
built
1915
3768 S Acoma St, Englewood, CO 80110
$-829
Cash flow
-9.5%
Cash-on-Cash Return
4.1%
Cap rate
0.5%
Rent to Value Ratio

Active
$1,894,000
5
bds
|
5
ba
|
5,953
sqft
|
built
1985
5227 S Geneva St, Englewood, CO 80111
$-7,505
Cash flow
-20.7%
Cash-on-Cash Return
1.5%
Cap rate
0.3%
Rent to Value Ratio

Active
$500,000
2
bds
|
1
ba
|
934
sqft
|
built
1931
3798 S Grant St, Englewood, CO 80113
$-1,276
Cash flow
-13.3%
Cash-on-Cash Return
3.2%
Cap rate
0.4%
Rent to Value Ratio

Active
$681,000
2
bds
|
2
ba
|
1,540
sqft
|
built
1963
2900 S Downing St, Englewood, CO 80113
$-1,717
Cash flow
-13.2%
Cash-on-Cash Return
3.2%
Cap rate
0.5%
Rent to Value Ratio
Active
$899,000
5
bds
|
2
ba
|
2,307
sqft
|
built
1960
3475 S Marion St, Englewood, CO 80113
$-2,952
Cash flow
-17.1%
Cash-on-Cash Return
2.3%
Cap rate
0.3%
Rent to Value Ratio

Active
$489,000
2
bds
|
2
ba
|
961
sqft
|
built
2020
3500 S Corona St, Englewood, CO 80113
$-1,425
Cash flow
-15.2%
Cash-on-Cash Return
2.8%
Cap rate
0.5%
Rent to Value Ratio
Active
$2,050,000
5
bds
|
5
ba
|
5,121
sqft
|
built
1985
10293 E Sheri Ln, Englewood, CO 80111
$-8,256
Cash flow
-21.0%
Cash-on-Cash Return
1.4%
Cap rate
0.2%
Rent to Value Ratio

Active
$400,000
3
bds
|
2
ba
|
1,240
sqft
|
built
2001
7822 S Kittredge Cir, Englewood, CO 80112
$-1,066
Cash flow
-13.9%
Cash-on-Cash Return
3.1%
Cap rate
0.6%
Rent to Value Ratio

Active
$899,000
4
bds
|
3
ba
|
2,824
sqft
|
built
1974
5616 S Kenton Ct, Englewood, CO 80111
$-2,718
Cash flow
-15.8%
Cash-on-Cash Return
2.6%
Cap rate
0.4%
Rent to Value Ratio

Active
$524,904
4
bds
|
2
ba
|
1,351
sqft
|
built
1950
2332 W Baltic Pl, Englewood, CO 80110
$-895
Cash flow
-8.9%
Cash-on-Cash Return
4.2%
Cap rate
0.6%
Rent to Value Ratio

Active
$695,000
3
bds
|
0
ba
|
0
sqft
|
built
1985
2000 W Iliff Ave, Englewood, CO 80110
$-1,654
Cash flow
-12.4%
Cash-on-Cash Return
3.4%
Cap rate
0.5%
Rent to Value Ratio

Active
$599,950
3
bds
|
2
ba
|
1,856
sqft
|
built
1947
4546 S Logan St, Englewood, CO 80113
$-1,596
Cash flow
-13.9%
Cash-on-Cash Return
3.1%
Cap rate
0.4%
Rent to Value Ratio
Active
$859,000
4
bds
|
4
ba
|
2,585
sqft
|
built
1979
10724 E Maplewood Pl, Englewood, CO 80111
$-2,553
Cash flow
-15.5%
Cash-on-Cash Return
2.7%
Cap rate
0.4%
Rent to Value Ratio

Active
$835,000
5
bds
|
3
ba
|
3,136
sqft
|
built
1971
4601 S Lipan St, Englewood, CO 80110
$-1,497
Cash flow
-9.4%
Cash-on-Cash Return
4.1%
Cap rate
0.5%
Rent to Value Ratio
Active
$542,000
3
bds
|
1
ba
|
1,632
sqft
|
built
1902
1111 E Dartmouth Ave, Englewood, CO 80113
$-816
Cash flow
-7.9%
Cash-on-Cash Return
4.5%
Cap rate
0.6%
Rent to Value Ratio

Active
$680,000
3
bds
|
2
ba
|
1,388
sqft
|
built
1993
3100 S Corona St, Englewood, CO 80113
$-1,646
Cash flow
-12.6%
Cash-on-Cash Return
3.4%
Cap rate
0.5%
Rent to Value Ratio

Active
$8,650,000
5
bds
|
9
ba
|
12,356
sqft
|
built
1997
5 Churchill Dr, Englewood, CO 80113
$-42,474
Cash flow
-25.6%
Cash-on-Cash Return
0.4%
Cap rate
0.1%
Rent to Value Ratio

Active
$440,000
2
bds
|
1
ba
|
764
sqft
|
built
1943
3265 S Ogden St, Englewood, CO 80113
$-764
Cash flow
-9.1%
Cash-on-Cash Return
4.2%
Cap rate
0.6%
Rent to Value Ratio

Active
$850,000
4
bds
|
3
ba
|
2,917
sqft
|
built
1976
11035 E Berry Ave, Englewood, CO 80111
$-2,393
Cash flow
-14.7%
Cash-on-Cash Return
2.9%
Cap rate
0.4%
Rent to Value Ratio

Active
$3,250,000
6
bds
|
7
ba
|
6,396
sqft
|
built
1981
7 Cherry Hills Farm Dr, Englewood, CO 80113
$-14,928
Cash flow
-24.0%
Cash-on-Cash Return
0.8%
Cap rate
0.2%
Rent to Value Ratio
Active
$648,888
4
bds
|
2
ba
|
1,813
sqft
|
built
1910
3311 S Logan St, Englewood, CO 80113
$-1,898
Cash flow
-15.3%
Cash-on-Cash Return
2.8%
Cap rate
0.4%
Rent to Value Ratio