Citrus County Investment Properties for Sale
Browse homes for sale and investment properties in Citrus County. Refine your search by price, property type, or more.
Best cash flowing properties in Citrus County
Active
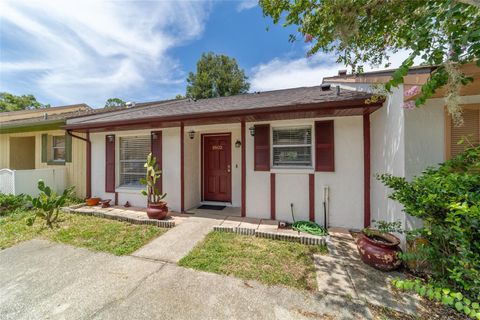
$177,500
2
bds
|
2
ba
|
1,051
sqft
|
built
1987
1802 Silverwood St, Inverness, FL 34453
$-1
Cash flow
0.0%
Cash-on-Cash Return
6.1%
Cap rate
0.8%
Rent to Value Ratio
Active
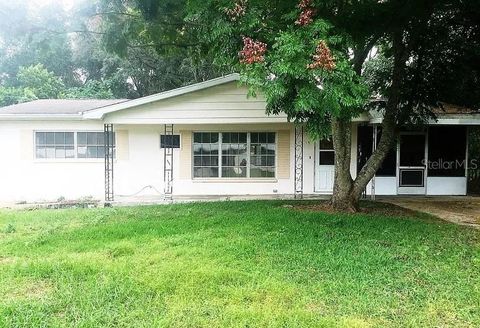
$184,500
2
bds
|
1
ba
|
1,201
sqft
|
built
1964
5 S Washington St, Beverly Hills, FL 34465
$-45
Cash flow
-1.3%
Cash-on-Cash Return
5.9%
Cap rate
0.8%
Rent to Value Ratio
328 out of 390 properties for sale in Citrus County
Limited Results Shown
Create a free account, or log in to reveal all property listings and enjoy the complete experience.
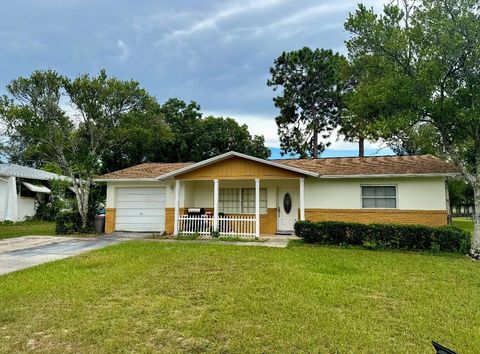
Active
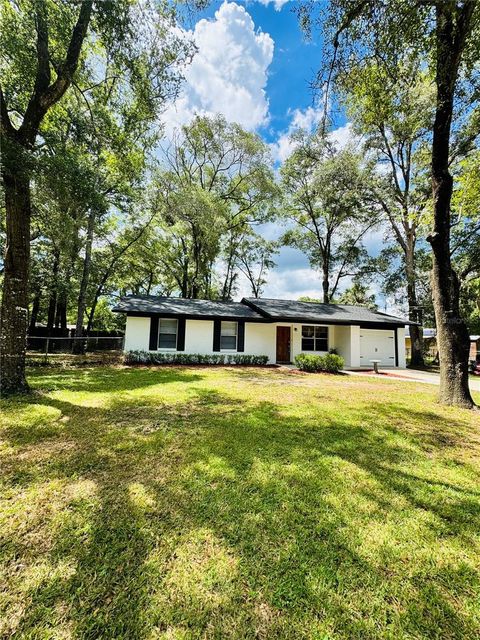
$179,900
3
bds
|
2
ba
|
1,380
sqft
|
built
1985
11820 N Par Ter, Dunnellon, FL 34434
$-108
Cash flow
-3.1%
Cash-on-Cash Return
5.4%
Cap rate
0.8%
Rent to Value Ratio
Active
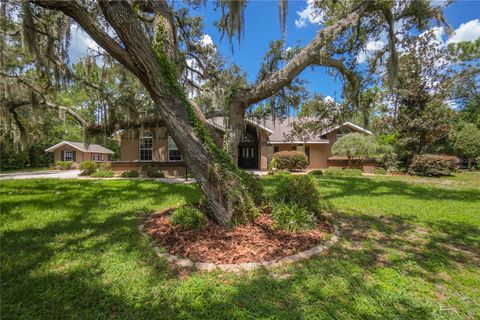
$650,000
5
bds
|
4
ba
|
3,654
sqft
|
built
1989
5540 N Rosedale Cir, Beverly Hills, FL 34465
$-1,474
Cash flow
-11.8%
Cash-on-Cash Return
3.4%
Cap rate
0.6%
Rent to Value Ratio
Active
$425,000
4
bds
|
2
ba
|
2,562
sqft
|
built
1999
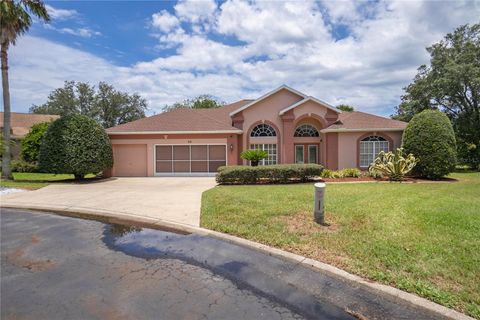
30 N Aspen Pt, Lecanto, FL 34461
$-659
Cash flow
-8.1%
Cash-on-Cash Return
4.3%
Cap rate
0.6%
Rent to Value Ratio
Active
$839,500
3
bds
|
5
ba
|
3,275
sqft
|
built
2007
671 N Rockingham Pt, Inverness, FL 34453
$-2,499
Cash flow
-15.5%
Cash-on-Cash Return
2.6%
Cap rate
0.4%
Rent to Value Ratio
Active
$279,900
3
bds
|
2
ba
|
1,720
sqft
|
built
2004
1826 W Shanelle Path, Lecanto, FL 34461
$-422
Cash flow
-7.9%
Cash-on-Cash Return
4.3%
Cap rate
0.8%
Rent to Value Ratio
Active
$212,043
2
bds
|
2
ba
|
912
sqft
|
built
1981
6 Montana St, Beverly Hills, FL 34465
$-163
Cash flow
-4.0%
Cash-on-Cash Return
5.2%
Cap rate
0.8%
Rent to Value Ratio
Active
$256,000
3
bds
|
3
ba
|
1,663
sqft
|
built
2005
1679 W Spring Meadow Loop, Lecanto, FL 34461
$-309
Cash flow
-6.3%
Cash-on-Cash Return
4.7%
Cap rate
0.9%
Rent to Value Ratio
Active
$3,995,000
4
bds
|
4
ba
|
2,720
sqft
|
built
2023
1825 W Oak Valley Ct, Homosassa, FL 34446
$-18,786
Cash flow
-24.5%
Cash-on-Cash Return
0.5%
Cap rate
0.1%
Rent to Value Ratio
Active
$1,275,000
3
bds
|
3
ba
|
2,989
sqft
|
built
2022
3937 W Shadow Creek Loop, Lecanto, FL 34461
$-5,015
Cash flow
-20.5%
Cash-on-Cash Return
1.4%
Cap rate
0.3%
Rent to Value Ratio
Active
$299,000
3
bds
|
2
ba
|
1,235
sqft
|
built
1990
1001 Jones Ave, Inverness, FL 34453
$-753
Cash flow
-13.1%
Cash-on-Cash Return
3.1%
Cap rate
0.5%
Rent to Value Ratio

Active
$194,990
2
bds
|
1
ba
|
1,224
sqft
|
built
1968
26 S Osceola St, Beverly Hills, FL 34465
$-53
Cash flow
-1.4%
Cash-on-Cash Return
5.8%
Cap rate
0.7%
Rent to Value Ratio
Active
$399,000
3
bds
|
2
ba
|
2,021
sqft
|
built
1965
3896 N Seminole Pt, Crystal River, FL 34428
$-666
Cash flow
-8.7%
Cash-on-Cash Return
4.1%
Cap rate
0.5%
Rent to Value Ratio
Active
$345,000
3
bds
|
2
ba
|
1,803
sqft
|
built
1979
4030 N Sun Dance Pt, Crystal River, FL 34428
$-517
Cash flow
-7.8%
Cash-on-Cash Return
4.3%
Cap rate
0.6%
Rent to Value Ratio
Active
$399,900
3
bds
|
2
ba
|
1,846
sqft
|
built
2005
8525 N Spartan Dr, Citrus Springs, FL 34433
$-922
Cash flow
-12.0%
Cash-on-Cash Return
3.4%
Cap rate
0.5%
Rent to Value Ratio
Active
$367,500
2
bds
|
1
ba
|
864
sqft
|
built
2005
10464 W Oliver St, Homosassa, FL 34448
$-891
Cash flow
-12.6%
Cash-on-Cash Return
3.2%
Cap rate
0.5%
Rent to Value Ratio
Active
$285,000
3
bds
|
2
ba
|
1,575
sqft
|
built
1965
9415 W Green Bay Ln, Crystal River, FL 34428
$-206
Cash flow
-3.8%
Cash-on-Cash Return
5.3%
Cap rate
0.7%
Rent to Value Ratio
Active
$245,000
2
bds
|
2
ba
|
1,040
sqft
|
built
1985
5235 S Romans Ave, Inverness, FL 34452
$-413
Cash flow
-8.8%
Cash-on-Cash Return
4.1%
Cap rate
0.6%
Rent to Value Ratio
Active
$575,000
3
bds
|
2
ba
|
1,482
sqft
|
built
1992
5947 S Shadytree Path, Homosassa, FL 34448
$-820
Cash flow
-7.4%
Cash-on-Cash Return
4.4%
Cap rate
0.5%
Rent to Value Ratio
Active
$268,000
3
bds
|
2
ba
|
1,644
sqft
|
built
1988
8384 N Trojan Dr, Citrus Springs, FL 34433
$-185
Cash flow
-3.6%
Cash-on-Cash Return
5.3%
Cap rate
0.7%
Rent to Value Ratio
Active
$599,900
4
bds
|
4
ba
|
3,587
sqft
|
built
1989
1087 N Sloan Ter, Lecanto, FL 34461
$-1,461
Cash flow
-12.7%
Cash-on-Cash Return
3.2%
Cap rate
0.5%
Rent to Value Ratio
Active
$325,000
5
bds
|
3
ba
|
2,265
sqft
|
built
2022
8416 N Sussex Dr, Citrus Springs, FL 34434
$-621
Cash flow
-10.0%
Cash-on-Cash Return
3.9%
Cap rate
0.6%
Rent to Value Ratio
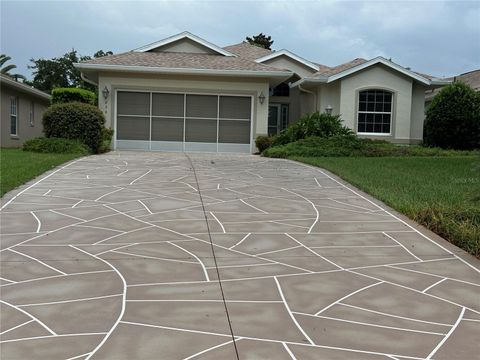
Active
$317,750
3
bds
|
2
ba
|
1,968
sqft
|
built
2005
8342 W Cecil Ln, Homosassa, FL 34446
$-306
Cash flow
-5.0%
Cash-on-Cash Return
5.0%
Cap rate
0.7%
Rent to Value Ratio
Active
$265,000
2
bds
|
2
ba
|
980
sqft
|
built
1984
5409 S Marsha Ter, Homosassa, FL 34446
$-336
Cash flow
-6.6%
Cash-on-Cash Return
4.6%
Cap rate
0.6%
Rent to Value Ratio
Active
$359,000
3
bds
|
2
ba
|
1,734
sqft
|
built
1967
3930 N Seminole Pt, Crystal River, FL 34428
$-585
Cash flow
-8.5%
Cash-on-Cash Return
4.2%
Cap rate
0.6%
Rent to Value Ratio
Active
$745,000
4
bds
|
4
ba
|
3,562
sqft
|
built
2000
10264 W Springtree Ln, Crystal River, FL 34428
$-1,559
Cash flow
-10.9%
Cash-on-Cash Return
3.6%
Cap rate
0.5%
Rent to Value Ratio
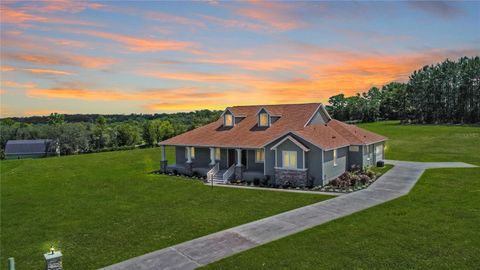
Active
$539,900
4
bds
|
3
ba
|
3,030
sqft
|
built
2023
92 Grass St, Homosassa, FL 34446
$-851
Cash flow
-8.2%
Cash-on-Cash Return
4.3%
Cap rate
0.6%
Rent to Value Ratio
Active
$165,000
2
bds
|
2
ba
|
990
sqft
|
built
1984
219 E Hartford St, Hernando, FL 34442
$-139
Cash flow
-4.4%
Cash-on-Cash Return
5.1%
Cap rate
1.2%
Rent to Value Ratio
Active
$235,000
3
bds
|
2
ba
|
1,353
sqft
|
built
2006
4002 E Beck St, Inverness, FL 34453
$-225
Cash flow
-5.0%
Cash-on-Cash Return
5.0%
Cap rate
0.7%
Rent to Value Ratio
Active
$350,000
3
bds
|
2
ba
|
2,280
sqft
|
built
1983
3203 S Skyline Dr, Inverness, FL 34450
$-695
Cash flow
-10.4%
Cash-on-Cash Return
3.8%
Cap rate
0.6%
Rent to Value Ratio
Active
$665,900
3
bds
|
2
ba
|
2,518
sqft
|
built
2020
760 N Hunt Club Dr, Hernando, FL 34442
$-2,602
Cash flow
-20.4%
Cash-on-Cash Return
1.5%
Cap rate
0.4%
Rent to Value Ratio
Active
$250,000
2
bds
|
1
ba
|
1,076
sqft
|
built
1973
516 S Tuck Pt, Inverness, FL 34450
$-237
Cash flow
-4.9%
Cash-on-Cash Return
5.0%
Cap rate
0.7%
Rent to Value Ratio
Active
$1,350,000
4
bds
|
3
ba
|
3,529
sqft
|
built
1978
827 SW Kings Bay Dr, Crystal River, FL 34429
$-5,438
Cash flow
-21.0%
Cash-on-Cash Return
1.3%
Cap rate
0.3%
Rent to Value Ratio
Active
$695,000
3
bds
|
2
ba
|
2,204
sqft
|
built
1986
3207 E Withlacoochee Trl, Dunnellon, FL 34434
$-2,401
Cash flow
-18.0%
Cash-on-Cash Return
2.0%
Cap rate
0.3%
Rent to Value Ratio
Active
$310,000
2
bds
|
2
ba
|
1,106
sqft
|
built
1976
1220 Mossy Oak Dr, Inverness, FL 34450
$-70
Cash flow
-1.2%
Cash-on-Cash Return
5.9%
Cap rate
0.7%
Rent to Value Ratio
Active
$225,000
3
bds
|
2
ba
|
1,584
sqft
|
built
1974
8460 N Ira Martin Ave, Crystal River, FL 34428
$-382
Cash flow
-8.9%
Cash-on-Cash Return
4.1%
Cap rate
0.6%
Rent to Value Ratio
Active
$225,000
3
bds
|
2
ba
|
1,133
sqft
|
built
1973
5060 E Backner Ln, Inverness, FL 34452
$-226
Cash flow
-5.2%
Cash-on-Cash Return
4.9%
Cap rate
0.6%
Rent to Value Ratio
Active
$410,000
3
bds
|
2
ba
|
1,720
sqft
|
built
2005
711 W Wheeling Ln, Hernando, FL 34442
$-673
Cash flow
-8.6%
Cash-on-Cash Return
4.2%
Cap rate
0.6%
Rent to Value Ratio
Active
$350,000
2
bds
|
2
ba
|
1,146
sqft
|
built
1976
10090 S Riviera Pt, Homosassa, FL 34448
$-684
Cash flow
-10.2%
Cash-on-Cash Return
3.8%
Cap rate
0.5%
Rent to Value Ratio