Marion County Investment Properties for Sale
Browse homes for sale and investment properties in Marion County. Refine your search by price, property type, or more.
Best cash flowing properties in Marion County
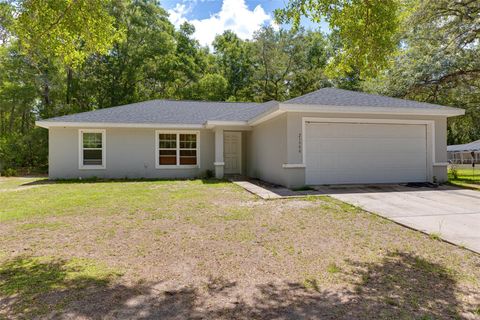
Active
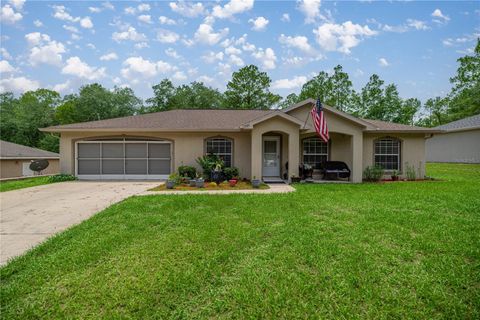
$205,000
3
bds
|
2
ba
|
1,377
sqft
|
built
2007
1500 SW 153rd Ct, Ocala, FL 34481
$29
Cash flow
0.7%
Cash-on-Cash Return
6.3%
Cap rate
0.8%
Rent to Value Ratio
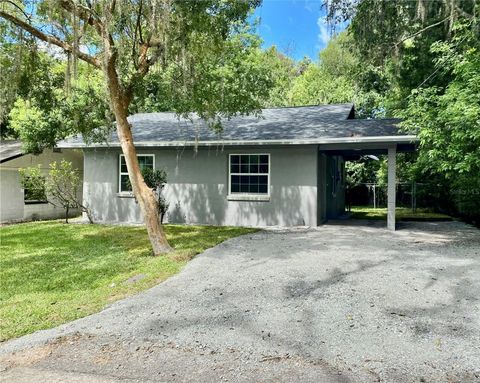
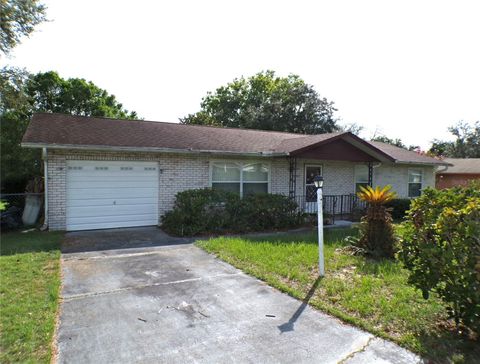
Active
$175,000
2
bds
|
1
ba
|
786
sqft
|
built
1957
430 NE 9th Ave, Ocala, FL 34470
$-8
Cash flow
-0.2%
Cash-on-Cash Return
6.1%
Cap rate
0.8%
Rent to Value Ratio
592 out of 811 properties for sale in Marion County
Limited Results Shown
Create a free account, or log in to reveal all property listings and enjoy the complete experience.
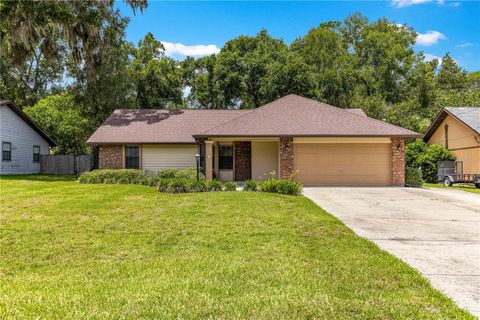
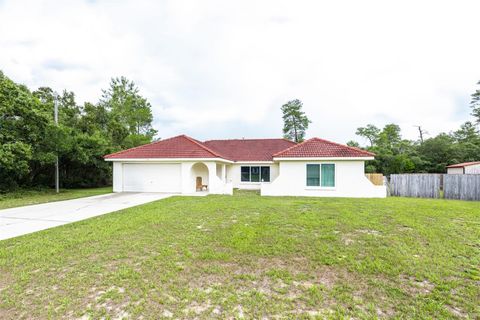
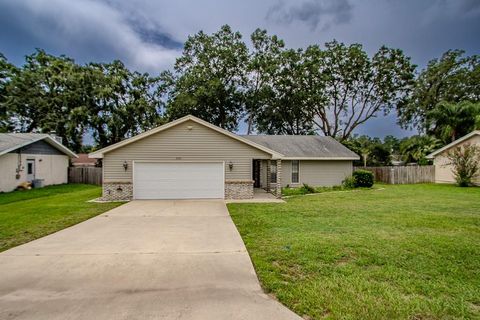
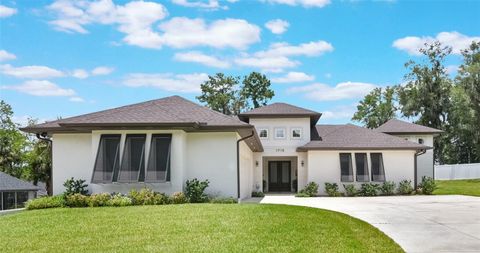
Active
$322,900
3
bds
|
2
ba
|
2,010
sqft
|
built
1987
4944 SE 40th Ter, Ocala, FL 34480
$-301
Cash flow
-4.9%
Cash-on-Cash Return
5.0%
Cap rate
0.7%
Rent to Value Ratio

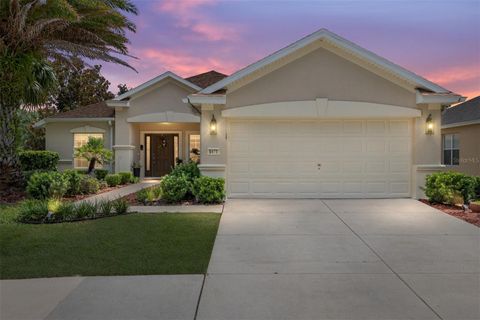
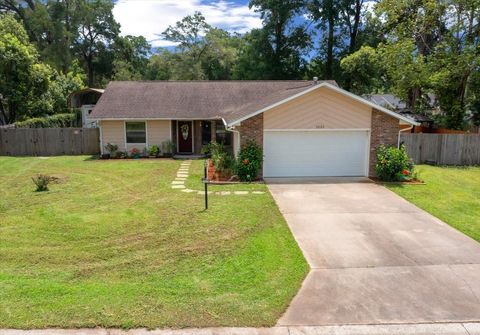
Active
$122,000
1
bds
|
1
ba
|
672
sqft
|
built
1973
2418 NE 7th St, Ocala, FL 34470
$-157
Cash flow
-6.7%
Cash-on-Cash Return
4.6%
Cap rate
0.9%
Rent to Value Ratio
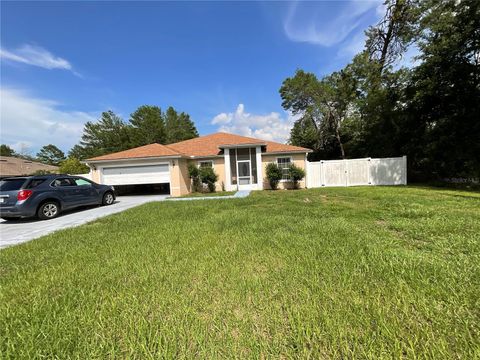
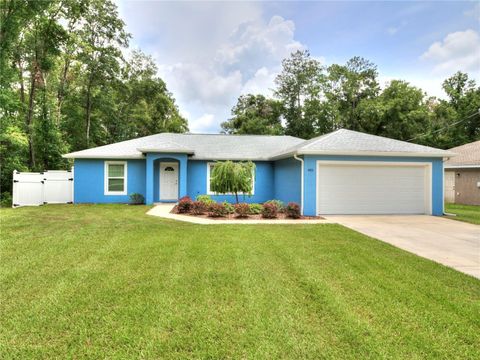
Active
$329,000
4
bds
|
2
ba
|
2,185
sqft
|
built
2006
5471 SW 40th St, Ocala, FL 34474
$-558
Cash flow
-8.8%
Cash-on-Cash Return
4.1%
Cap rate
0.7%
Rent to Value Ratio
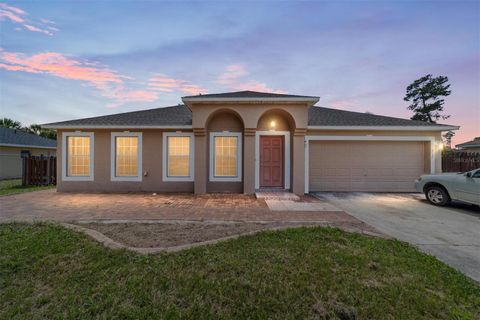
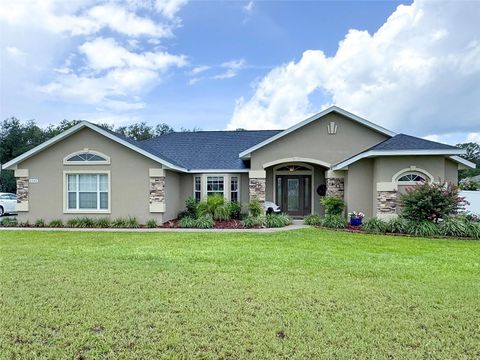
Active
$459,900
3
bds
|
2
ba
|
2,178
sqft
|
built
1996
3663 SE 45th Pl, Ocala, FL 34480
$-883
Cash flow
-10.0%
Cash-on-Cash Return
3.8%
Cap rate
0.5%
Rent to Value Ratio
Active
$315,000
4
bds
|
2
ba
|
1,665
sqft
|
built
1991
34 Pine Crse, Ocala, FL 34472
$-495
Cash flow
-8.2%
Cash-on-Cash Return
4.3%
Cap rate
0.6%
Rent to Value Ratio
Active
$199,000
3
bds
|
2
ba
|
1,364
sqft
|
built
1963
14750 NW 42nd Ct, Reddick, FL 32686
$-123
Cash flow
-3.2%
Cash-on-Cash Return
5.4%
Cap rate
0.7%
Rent to Value Ratio
Active
$379,000
4
bds
|
2
ba
|
2,421
sqft
|
built
2005
6470 SW 51st Ter, Ocala, FL 34474
$-604
Cash flow
-8.3%
Cash-on-Cash Return
4.2%
Cap rate
0.7%
Rent to Value Ratio
Active
$525,000
3
bds
|
2
ba
|
1,611
sqft
|
built
2003
7685 SE 135th St, Summerfield, FL 34491
$-1,222
Cash flow
-12.1%
Cash-on-Cash Return
3.4%
Cap rate
0.5%
Rent to Value Ratio

Active
$299,900
3
bds
|
2
ba
|
1,794
sqft
|
built
1977
5401 SE 2nd St, Ocala, FL 34480
$-412
Cash flow
-7.2%
Cash-on-Cash Return
4.5%
Cap rate
0.6%
Rent to Value Ratio
Active
$129,800
2
bds
|
1
ba
|
891
sqft
|
built
1971
2564 SE 15th Ave, Ocala, FL 34471
$-160
Cash flow
-6.4%
Cash-on-Cash Return
4.7%
Cap rate
1.0%
Rent to Value Ratio
Active
$995,000
3
bds
|
4
ba
|
3,467
sqft
|
built
2006
5795 SW 43rd Pl, Ocala, FL 34474
$-3,124
Cash flow
-16.4%
Cash-on-Cash Return
2.4%
Cap rate
0.4%
Rent to Value Ratio
Active
$328,800
4
bds
|
2
ba
|
1,860
sqft
|
built
2006
18 Sunrise Dr, Ocala, FL 34472
$-734
Cash flow
-11.6%
Cash-on-Cash Return
3.5%
Cap rate
0.5%
Rent to Value Ratio
Active
$299,900
3
bds
|
2
ba
|
1,393
sqft
|
built
2021
21900 SW 83rd Loop, Dunnellon, FL 34431
$-638
Cash flow
-11.1%
Cash-on-Cash Return
3.6%
Cap rate
0.6%
Rent to Value Ratio
Active
$399,000
4
bds
|
3
ba
|
2,127
sqft
|
built
1998
17179 SW 41st Cir, Ocala, FL 34473
$-1,013
Cash flow
-13.2%
Cash-on-Cash Return
3.1%
Cap rate
0.5%
Rent to Value Ratio
Active
$295,000
3
bds
|
2
ba
|
1,890
sqft
|
built
2006
12917 SW 38th Cir, Ocala, FL 34473
$-310
Cash flow
-5.5%
Cash-on-Cash Return
4.9%
Cap rate
0.7%
Rent to Value Ratio
Active
$350,000
3
bds
|
2
ba
|
1,941
sqft
|
built
2008
522 Marion Oaks Ln, Ocala, FL 34473
$-877
Cash flow
-13.1%
Cash-on-Cash Return
3.1%
Cap rate
0.5%
Rent to Value Ratio
Active
$198,000
3
bds
|
2
ba
|
1,248
sqft
|
built
1980
35 Palm Rd, Ocala, FL 34472
$-189
Cash flow
-5.0%
Cash-on-Cash Return
5.0%
Cap rate
0.8%
Rent to Value Ratio

Active
$6,999,000
5
bds
|
13
ba
|
20,774
sqft
|
built
2010
17800 SE 237th Ct, Umatilla, FL 32784
$-36,681
Cash flow
-27.3%
Cash-on-Cash Return
-0.1%
Cap rate
0.1%
Rent to Value Ratio

Active
$339,000
3
bds
|
2
ba
|
1,398
sqft
|
built
1987
4170 SE 57th Ln, Ocala, FL 34480
$-463
Cash flow
-7.1%
Cash-on-Cash Return
4.5%
Cap rate
0.6%
Rent to Value Ratio
Active
$285,000
3
bds
|
2
ba
|
1,560
sqft
|
built
1982
5083 SE 24th Pl, Ocala, FL 34480
$-552
Cash flow
-10.1%
Cash-on-Cash Return
3.8%
Cap rate
0.6%
Rent to Value Ratio
Active
$314,900
3
bds
|
2
ba
|
1,512
sqft
|
built
1996
4779 SE 34th Ter, Ocala, FL 34480
$-372
Cash flow
-6.2%
Cash-on-Cash Return
4.7%
Cap rate
0.6%
Rent to Value Ratio
Active
$324,500
3
bds
|
2
ba
|
1,212
sqft
|
built
2006
13630 SW 48th Ct, Ocala, FL 34473
$-564
Cash flow
-9.1%
Cash-on-Cash Return
4.1%
Cap rate
0.6%
Rent to Value Ratio
Active
$240,000
3
bds
|
2
ba
|
1,424
sqft
|
built
1979
2837 NW 4th Ave, Ocala, FL 34475
$-550
Cash flow
-12.0%
Cash-on-Cash Return
3.4%
Cap rate
0.6%
Rent to Value Ratio
Active
$649,000
3
bds
|
3
ba
|
3,019
sqft
|
built
1997
645 SW 48th Ln, Ocala, FL 34471
$-1,483
Cash flow
-11.9%
Cash-on-Cash Return
3.4%
Cap rate
0.6%
Rent to Value Ratio
Active
$279,900
3
bds
|
2
ba
|
1,925
sqft
|
built
1982
545 Silver Course Cir, Ocala, FL 34472
$-430
Cash flow
-8.0%
Cash-on-Cash Return
4.3%
Cap rate
0.6%
Rent to Value Ratio
Active
$369,000
3
bds
|
2
ba
|
2,326
sqft
|
built
1970
148 SE 39th Ter, Ocala, FL 34471
$-559
Cash flow
-7.9%
Cash-on-Cash Return
4.3%
Cap rate
0.7%
Rent to Value Ratio
Active
$875,000
4
bds
|
4
ba
|
3,186
sqft
|
built
2022
1715 SW 27th Pl, Ocala, FL 34471
$-3,297
Cash flow
-19.7%
Cash-on-Cash Return
1.6%
Cap rate
0.4%
Rent to Value Ratio
Active
$410,000
3
bds
|
2
ba
|
2,265
sqft
|
built
1986
1025 SE 56th Ct, Ocala, FL 34480
$-889
Cash flow
-11.3%
Cash-on-Cash Return
3.5%
Cap rate
0.6%
Rent to Value Ratio
Active
$295,000
3
bds
|
2
ba
|
1,350
sqft
|
built
2021
4931 NW 62nd Ave, Ocala, FL 34482
$-553
Cash flow
-9.8%
Cash-on-Cash Return
3.9%
Cap rate
0.6%
Rent to Value Ratio
Active
$650,000
3
bds
|
3
ba
|
2,535
sqft
|
built
2003
6282 NE 61st Avenue Rd, Silver Springs, FL 34488
$-1,744
Cash flow
-14.0%
Cash-on-Cash Return
2.9%
Cap rate
0.4%
Rent to Value Ratio

Active
$265,000
3
bds
|
2
ba
|
1,356
sqft
|
built
1979
3 Silver Ct, Ocala, FL 34472
$-467
Cash flow
-9.2%
Cash-on-Cash Return
4.0%
Cap rate
0.7%
Rent to Value Ratio
Active
$245,000
3
bds
|
2
ba
|
1,260
sqft
|
built
2018
2711 SW 17th Cir, Ocala, FL 34474
$-452
Cash flow
-9.6%
Cash-on-Cash Return
3.9%
Cap rate
0.7%
Rent to Value Ratio
Active
$265,000
3
bds
|
2
ba
|
1,238
sqft
|
built
2022
3888 SE 143rd Pl, Summerfield, FL 34491
$-436
Cash flow
-8.6%
Cash-on-Cash Return
4.2%
Cap rate
0.6%
Rent to Value Ratio
Active
$249,900
3
bds
|
2
ba
|
1,762
sqft
|
built
1977
1928 SE 14th Ave, Ocala, FL 34471
$-206
Cash flow
-4.3%
Cash-on-Cash Return
5.2%
Cap rate
0.8%
Rent to Value Ratio
Active
$239,000
3
bds
|
2
ba
|
1,864
sqft
|
built
2006
4555 SW 52nd Cir, Ocala, FL 34474
$-648
Cash flow
-14.1%
Cash-on-Cash Return
2.9%
Cap rate
0.8%
Rent to Value Ratio
Active
$450,000
3
bds
|
3
ba
|
2,592
sqft
|
built
2018
6429 SW 45th Ave, Ocala, FL 34474
$-1,135
Cash flow
-13.2%
Cash-on-Cash Return
3.1%
Cap rate
0.6%
Rent to Value Ratio
Active
$949,000
3
bds
|
2
ba
|
2,908
sqft
|
built
1999
3811 SE 44th St, Ocala, FL 34480
$-2,430
Cash flow
-13.4%
Cash-on-Cash Return
3.1%
Cap rate
0.4%
Rent to Value Ratio
Active
$264,999
3
bds
|
2
ba
|
1,670
sqft
|
built
2021
27 Hickory Course Ln, Ocala, FL 34472
$-504
Cash flow
-9.9%
Cash-on-Cash Return
3.9%
Cap rate
0.7%
Rent to Value Ratio