Miami Dade County Investment Properties for Sale
Browse homes for sale and investment properties in Miami Dade County. Refine your search by price, property type, or more.
Best cash flowing properties in Miami Dade County
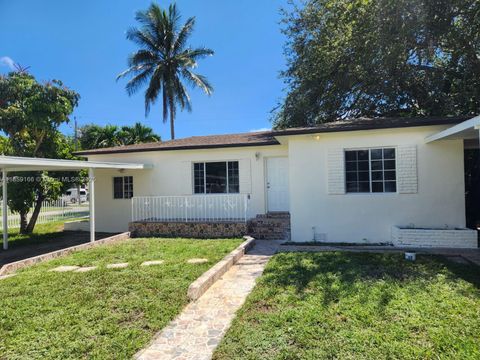
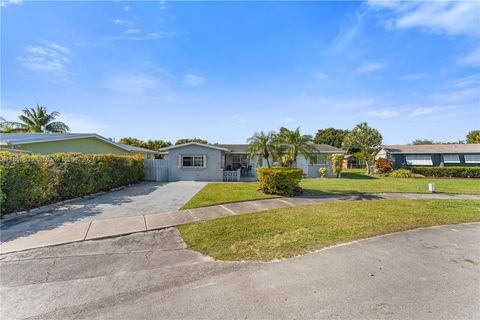
Active
$420,000
3
bds
|
2
ba
|
1,121
sqft
|
built
1947
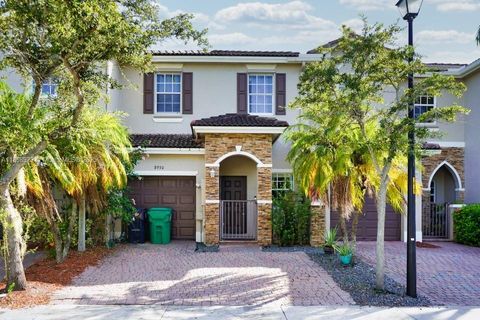
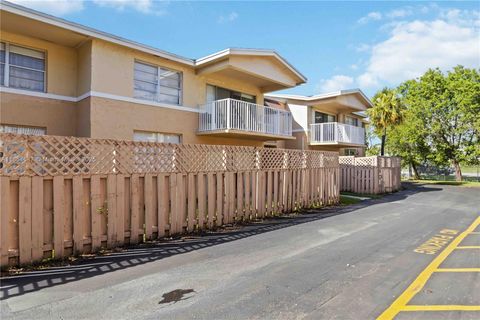
8741 NW 15th Ave, Miami, FL 33147
$-258
Cash flow
-3.2%
Cash-on-Cash Return
5.4%
Cap rate
0.7%
Rent to Value Ratio
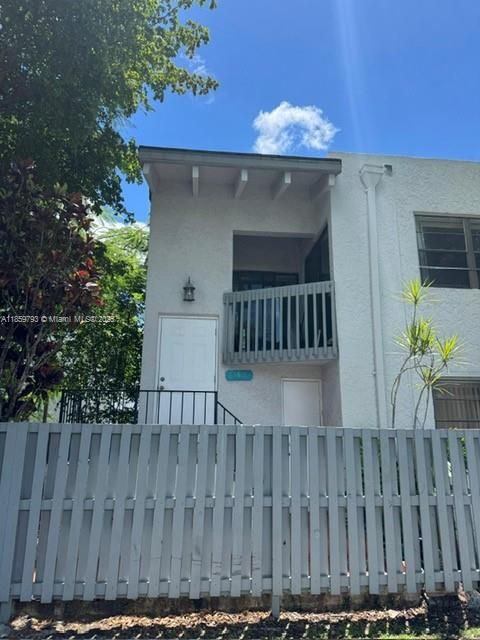
Active
$350,000
3
bds
|
2
ba
|
1,235
sqft
|
built
1979
10542 NW 7th Ter, Miami, FL 33172
$-265
Cash flow
-4.0%
Cash-on-Cash Return
5.2%
Cap rate
0.8%
Rent to Value Ratio
10,000 out of 13,381 properties for sale in Miami Dade County
Limited Results Shown
Create a free account, or log in to reveal all property listings and enjoy the complete experience.
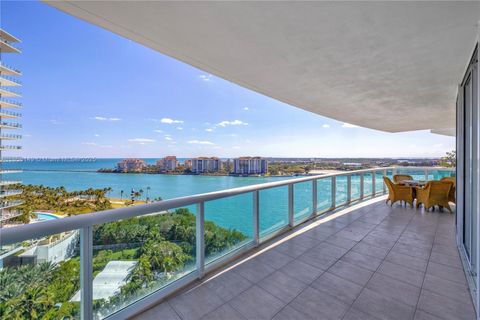
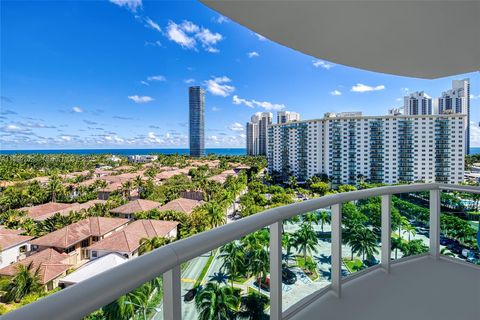
Active
$2,490,000
2
bds
|
3
ba
|
1,407
sqft
|
built
2001
1000 S Pointe Dr, Miami Beach, FL 33139
$-11,532
Cash flow
-24.2%
Cash-on-Cash Return
0.6%
Cap rate
0.4%
Rent to Value Ratio
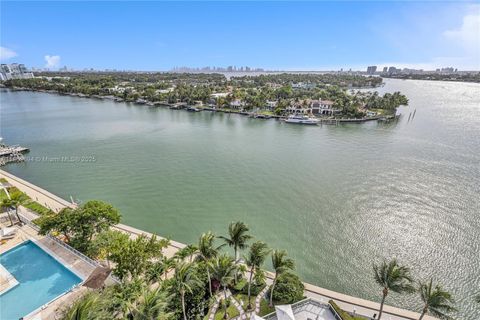
Active
$890,000
2
bds
|
2
ba
|
942
sqft
|
built
2013
6700 Indian Creek Dr, Miami Beach, FL 33141
$-4,118
Cash flow
-24.1%
Cash-on-Cash Return
0.6%
Cap rate
0.6%
Rent to Value Ratio
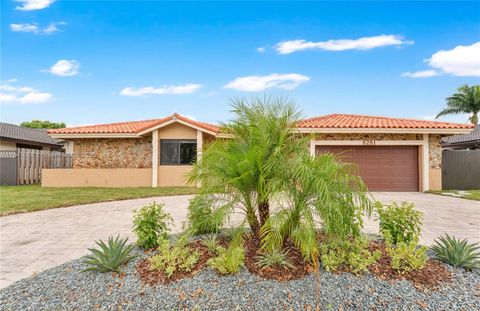
Active
$810,000
4
bds
|
2
ba
|
2,042
sqft
|
built
1985
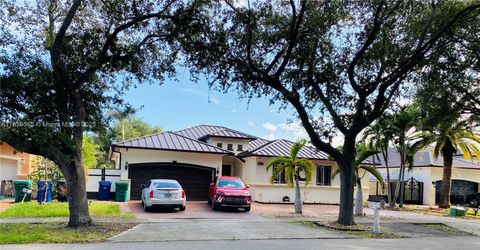
6281 NW 201st St, Hialeah, FL 33015
$-1,922
Cash flow
-12.4%
Cash-on-Cash Return
3.3%
Cap rate
0.4%
Rent to Value Ratio
Active
$275,000
2
bds
|
2
ba
|
847
sqft
|
built
1987
2775 W 61st St, Hialeah, FL 33016
$-339
Cash flow
-6.4%
Cash-on-Cash Return
4.7%
Cap rate
0.8%
Rent to Value Ratio
Active
$260,000
2
bds
|
2
ba
|
1,080
sqft
|
built
1974
1950 W 54th St, Hialeah, FL 33012
$-535
Cash flow
-10.7%
Cash-on-Cash Return
3.7%
Cap rate
0.8%
Rent to Value Ratio
Active
$1,050,000
5
bds
|
5
ba
|
2,838
sqft
|
built
2023
16916 SW 291st St, Homestead, FL 33030
$-3,031
Cash flow
-15.1%
Cash-on-Cash Return
2.7%
Cap rate
0.4%
Rent to Value Ratio
Active
$125,000
bds
|
1
ba
|
410
sqft
|
built
1966
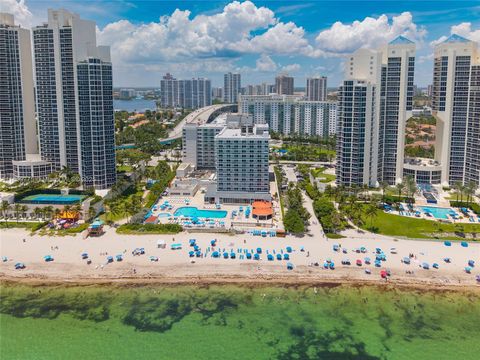
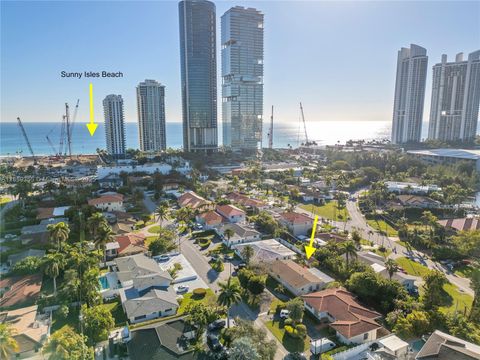
19201 Collins Ave, Sunny Isles Beach, FL 33160
$-901
Cash flow
-37.6%
Cash-on-Cash Return
-2.5%
Cap rate
1.6%
Rent to Value Ratio
Active
$450,000
3
bds
|
3
ba
|
1,526
sqft
|
built
2007
8930 SW 224th Ter, Cutler Bay, FL 33190
$-930
Cash flow
-10.8%
Cash-on-Cash Return
3.7%
Cap rate
0.6%
Rent to Value Ratio
Active
$899,000
4
bds
|
3
ba
|
2,048
sqft
|
built
2001
7760 NW 163rd St, Miami Lakes, FL 33016
$-2,091
Cash flow
-12.1%
Cash-on-Cash Return
3.4%
Cap rate
0.5%
Rent to Value Ratio
Active
$2,250,000
3
bds
|
8
ba
|
2,524
sqft
|
built
2001
1330 West Ave, Miami Beach, FL 33139
$-9,683
Cash flow
-22.5%
Cash-on-Cash Return
1.0%
Cap rate
0.4%
Rent to Value Ratio
Active
$800,000
2
bds
|
2
ba
|
1,305
sqft
|
built
1980
2625 Collins Ave, Miami Beach, FL 33140
$-2,517
Cash flow
-16.4%
Cash-on-Cash Return
2.4%
Cap rate
0.6%
Rent to Value Ratio
Active
$1,749,000
3
bds
|
2
ba
|
1,653
sqft
|
built
1956
300 187th St, Sunny Isles Beach, FL 33160
$-4,417
Cash flow
-13.2%
Cash-on-Cash Return
3.1%
Cap rate
0.4%
Rent to Value Ratio
Active
$605,000
2
bds
|
2
ba
|
1,708
sqft
|
built
2007
3001 NE 185th St, Aventura, FL 33180
$-2,629
Cash flow
-22.7%
Cash-on-Cash Return
0.9%
Cap rate
0.7%
Rent to Value Ratio
Active
$715,000
1
bds
|
2
ba
|
976
sqft
|
built
2016
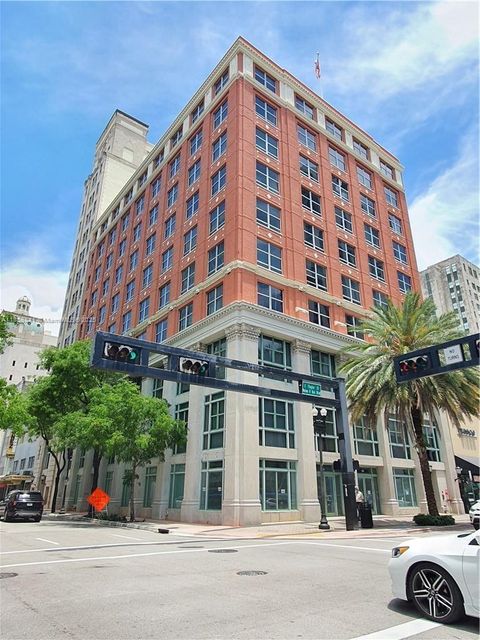
68 SE 6th St, Miami, FL 33131
$-3,093
Cash flow
-22.6%
Cash-on-Cash Return
1.0%
Cap rate
0.6%
Rent to Value Ratio
Active
$260,000
2
bds
|
2
ba
|
813
sqft
|
built
1973
6820 W Flagler St, Miami, FL 33144
$-661
Cash flow
-13.3%
Cash-on-Cash Return
3.1%
Cap rate
0.8%
Rent to Value Ratio
Active
$495,000
3
bds
|
1
ba
|
1,015
sqft
|
built
1973
5428 SW 131st Ct, Miami, FL 33175
$-714
Cash flow
-7.5%
Cash-on-Cash Return
4.4%
Cap rate
0.6%
Rent to Value Ratio
Active
$435,000
1
bds
|
2
ba
|
991
sqft
|
built
1975
100 Bayview Dr, Sunny Isles Beach, FL 33160
$-1,765
Cash flow
-21.2%
Cash-on-Cash Return
1.3%
Cap rate
0.6%
Rent to Value Ratio
Active
$560,888
4
bds
|
3
ba
|
2,126
sqft
|
built
2020
572 NE 6th Pl, Florida City, FL 33034
$-1,066
Cash flow
-9.9%
Cash-on-Cash Return
3.9%
Cap rate
0.6%
Rent to Value Ratio
Active
$295,000
2
bds
|
2
ba
|
1,060
sqft
|
built
1970
4140 NW 79th Ave, Doral, FL 33166
$-765
Cash flow
-13.5%
Cash-on-Cash Return
3.0%
Cap rate
0.8%
Rent to Value Ratio
Active
$524,900
3
bds
|
2
ba
|
1,403
sqft
|
built
1969
1239 Mariposa Ave, Coral Gables, FL 33146
$-1,292
Cash flow
-12.8%
Cash-on-Cash Return
3.2%
Cap rate
0.7%
Rent to Value Ratio
Active
$230,000
1
bds
|
1
ba
|
560
sqft
|
built
1968
8701 SW 141st St, Palmetto Bay, FL 33176
$-565
Cash flow
-12.8%
Cash-on-Cash Return
3.2%
Cap rate
0.8%
Rent to Value Ratio
Active
$431,000
1
bds
|
1
ba
|
708
sqft
|
built
1990
770 Claughton Island Dr, Miami, FL 33131
$-1,997
Cash flow
-24.2%
Cash-on-Cash Return
0.6%
Cap rate
0.7%
Rent to Value Ratio
Active
$800,000
3
bds
|
2
ba
|
1,883
sqft
|
built
1970
8100 SW 95th Ct, Miami, FL 33173
$-2,132
Cash flow
-13.9%
Cash-on-Cash Return
2.9%
Cap rate
0.5%
Rent to Value Ratio
Active
$639,000
4
bds
|
2
ba
|
1,700
sqft
|
built
1972
11462 SW 225th St, Miami, FL 33170
$-1,408
Cash flow
-11.5%
Cash-on-Cash Return
3.5%
Cap rate
0.5%
Rent to Value Ratio
Active
$779,000
4
bds
|
2
ba
|
1,462
sqft
|
built
1948
941 NW 40th Ave, Miami, FL 33126
$-1,684
Cash flow
-11.3%
Cash-on-Cash Return
3.6%
Cap rate
0.5%
Rent to Value Ratio
Active
$249,999
1
bds
|
1
ba
|
800
sqft
|
built
1966
20201 NE 29th Ct, Aventura, FL 33180
$-21,615
Cash flow
-451.1%
Cash-on-Cash Return
-97.6%
Cap rate
0.9%
Rent to Value Ratio
Active
$350,000
2
bds
|
1
ba
|
855
sqft
|
built
1951
111 E Flagler St, Miami, FL 33131
$-1,292
Cash flow
-19.3%
Cash-on-Cash Return
1.7%
Cap rate
0.7%
Rent to Value Ratio
Active
$7,950,000
5
bds
|
5
ba
|
4,809
sqft
|
built
1979
1051 San Pedro Ave, Coral Gables, FL 33156
$-40,876
Cash flow
-26.8%
Cash-on-Cash Return
0.0%
Cap rate
0.1%
Rent to Value Ratio
Active
$820,000
2
bds
|
2
ba
|
1,100
sqft
|
built
1965
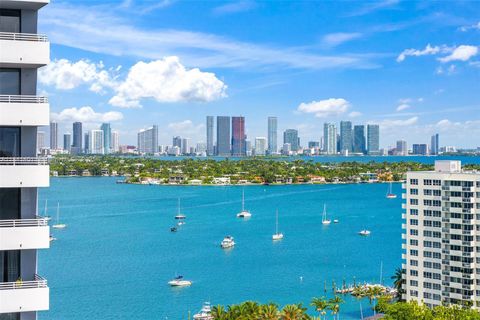
9195 Collins Ave, Surfside, FL 33154
$-3,407
Cash flow
-21.7%
Cash-on-Cash Return
1.2%
Cap rate
0.5%
Rent to Value Ratio
Active
$649,000
1
bds
|
2
ba
|
1,133
sqft
|
built
1963
900 Bay Dr, Miami Beach, FL 33141
$-2,906
Cash flow
-23.4%
Cash-on-Cash Return
0.8%
Cap rate
0.5%
Rent to Value Ratio
Active
$595,000
2
bds
|
2
ba
|
1,492
sqft
|
built
1972
19380 Collins Ave, Sunny Isles Beach, FL 33160
$-2,730
Cash flow
-23.9%
Cash-on-Cash Return
0.6%
Cap rate
0.5%
Rent to Value Ratio
Active
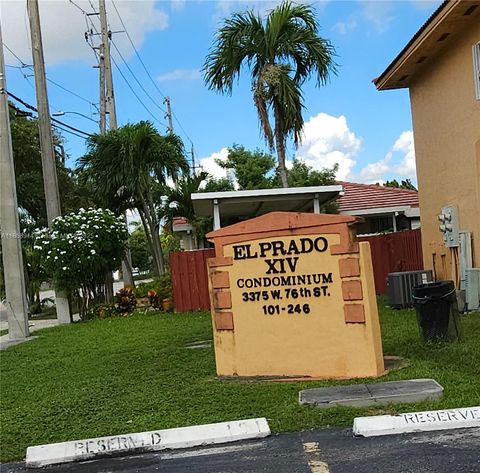
$320,000
2
bds
|
2
ba
|
990
sqft
|
built
1994
3375 W 76th St, Hialeah, FL 33018
$-305
Cash flow
-5.0%
Cash-on-Cash Return
5.0%
Cap rate
0.8%
Rent to Value Ratio
Active
$389,000
3
bds
|
2
ba
|
1,195
sqft
|
built
1979
6570 W 2nd Ct, Hialeah, FL 33012
$-319
Cash flow
-4.3%
Cash-on-Cash Return
5.2%
Cap rate
0.6%
Rent to Value Ratio
Active
$649,000
3
bds
|
2
ba
|
1,646
sqft
|
built
1987
11518 SW 174th St, Miami, FL 33157
$-1,226
Cash flow
-9.9%
Cash-on-Cash Return
3.9%
Cap rate
0.6%
Rent to Value Ratio
Active
$450,000
bds
|
1
ba
|
375
sqft
|
built
2014
1300 Brickell Bay Dr, Miami, FL 33131
$-647
Cash flow
-7.5%
Cash-on-Cash Return
4.4%
Cap rate
0.8%
Rent to Value Ratio
Active
$799,900
5
bds
|
3
ba
|
2,247
sqft
|
built
1961
9835 SW 85th St, Miami, FL 33173
$-1,714
Cash flow
-11.2%
Cash-on-Cash Return
3.6%
Cap rate
0.5%
Rent to Value Ratio
Active
$850,000
3
bds
|
3
ba
|
2,072
sqft
|
built
2001
16258 SW 68th Ter, Miami, FL 33193
$-2,215
Cash flow
-13.6%
Cash-on-Cash Return
3.0%
Cap rate
0.5%
Rent to Value Ratio
Active
$799,888
1
bds
|
1
ba
|
859
sqft
|
built
1962
3 Island Ave, Miami Beach, FL 33139
$-3,140
Cash flow
-20.5%
Cash-on-Cash Return
1.4%
Cap rate
0.6%
Rent to Value Ratio