Miami Dade County Investment Properties for Sale
Browse homes for sale and investment properties in Miami Dade County. Refine your search by price, property type, or more.
Best cash flowing properties in Miami Dade County
Active
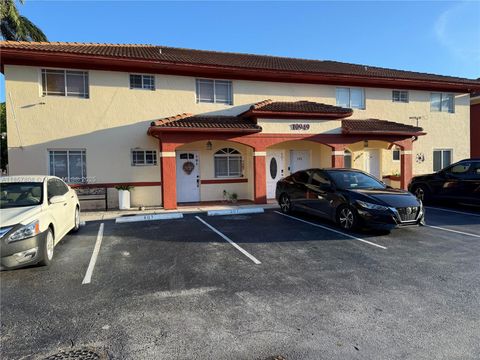
$324,995
2
bds
|
2
ba
|
1,190
sqft
|
built
2000
10949 W Okeechobee Rd, Hialeah Gardens, FL 33018
$-132
Cash flow
-2.1%
Cash-on-Cash Return
5.7%
Cap rate
0.9%
Rent to Value Ratio
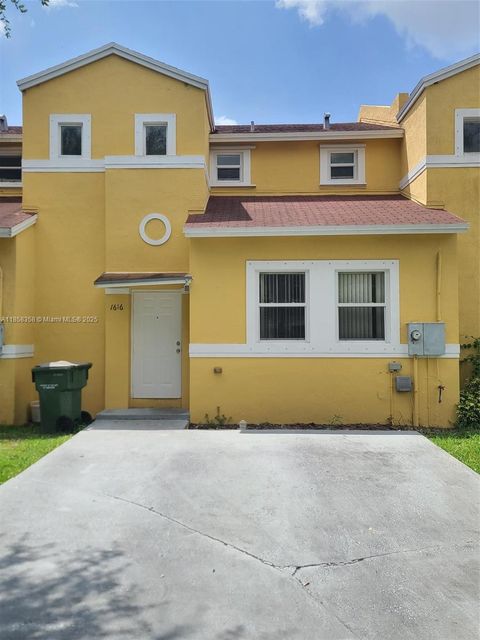
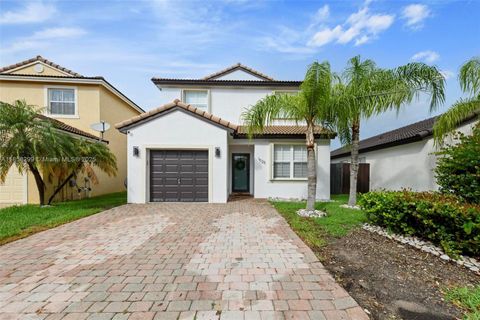
Active
$315,000
3
bds
|
2
ba
|
1,358
sqft
|
built
2005
1616 NE 5th St, Homestead, FL 33033
$-352
Cash flow
-5.8%
Cash-on-Cash Return
4.8%
Cap rate
0.8%
Rent to Value Ratio
10,000 out of 11,974 properties for sale in Miami Dade County
Limited Results Shown
Create a free account, or log in to reveal all property listings and enjoy the complete experience.
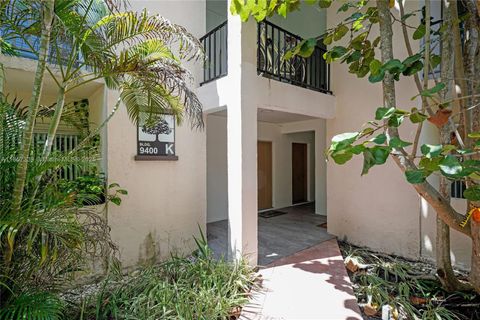
Active
$334,900
2
bds
|
2
ba
|
1,178
sqft
|
built
1967
9400 SW 77th Ave, Miami, FL 33156
$-797
Cash flow
-12.4%
Cash-on-Cash Return
3.3%
Cap rate
0.8%
Rent to Value Ratio
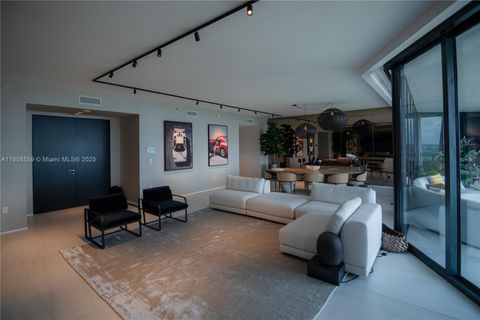
Active
$7,750,000
4
bds
|
5
ba
|
4,600
sqft
|
built
2019
1000 Biscayne Blvd, Miami, FL 33132
$-53,131
Cash flow
-35.8%
Cash-on-Cash Return
-2.1%
Cap rate
0.1%
Rent to Value Ratio
Active
$569,000
4
bds
|
3
ba
|
1,899
sqft
|
built
2004
14942 SW 8th Ln, Miami, FL 33194
$-1,259
Cash flow
-11.5%
Cash-on-Cash Return
3.5%
Cap rate
0.6%
Rent to Value Ratio

Active
$4,650,000
6
bds
|
6
ba
|
3,436
sqft
|
built
1998
285 W Enid Dr, Key Biscayne, FL 33149
$-20,990
Cash flow
-23.6%
Cash-on-Cash Return
0.7%
Cap rate
0.2%
Rent to Value Ratio
Active
$27,500,000
8
bds
|
10
ba
|
11,847
sqft
|
built
2000
221 Casuarina Concourse, Coral Gables, FL 33143
$-148,616
Cash flow
-28.2%
Cash-on-Cash Return
-0.3%
Cap rate
0.0%
Rent to Value Ratio
Active
$510,000
4
bds
|
2
ba
|
1,662
sqft
|
built
1953
1100 NE 151st Ter, North Miami Beach, FL 33162
$-817
Cash flow
-8.4%
Cash-on-Cash Return
4.2%
Cap rate
0.7%
Rent to Value Ratio
Active
$450,000
2
bds
|
2
ba
|
1,170
sqft
|
built
1989
6489 SW 129th Ave, Miami, FL 33183
$-763
Cash flow
-8.8%
Cash-on-Cash Return
4.1%
Cap rate
0.6%
Rent to Value Ratio
Active
$800,000
3
bds
|
2
ba
|
1,620
sqft
|
built
2020
18573 SW 89th Pl, Miami, FL 33157
$-2,368
Cash flow
-15.4%
Cash-on-Cash Return
2.6%
Cap rate
0.4%
Rent to Value Ratio
Active
$420,000
2
bds
|
2
ba
|
1,062
sqft
|
built
2005
18800 NE 29th Ave, Aventura, FL 33180
$-1,271
Cash flow
-15.8%
Cash-on-Cash Return
2.5%
Cap rate
0.8%
Rent to Value Ratio
Active
$3,249,000
4
bds
|
3
ba
|
2,934
sqft
|
built
1979
1090 NE 92nd St, Miami Shores, FL 33138
$-13,506
Cash flow
-21.7%
Cash-on-Cash Return
1.2%
Cap rate
0.3%
Rent to Value Ratio
Active
$5,750,000
3
bds
|
4
ba
|
2,896
sqft
|
built
2019
4701 N Meridian Ave, Miami Beach, FL 33140
$-36,061
Cash flow
-32.7%
Cash-on-Cash Return
-1.4%
Cap rate
0.2%
Rent to Value Ratio

Active
$725,000
4
bds
|
3
ba
|
2,553
sqft
|
built
1999
7856 NW 194th St, Hialeah, FL 33015
$-1,539
Cash flow
-11.1%
Cash-on-Cash Return
3.6%
Cap rate
0.5%
Rent to Value Ratio
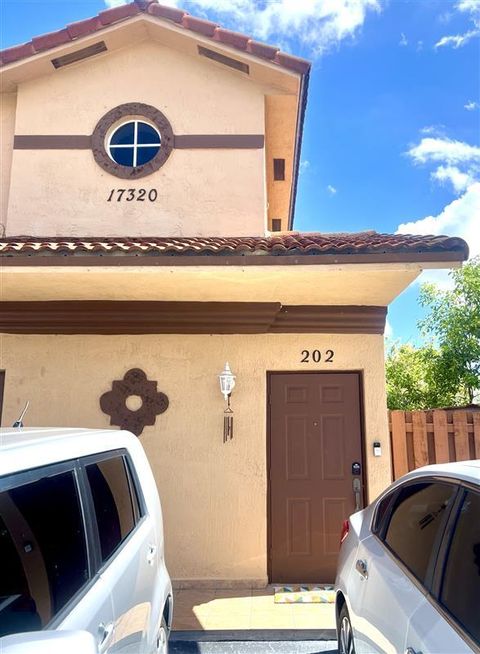
Active
$345,000
2
bds
|
2
ba
|
1,106
sqft
|
built
2001
17320 NW 74th Ave, Hialeah, FL 33015
$-451
Cash flow
-6.8%
Cash-on-Cash Return
4.6%
Cap rate
0.7%
Rent to Value Ratio
Active
$1,300,000
3
bds
|
3
ba
|
1,719
sqft
|
built
1997
701 Brickell Key Blvd, Miami, FL 33131
$-4,376
Cash flow
-17.6%
Cash-on-Cash Return
2.1%
Cap rate
0.7%
Rent to Value Ratio

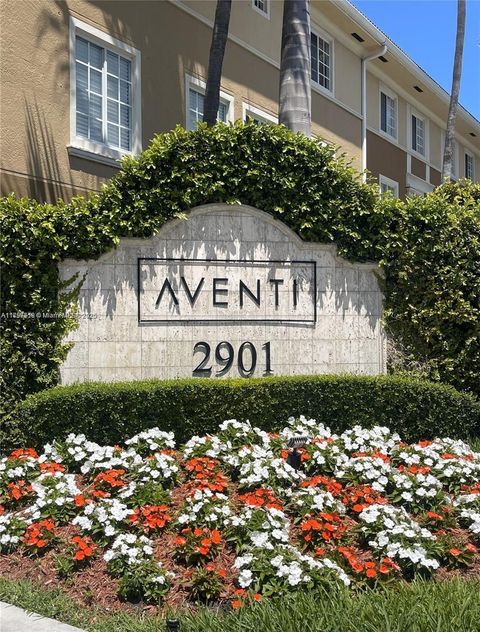
Active
$479,000
2
bds
|
2
ba
|
1,316
sqft
|
built
2001
2821 NE 185th St, Aventura, FL 33180
$-1,694
Cash flow
-18.5%
Cash-on-Cash Return
1.9%
Cap rate
0.7%
Rent to Value Ratio
Active
$575,000
3
bds
|
2
ba
|
1,481
sqft
|
built
2001
2811 NE 185th St, Aventura, FL 33180
$-2,070
Cash flow
-18.8%
Cash-on-Cash Return
1.8%
Cap rate
0.7%
Rent to Value Ratio
Active
$399,999
4
bds
|
2
ba
|
1,116
sqft
|
built
1994
998 SW 8th Pl, Florida City, FL 33034
$-746
Cash flow
-9.7%
Cash-on-Cash Return
3.9%
Cap rate
0.7%
Rent to Value Ratio
Active
$570,000
3
bds
|
2
ba
|
1,150
sqft
|
built
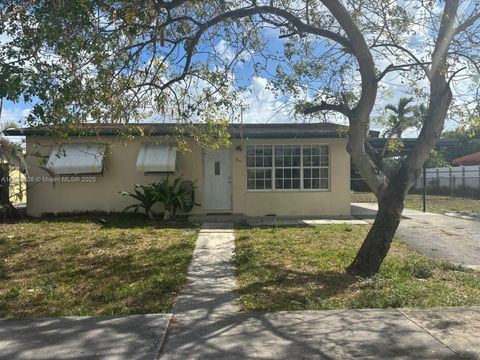
1950
1675 NE 160th St, North Miami Beach, FL 33162
$-1,101
Cash flow
-10.1%
Cash-on-Cash Return
3.8%
Cap rate
0.6%
Rent to Value Ratio
Active
$899,000
3
bds
|
5
ba
|
2,789
sqft
|
built
2019
4690 NW 84th Ave, Doral, FL 33166
$-3,481
Cash flow
-20.2%
Cash-on-Cash Return
1.5%
Cap rate
0.5%
Rent to Value Ratio
Active
$740,000
5
bds
|
4
ba
|
2,100
sqft
|
built
1952
4540 SW 2nd Ter, Coral Gables, FL 33134
$-1,097
Cash flow
-7.7%
Cash-on-Cash Return
4.4%
Cap rate
0.6%
Rent to Value Ratio
Active
$425,000
1
bds
|
2
ba
|
902
sqft
|
built
2006
31 SE 5th St, Miami, FL 33131
$-1,388
Cash flow
-17.0%
Cash-on-Cash Return
2.2%
Cap rate
0.8%
Rent to Value Ratio
Active
$299,999
2
bds
|
2
ba
|
842
sqft
|
built
2006
2475 NW 16th Street Rd, Miami, FL 33125
$-876
Cash flow
-15.2%
Cash-on-Cash Return
2.6%
Cap rate
0.8%
Rent to Value Ratio
Active
$350,000
1
bds
|
1
ba
|
561
sqft
|
built
1935
1508 Pennsylvania Ave, Miami Beach, FL 33139
$-1,089
Cash flow
-16.2%
Cash-on-Cash Return
2.4%
Cap rate
0.7%
Rent to Value Ratio
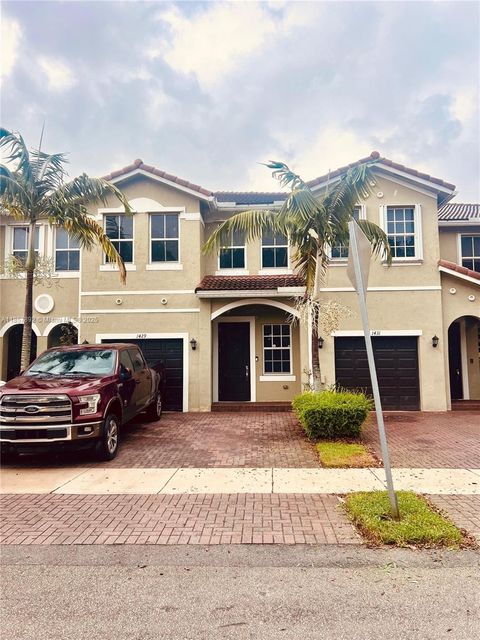
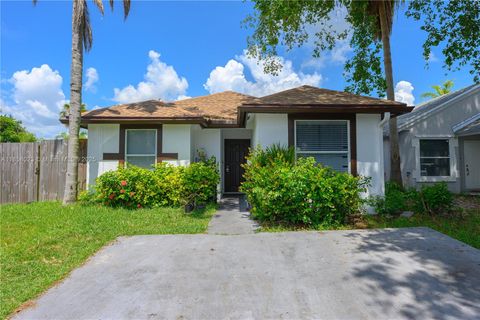
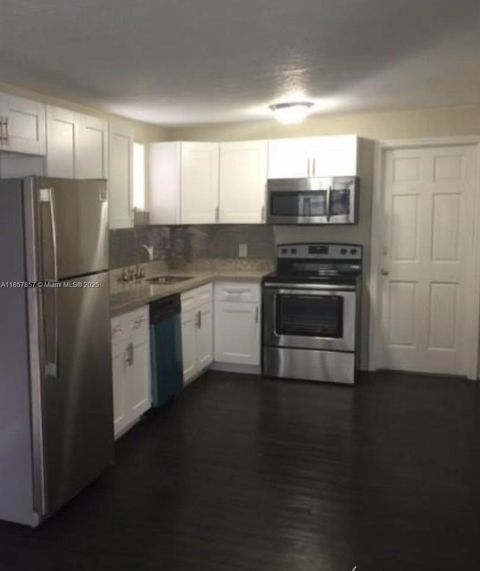
Active
$440,000
4
bds
|
3
ba
|
1,916
sqft
|
built
2018
1429 SE 26th Ave, Homestead, FL 33035
$-1,295
Cash flow
-15.4%
Cash-on-Cash Return
2.6%
Cap rate
0.7%
Rent to Value Ratio
Active
$374,000
3
bds
|
3
ba
|
1,500
sqft
|
built
1986
17962 NW 68th Ave, Hialeah, FL 33015
$-805
Cash flow
-11.2%
Cash-on-Cash Return
3.6%
Cap rate
0.8%
Rent to Value Ratio
Active
$495,000
3
bds
|
2
ba
|
1,286
sqft
|
built
1953
901 NW 149th Ter, Miami, FL 33168
$-1,142
Cash flow
-12.0%
Cash-on-Cash Return
3.4%
Cap rate
0.6%
Rent to Value Ratio
Active
$450,000
1
bds
|
1
ba
|
775
sqft
|
built
2006
31 SE 5th St, Miami, FL 33131
$-1,596
Cash flow
-18.5%
Cash-on-Cash Return
1.9%
Cap rate
0.7%
Rent to Value Ratio
Active
$595,000
1
bds
|
1
ba
|
662
sqft
|
built
2008
6801 Collins Ave, Miami Beach, FL 33141
$-1,612
Cash flow
-14.1%
Cash-on-Cash Return
2.9%
Cap rate
1.1%
Rent to Value Ratio
Active
$5,750,000
3
bds
|
3
ba
|
3,084
sqft
|
built
2019
4701 N Meridian Ave, Miami Beach, FL 33140
$-36,880
Cash flow
-33.5%
Cash-on-Cash Return
-1.5%
Cap rate
0.1%
Rent to Value Ratio
Active
$660,000
2
bds
|
2
ba
|
1,121
sqft
|
built
1980
2401 Collins Ave, Miami Beach, FL 33140
$-1,995
Cash flow
-15.8%
Cash-on-Cash Return
2.5%
Cap rate
0.6%
Rent to Value Ratio
Active
$1,699,000
2
bds
|
2
ba
|
1,400
sqft
|
built
2003
400 Alton Rd, Miami Beach, FL 33139
$-6,474
Cash flow
-19.9%
Cash-on-Cash Return
1.6%
Cap rate
0.5%
Rent to Value Ratio
Active
$649,000
4
bds
|
2
ba
|
970
sqft
|
built
1961
7820 NW 175th St, Hialeah, FL 33015
$-1,928
Cash flow
-15.5%
Cash-on-Cash Return
2.6%
Cap rate
0.4%
Rent to Value Ratio
Active
$435,000
3
bds
|
2
ba
|
1,693
sqft
|
built
2005
1525 SE 20th Pl, Homestead, FL 33035
$-907
Cash flow
-10.9%
Cash-on-Cash Return
3.6%
Cap rate
0.7%
Rent to Value Ratio
Active
$289,900
3
bds
|
3
ba
|
1,509
sqft
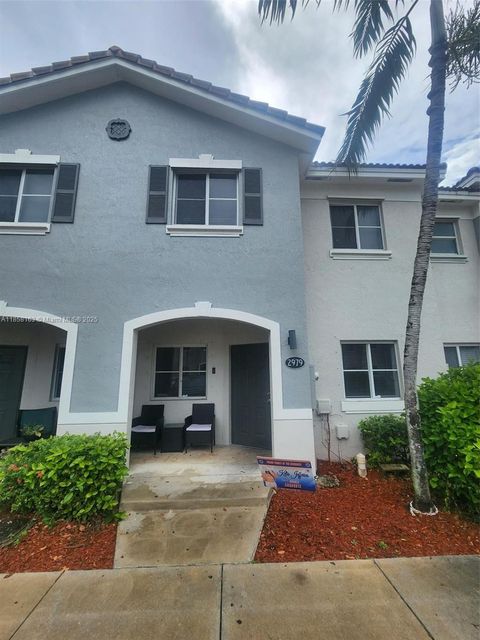
|
built
2005
2979 SE 15th Ave, Homestead, FL 33035
$-600
Cash flow
-10.8%
Cash-on-Cash Return
3.7%
Cap rate
0.8%
Rent to Value Ratio
Active
$419,900
2
bds
|
2
ba
|
1,122
sqft
|
built
1969
1239 Mariposa Ave, Coral Gables, FL 33146
$-911
Cash flow
-11.3%
Cash-on-Cash Return
3.5%
Cap rate
0.8%
Rent to Value Ratio

Active
$319,000
3
bds
|
2
ba
|
1,218
sqft
|
built
2007
20810 SW 87th Ave, Cutler Bay, FL 33189
$-623
Cash flow
-10.2%
Cash-on-Cash Return
3.8%
Cap rate
0.8%
Rent to Value Ratio
Active
$489,000
3
bds
|
3
ba
|
1,483
sqft
|
built
2022
3310 W 114th Ter, Hialeah, FL 33018
$-1,209
Cash flow
-12.9%
Cash-on-Cash Return
3.2%
Cap rate
0.7%
Rent to Value Ratio
Active
$309,900
1
bds
|
1
ba
|
821
sqft
|
built
2007
1750 N Bayshore Dr, Miami, FL 33132
$-869
Cash flow
-14.6%
Cash-on-Cash Return
2.8%
Cap rate
1.0%
Rent to Value Ratio