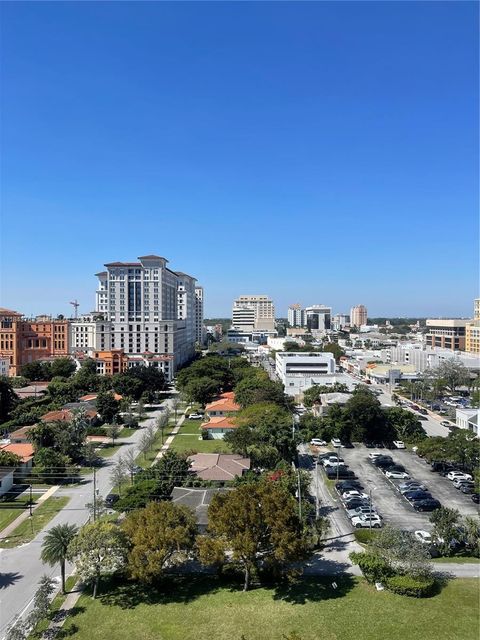
Miami Dade County Investment Properties for Sale
Browse homes for sale and investment properties in Miami Dade County. Refine your search by price, property type, or more.
Best cash flowing properties in Miami Dade County
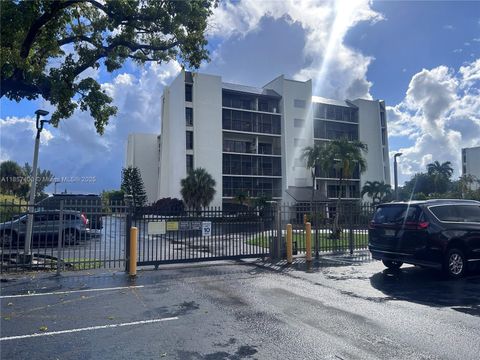
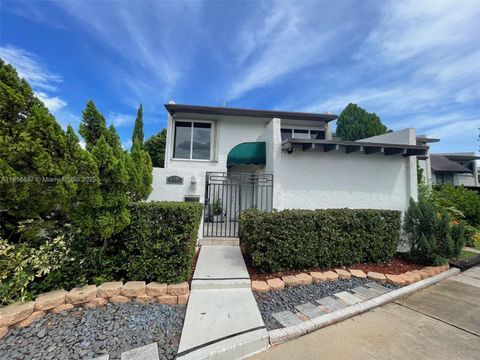
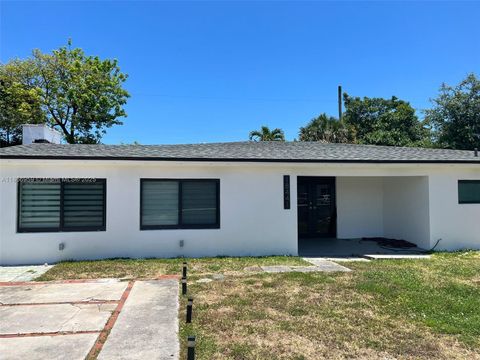
Active
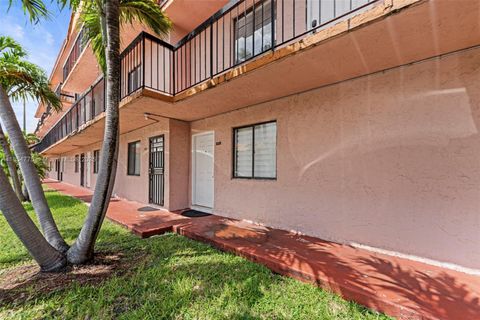
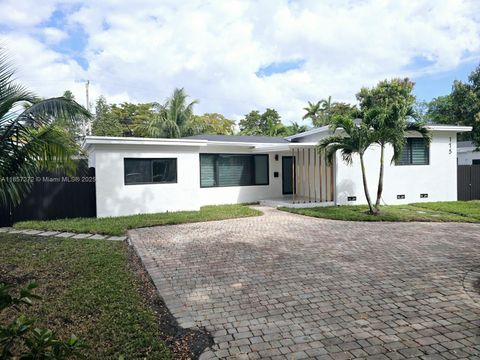
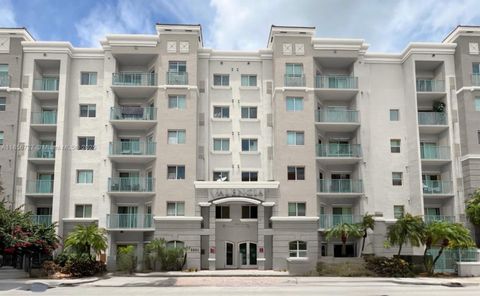
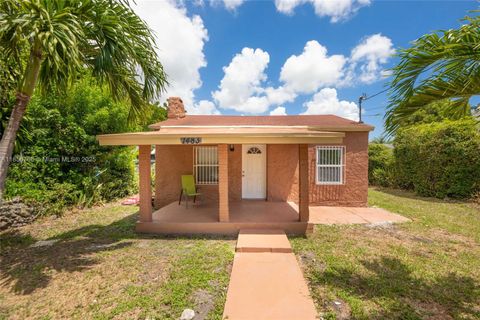
$204,000
1
bds
|
1
ba
|
528
sqft
|
built
1985
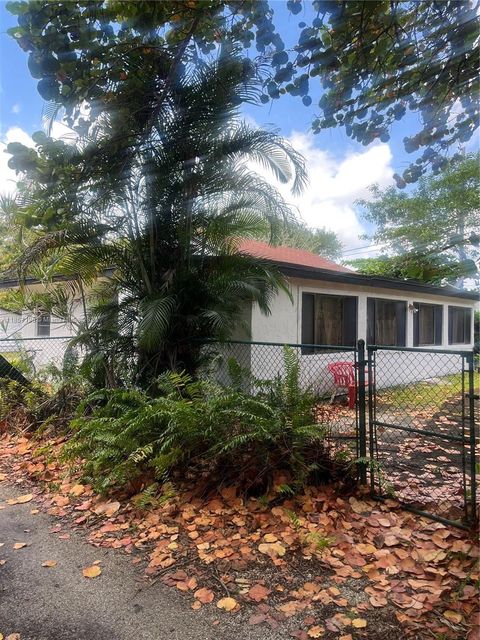
2178 W 60th St, Hialeah, FL 33016
$-371
Cash flow
-9.5%
Cash-on-Cash Return
4.0%
Cap rate
0.9%
Rent to Value Ratio
Active
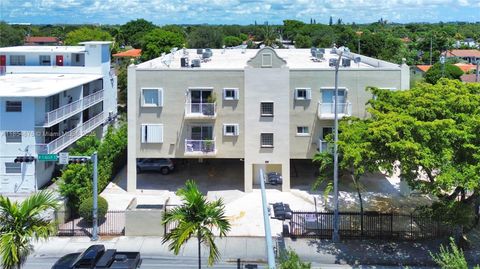
$235,000
1
bds
|
1
ba
|
607
sqft
|
built
2003
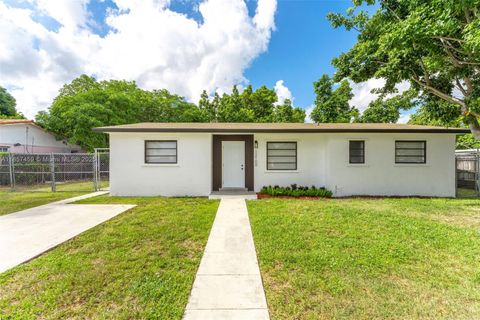
3201 W Flagler St, Miami, FL 33135
$-397
Cash flow
-8.8%
Cash-on-Cash Return
4.1%
Cap rate
0.8%
Rent to Value Ratio
10,000 out of 12,567 properties for sale in Miami Dade County
Limited Results Shown
Create a free account, or log in to reveal all property listings and enjoy the complete experience.
Active
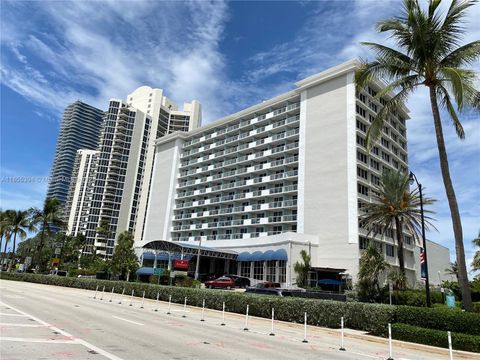
$112,000
bds
|
1
ba
|
410
sqft
|
built
1966
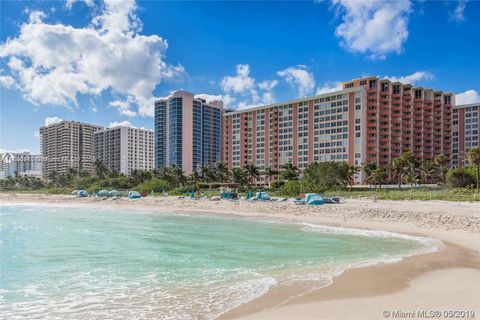
19201 Collins Ave, Sunny Isles Beach, FL 33160
$-663
Cash flow
-30.9%
Cash-on-Cash Return
-1.0%
Cap rate
2.0%
Rent to Value Ratio
Active
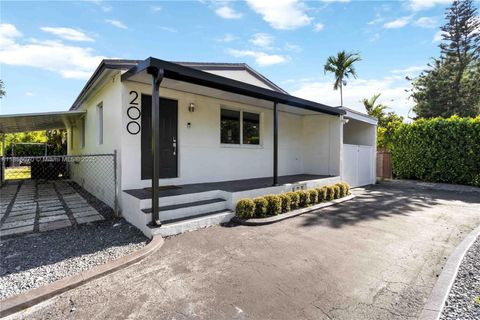
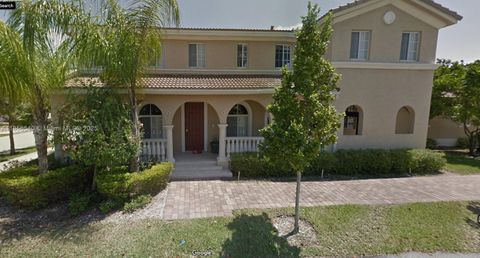
$449,000
2
bds
|
1
ba
|
984
sqft
|
built
1950
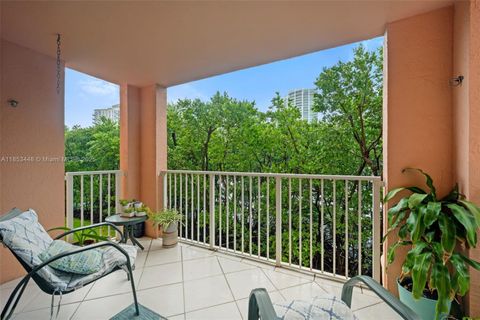
200 NW 134th St, North Miami, FL 33168
$-435
Cash flow
-5.1%
Cash-on-Cash Return
5.0%
Cap rate
0.7%
Rent to Value Ratio
Active
$759,000
3
bds
|
2
ba
|
2,074
sqft
|
built
1955
175 NE 120th St, North Miami, FL 33161
$-1,715
Cash flow
-11.8%
Cash-on-Cash Return
3.4%
Cap rate
0.5%
Rent to Value Ratio
Active
$1,250,000
3
bds
|
3
ba
|
1,816
sqft
|
built
1950
10551 NE 3rd Ave, Miami Shores, FL 33138
$-3,721
Cash flow
-15.5%
Cash-on-Cash Return
2.6%
Cap rate
0.4%
Rent to Value Ratio
Active
$675,000
4
bds
|
3
ba
|
1,456
sqft
|
built
1958
3500 SW 87th Pl, Miami, FL 33165
$-1,660
Cash flow
-12.8%
Cash-on-Cash Return
3.2%
Cap rate
0.5%
Rent to Value Ratio
Active
$1,350,000
8
bds
|
0
ba
|
3,386
sqft
|
built
1925
1376 NW 35th St, Miami, FL 33142
$-5,017
Cash flow
-19.4%
Cash-on-Cash Return
1.7%
Cap rate
0.4%
Rent to Value Ratio
Active
$549,999
3
bds
|
0
ba
|
1,682
sqft
|
built
1941
15260 NE 2nd Ave, Miami, FL 33162
$-1,939
Cash flow
-18.4%
Cash-on-Cash Return
1.9%
Cap rate
0.4%
Rent to Value Ratio
Active
$589,000
4
bds
|
2
ba
|
1,272
sqft
|
built
1974
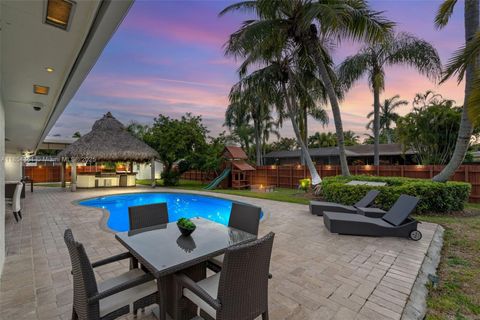
12100 SW 191st Ter, Miami, FL 33177
$-1,553
Cash flow
-13.8%
Cash-on-Cash Return
3.0%
Cap rate
0.5%
Rent to Value Ratio
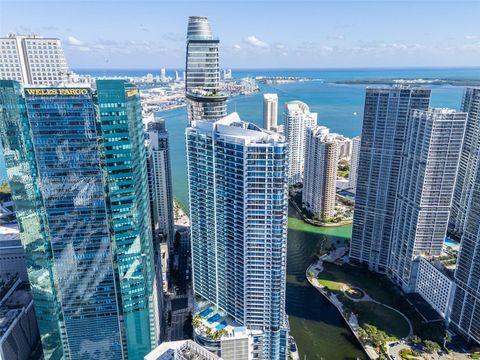
Active
$550,000
2
bds
|
2
ba
|
1,249
sqft
|
built
1977
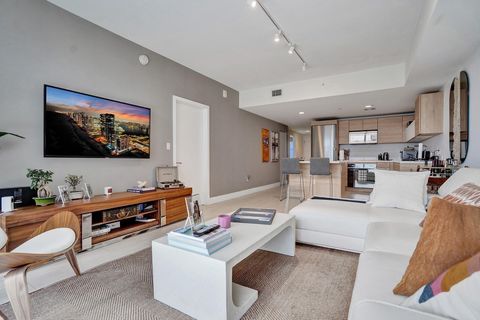
1450 Brickell Bay Dr, Miami, FL 33131
$-1,977
Cash flow
-18.8%
Cash-on-Cash Return
1.8%
Cap rate
0.7%
Rent to Value Ratio
Active
$997,777
3
bds
|
2
ba
|
1,551
sqft
|
built
2004
1250 S Miami Ave, Miami, FL 33130
$-4,202
Cash flow
-22.0%
Cash-on-Cash Return
1.1%
Cap rate
0.5%
Rent to Value Ratio
Active
$306,000
2
bds
|
2
ba
|
1,200
sqft
|
built
1977
14201 SW 66th St, Miami, FL 33183
$-544
Cash flow
-9.3%
Cash-on-Cash Return
4.0%
Cap rate
0.8%
Rent to Value Ratio
Active
$1,400,000
2
bds
|
3
ba
|
1,607
sqft
|
built
2008
200 Biscayne Boulevard Way, Miami, FL 33131
$-6,030
Cash flow
-22.5%
Cash-on-Cash Return
1.0%
Cap rate
0.5%
Rent to Value Ratio
Active
$600,000
3
bds
|
2
ba
|
1,138
sqft
|
built
1960
4864 E 8th Ln, Hialeah, FL 33013
$-1,347
Cash flow
-11.7%
Cash-on-Cash Return
3.5%
Cap rate
0.5%
Rent to Value Ratio
Active
$343,900
2
bds
|
2
ba
|
990
sqft
|
built
2018
2651 NE 212th Ter, Aventura, FL 33180
$-1,180
Cash flow
-17.9%
Cash-on-Cash Return
2.0%
Cap rate
0.7%
Rent to Value Ratio
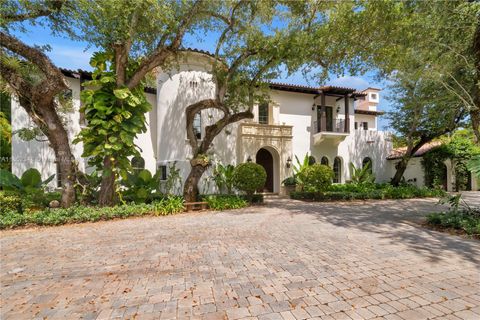
Active
$12,900,000
6
bds
|
7
ba
|
7,057
sqft
|
built
1992
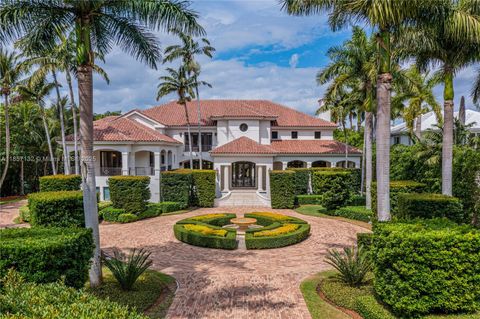
3 Tahiti Beach Island Rd, Coral Gables, FL 33143
$-75,458
Cash flow
-30.5%
Cash-on-Cash Return
-0.9%
Cap rate
0.1%
Rent to Value Ratio
Active
$257,000
1
bds
|
2
ba
|
1,070
sqft
|
built
2007
5300 NW 87th Ave, Doral, FL 33178
$-2,518
Cash flow
-51.1%
Cash-on-Cash Return
-5.6%
Cap rate
0.4%
Rent to Value Ratio
Active
$3,950,000
4
bds
|
4
ba
|
3,270
sqft
|
built
1964
4310 Santa Maria St, Coral Gables, FL 33146
$-15,249
Cash flow
-20.1%
Cash-on-Cash Return
1.5%
Cap rate
0.2%
Rent to Value Ratio

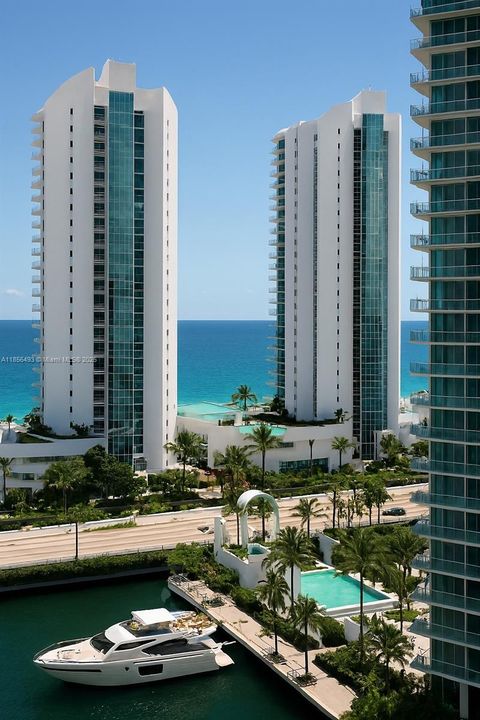
Active
$505,000
1
bds
|
2
ba
|
725
sqft
|
built
1967
240 Galen Dr, Key Biscayne, FL 33149
$-907
Cash flow
-9.4%
Cash-on-Cash Return
4.0%
Cap rate
0.6%
Rent to Value Ratio
Active
$2,000,000
2
bds
|
3
ba
|
1,878
sqft
|
built
2004
1331 Brickell Bay Dr, Miami, FL 33131
$-7,492
Cash flow
-19.5%
Cash-on-Cash Return
1.7%
Cap rate
0.6%
Rent to Value Ratio
Active
$340,000
1
bds
|
1
ba
|
720
sqft
|
built
2004
6001 SW 70th St, South Miami, FL 33143
$-1,111
Cash flow
-17.0%
Cash-on-Cash Return
2.2%
Cap rate
0.6%
Rent to Value Ratio
Active
$290,000
2
bds
|
2
ba
|
904
sqft
|
built
1980
2350 NE 135th St, North Miami, FL 33181
$-1,024
Cash flow
-18.4%
Cash-on-Cash Return
1.9%
Cap rate
0.9%
Rent to Value Ratio
Active
$465,000
3
bds
|
2
ba
|
2,799
sqft
|
built
2005
13994 SW 278th St, Homestead, FL 33032
$-914
Cash flow
-10.3%
Cash-on-Cash Return
3.8%
Cap rate
0.7%
Rent to Value Ratio

Active
$529,900
3
bds
|
2
ba
|
1,644
sqft
|
built
1976
30721 SW 150th Ave, Homestead, FL 33033
$-692
Cash flow
-6.8%
Cash-on-Cash Return
4.6%
Cap rate
0.6%
Rent to Value Ratio
Active
$485,000
3
bds
|
3
ba
|
1,420
sqft
|
built
2001
5737 NW 114th Path, Doral, FL 33178
$-1,145
Cash flow
-12.3%
Cash-on-Cash Return
3.3%
Cap rate
0.6%
Rent to Value Ratio
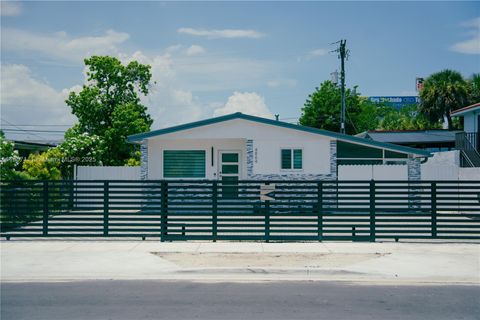
Active
$395,000
2
bds
|
2
ba
|
940
sqft
|
built
1920
1483 NW 58th St, Miami, FL 33142
$-443
Cash flow
-5.9%
Cash-on-Cash Return
4.8%
Cap rate
0.7%
Rent to Value Ratio
Active
$1,199,000
4
bds
|
3
ba
|
2,424
sqft
|
built
1975
5864 SW 42nd Ter, Miami, FL 33155
$-3,505
Cash flow
-15.3%
Cash-on-Cash Return
2.6%
Cap rate
0.5%
Rent to Value Ratio
Active
$695,000
3
bds
|
2
ba
|
1,509
sqft
|
built
1956
10525 SW 112th St, Miami, FL 33176
$-1,357
Cash flow
-10.2%
Cash-on-Cash Return
3.8%
Cap rate
0.6%
Rent to Value Ratio
Active
$499,900
2
bds
|
2
ba
|
1,024
sqft
|
built
1997
3255 NE 184th St, Miami, FL 33160
$-629
Cash flow
-6.6%
Cash-on-Cash Return
4.6%
Cap rate
1.0%
Rent to Value Ratio
Active
$335,000
1
bds
|
2
ba
|
750
sqft
|
built
1995
2351 Douglas Rd, Miami, FL 33145
$-1,062
Cash flow
-16.5%
Cash-on-Cash Return
2.3%
Cap rate
0.7%
Rent to Value Ratio
Active
$520,000
3
bds
|
2
ba
|
1,378
sqft
|
built
1974
6501 SW 112th Ct, Miami, FL 33173
$-852
Cash flow
-8.5%
Cash-on-Cash Return
4.2%
Cap rate
0.6%
Rent to Value Ratio
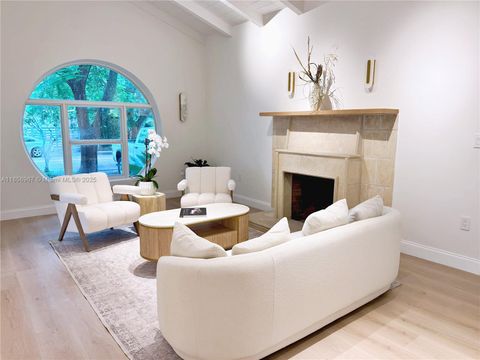
Active
$16,750,000
7
bds
|
8
ba
|
6,702
sqft
|
built
2008
8301 SW 53rd Ave, Miami, FL 33143
$-84,040
Cash flow
-26.2%
Cash-on-Cash Return
0.1%
Cap rate
0.1%
Rent to Value Ratio
Active
$1,698,000
3
bds
|
3
ba
|
1,890
sqft
|
built
1937
775 NE 76th St, Miami, FL 33138
$-7,987
Cash flow
-24.5%
Cash-on-Cash Return
0.5%
Cap rate
0.2%
Rent to Value Ratio
Active
$399,000
1
bds
|
1
ba
|
600
sqft
|
built
1966
2899 Collins Ave, Miami Beach, FL 33140
$-1,084
Cash flow
-14.2%
Cash-on-Cash Return
2.9%
Cap rate
0.6%
Rent to Value Ratio
Active
$525,000
3
bds
|
2
ba
|
1,320
sqft
|
built
1994
19999 E Country Club Dr, Aventura, FL 33180
$-1,914
Cash flow
-19.0%
Cash-on-Cash Return
1.8%
Cap rate
0.7%
Rent to Value Ratio
Active
$649,900
2
bds
|
2
ba
|
1,129
sqft
|
built
2018
16385 Biscayne Blvd, Aventura, FL 33160
$-2,693
Cash flow
-21.6%
Cash-on-Cash Return
1.2%
Cap rate
0.6%
Rent to Value Ratio
Active
$979,900
4
bds
|
2
ba
|
2,149
sqft
|
built
1973
17222 SW 88th Ave, Palmetto Bay, FL 33157
$-767
Cash flow
-4.1%
Cash-on-Cash Return
5.2%
Cap rate
0.7%
Rent to Value Ratio
Active
$699,900
4
bds
|
3
ba
|
2,111
sqft
|
built
1957
18441 NE 21st Ave, North Miami Beach, FL 33179
$-1,778
Cash flow
-13.3%
Cash-on-Cash Return
3.1%
Cap rate
0.5%
Rent to Value Ratio
Active
$920,000
3
bds
|
2
ba
|
1,492
sqft
|
built
2010
250 Sunny Isles Blvd, Sunny Isles Beach, FL 33160
$-3,165
Cash flow
-17.9%
Cash-on-Cash Return
2.0%
Cap rate
0.7%
Rent to Value Ratio