Miami Dade County Investment Properties for Sale
Browse homes for sale and investment properties in Miami Dade County. Refine your search by price, property type, or more.
Best cash flowing properties in Miami Dade County
Active
$190,000
1
bds
|
2
ba
|
790
sqft
|
built
1969
2841 NE 163rd St, North Miami Beach, FL 33160
$-421
Cash flow
-11.6%
Cash-on-Cash Return
3.5%
Cap rate
1.1%
Rent to Value Ratio
Active
$137,500
1
bds
|
1
ba
|
826
sqft
|
built
1972
486 NW 165th Street Rd, Miami, FL 33169
$-429
Cash flow
-16.3%
Cash-on-Cash Return
2.4%
Cap rate
1.2%
Rent to Value Ratio
10,000 out of 13,679 properties for sale in Miami Dade County
Limited Results Shown
Create a free account, or log in to reveal all property listings and enjoy the complete experience.
Active
$420,000
2
bds
|
2
ba
|
1,360
sqft
|
built
1971
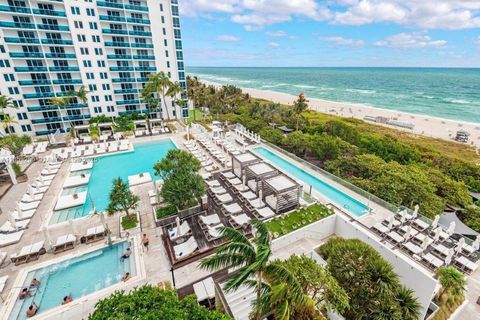
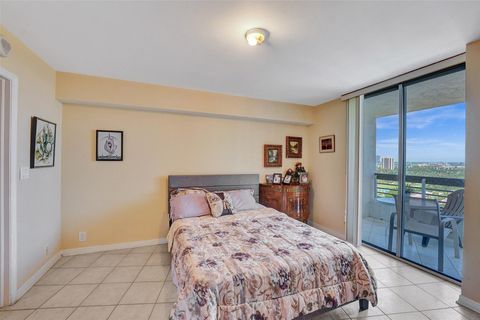
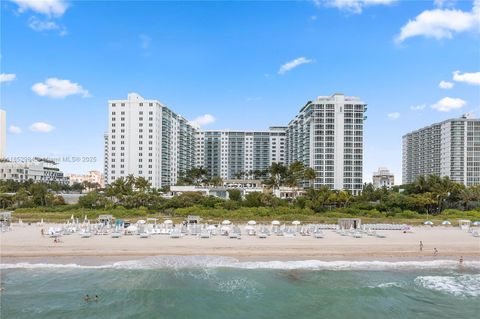
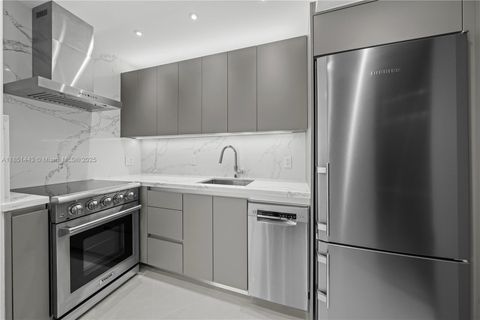
6039 Collins Ave, Miami Beach, FL 33140
$-1,493
Cash flow
-18.5%
Cash-on-Cash Return
1.9%
Cap rate
0.8%
Rent to Value Ratio
Active
$650,000
5
bds
|
5
ba
|
1,543
sqft
|
built
1953
19361 NW 1st Ct, Miami Gardens, FL 33169
$-1,350
Cash flow
-10.8%
Cash-on-Cash Return
3.7%
Cap rate
0.6%
Rent to Value Ratio
Active
$529,998
2
bds
|
2
ba
|
1,120
sqft
|
built
1969
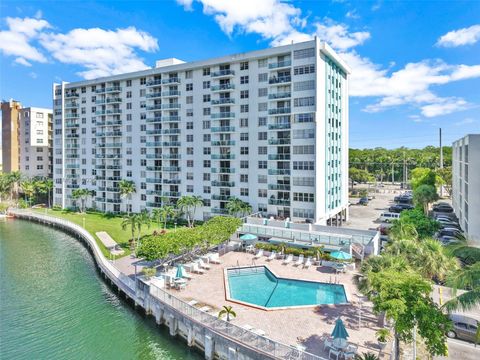
500 Bayview Dr, Sunny Isles Beach, FL 33160
$-1,985
Cash flow
-19.5%
Cash-on-Cash Return
1.7%
Cap rate
0.7%
Rent to Value Ratio
Active
$4,326,000
3
bds
|
4
ba
|
2,292
sqft
|
built
2019
18975 Collins Ave, Sunny Isles Beach, FL 33160
$-21,981
Cash flow
-26.5%
Cash-on-Cash Return
0.0%
Cap rate
0.3%
Rent to Value Ratio
Active
$490,000
2
bds
|
2
ba
|
1,187
sqft
|
built
1987
3610 Yacht Club Dr, Aventura, FL 33180
$-1,973
Cash flow
-21.0%
Cash-on-Cash Return
1.3%
Cap rate
0.7%
Rent to Value Ratio
Active
$550,000
3
bds
|
2
ba
|
1,403
sqft
|
built
1969
1239 Mariposa Ave, Coral Gables, FL 33146
$-1,483
Cash flow
-14.1%
Cash-on-Cash Return
2.9%
Cap rate
0.7%
Rent to Value Ratio
Active
$5,195,000
6
bds
|
5
ba
|
5,849
sqft
|
built
1992
10600 SW 69th Ave, Pinecrest, FL 33156
$-23,377
Cash flow
-23.5%
Cash-on-Cash Return
0.7%
Cap rate
0.2%
Rent to Value Ratio
Active
$1,100,000
4
bds
|
2
ba
|
1,596
sqft
|
built
1951
141 NW 89th St, El Portal, FL 33150
$-2,778
Cash flow
-13.2%
Cash-on-Cash Return
3.1%
Cap rate
0.4%
Rent to Value Ratio
Active
$269,000
1
bds
|
2
ba
|
887
sqft
|
built
1971
2780 NE 183rd St, Aventura, FL 33160
$-816
Cash flow
-15.8%
Cash-on-Cash Return
2.5%
Cap rate
0.9%
Rent to Value Ratio
Active
$1,299,900
4
bds
|
3
ba
|
1,770
sqft
|
built
1976
1900 SW 24th St, Miami, FL 33145
$-3,095
Cash flow
-12.4%
Cash-on-Cash Return
3.3%
Cap rate
0.4%
Rent to Value Ratio
Active
$419,000
3
bds
|
2
ba
|
1,185
sqft
|
built
2005
6831 SW 44th St, Miami, FL 33155
$-1,103
Cash flow
-13.7%
Cash-on-Cash Return
3.0%
Cap rate
0.8%
Rent to Value Ratio
Active
$650,000
2
bds
|
2
ba
|
1,200
sqft
|
built
2008
55 SE 6th St, Miami, FL 33131
$-2,801
Cash flow
-22.5%
Cash-on-Cash Return
1.0%
Cap rate
0.7%
Rent to Value Ratio
Active
$400,000
bds
|
1
ba
|
655
sqft
|
built
2008
3301 NE 1st Ave, Miami, FL 33137
$-1,261
Cash flow
-16.4%
Cash-on-Cash Return
2.4%
Cap rate
0.8%
Rent to Value Ratio
Active
$225,000
1
bds
|
2
ba
|
865
sqft
|
built
1971
3660 NE 166th St, North Miami Beach, FL 33160
$-793
Cash flow
-18.4%
Cash-on-Cash Return
1.9%
Cap rate
0.9%
Rent to Value Ratio
Active
$230,000
3
bds
|
2
ba
|
1,076
sqft
|
built
2006
1568 SE 26th St, Homestead, FL 33035
$-466
Cash flow
-10.6%
Cash-on-Cash Return
3.7%
Cap rate
0.9%
Rent to Value Ratio
Active
$369,999
1
bds
|
2
ba
|
860
sqft
|
built
1980
555 NE 15th St, Miami, FL 33132
$-1,559
Cash flow
-22.0%
Cash-on-Cash Return
1.1%
Cap rate
0.8%
Rent to Value Ratio
Active
$639,900
3
bds
|
2
ba
|
1,487
sqft
|
built
1993
13400 SW 182nd St, Miami, FL 33177
$-1,087
Cash flow
-8.9%
Cash-on-Cash Return
4.1%
Cap rate
0.5%
Rent to Value Ratio
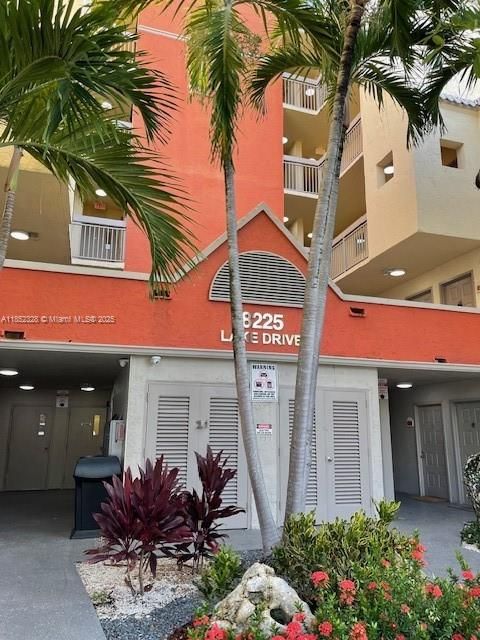
Active
$280,000
1
bds
|
1
ba
|
810
sqft
|
built
1989
8225 Lake Dr, Doral, FL 33166
$-762
Cash flow
-14.2%
Cash-on-Cash Return
2.9%
Cap rate
0.7%
Rent to Value Ratio
Active
$1,200,000
bds
|
1
ba
|
600
sqft
|
built
1926
2301 Collins Ave, Miami Beach, FL 33139
$-2,239
Cash flow
-9.7%
Cash-on-Cash Return
3.9%
Cap rate
0.7%
Rent to Value Ratio
Active
$500,000
2
bds
|
2
ba
|
1,181
sqft
|
built
1991
3530 Mystic Pointe Dr, Aventura, FL 33180
$-744
Cash flow
-7.8%
Cash-on-Cash Return
4.4%
Cap rate
0.6%
Rent to Value Ratio
Active
$725,000
bds
|
1
ba
|
660
sqft
|
built
1926
2301 Collins Ave, Miami Beach, FL 33139
$-1,692
Cash flow
-12.2%
Cash-on-Cash Return
3.3%
Cap rate
0.8%
Rent to Value Ratio
Active
$608,888
2
bds
|
2
ba
|
990
sqft
|
built
1970
999 Brickell Bay Dr, Miami, FL 33131
$-2,231
Cash flow
-19.1%
Cash-on-Cash Return
1.8%
Cap rate
0.5%
Rent to Value Ratio
Active
$675,000
2
bds
|
2
ba
|
1,100
sqft
|
built
1974
2333 Brickell Ave, Miami, FL 33129
$-2,189
Cash flow
-16.9%
Cash-on-Cash Return
2.3%
Cap rate
0.7%
Rent to Value Ratio
Active
$950,000
4
bds
|
2
ba
|
2,838
sqft
|
built
1979
19811 W Oakmont Dr, Hialeah, FL 33015
$-2,257
Cash flow
-12.4%
Cash-on-Cash Return
3.3%
Cap rate
0.5%
Rent to Value Ratio
Active
$275,000
2
bds
|
2
ba
|
862
sqft
|
built
1974
6625 W 4th Ave, Hialeah, FL 33012
$-510
Cash flow
-9.7%
Cash-on-Cash Return
3.9%
Cap rate
0.8%
Rent to Value Ratio
Active
$1,850,000
3
bds
|
5
ba
|
3,195
sqft
|
built
2004
3915 NE 168th St, North Miami Beach, FL 33160
$-7,428
Cash flow
-20.9%
Cash-on-Cash Return
1.3%
Cap rate
0.4%
Rent to Value Ratio
Active
$222,000
1
bds
|
2
ba
|
865
sqft
|
built
1971
3660 NE 166th St, North Miami Beach, FL 33160
$-797
Cash flow
-18.7%
Cash-on-Cash Return
1.8%
Cap rate
0.9%
Rent to Value Ratio
Active
$510,000
bds
|
1
ba
|
362
sqft
|
built
2022
398 NE 5th St, Miami, FL 33132
$-1,607
Cash flow
-16.4%
Cash-on-Cash Return
2.4%
Cap rate
0.7%
Rent to Value Ratio
Active
$1,099,999
5
bds
|
5
ba
|
3,982
sqft
|
built
2006
7512 SW 187th St, Cutler Bay, FL 33157
$-2,367
Cash flow
-11.2%
Cash-on-Cash Return
3.6%
Cap rate
0.7%
Rent to Value Ratio
Active
$599,000
5
bds
|
3
ba
|
2,656
sqft
|
built
2007
557 SE 37th Pl, Homestead, FL 33033
$-1,467
Cash flow
-12.8%
Cash-on-Cash Return
3.2%
Cap rate
0.6%
Rent to Value Ratio
Active
$2,300,000
3
bds
|
4
ba
|
2,293
sqft
|
built
2001
848 Brickell Key Dr, Miami, FL 33131
$-9,587
Cash flow
-21.7%
Cash-on-Cash Return
1.1%
Cap rate
0.4%
Rent to Value Ratio
Active
$295,000
2
bds
|
3
ba
|
1,431
sqft
|
built
2005
2444 SE 19th Ct, Homestead, FL 33035
$-849
Cash flow
-15.0%
Cash-on-Cash Return
2.7%
Cap rate
0.8%
Rent to Value Ratio
Active
$569,000
3
bds
|
2
ba
|
1,903
sqft
|
built
2006
23824 SW 107th Pl, Homestead, FL 33032
$-1,507
Cash flow
-13.8%
Cash-on-Cash Return
3.0%
Cap rate
0.6%
Rent to Value Ratio
Active
$442,000
2
bds
|
1
ba
|
864
sqft
|
built
1980
4501 SW 136th Pl, Miami, FL 33175
$-704
Cash flow
-8.3%
Cash-on-Cash Return
4.2%
Cap rate
0.6%
Rent to Value Ratio
Active
$415,000
2
bds
|
2
ba
|
1,312
sqft
|
built
1981
2000 Towerside Ter, Miami, FL 33138
$-2,064
Cash flow
-25.9%
Cash-on-Cash Return
0.2%
Cap rate
0.7%
Rent to Value Ratio
Active
$1,125,000
2
bds
|
2
ba
|
1,630
sqft
|
built
1967
9250 W Bay Harbor Dr, Bay Harbor Islands, FL 33154
$-3,857
Cash flow
-17.9%
Cash-on-Cash Return
2.0%
Cap rate
0.5%
Rent to Value Ratio
Active
$1,300,000
2
bds
|
3
ba
|
1,524
sqft
|
built
2019
330 Sunny Isles Blvd, Sunny Isles Beach, FL 33160
$-4,881
Cash flow
-19.6%
Cash-on-Cash Return
1.6%
Cap rate
0.5%
Rent to Value Ratio
Active
$375,000
2
bds
|
3
ba
|
1,520
sqft
|
built
1987
425 W Park Dr, Miami, FL 33172
$-798
Cash flow
-11.1%
Cash-on-Cash Return
3.6%
Cap rate
0.7%
Rent to Value Ratio