Miami Dade County Investment Properties for Sale
Browse homes for sale and investment properties in Miami Dade County. Refine your search by price, property type, or more.
Best cash flowing properties in Miami Dade County

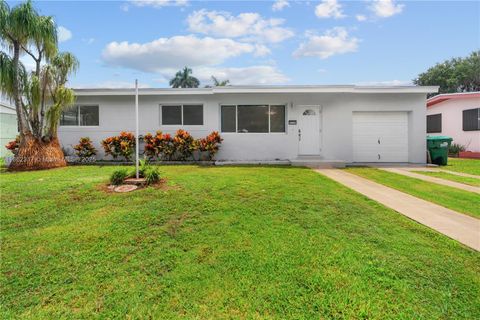
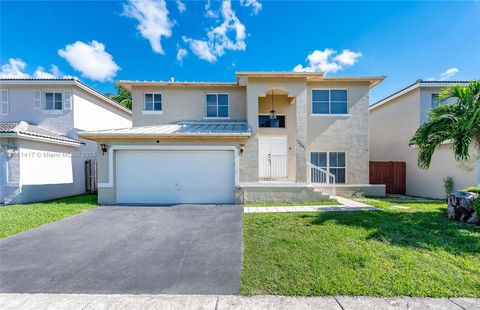
Active
$389,900
3
bds
|
2
ba
|
1,439
sqft
|
built
1957
18200 NW 9th Ave, Miami, FL 33169
$-454
Cash flow
-6.1%
Cash-on-Cash Return
4.7%
Cap rate
0.8%
Rent to Value Ratio

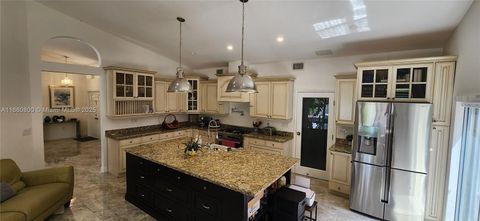
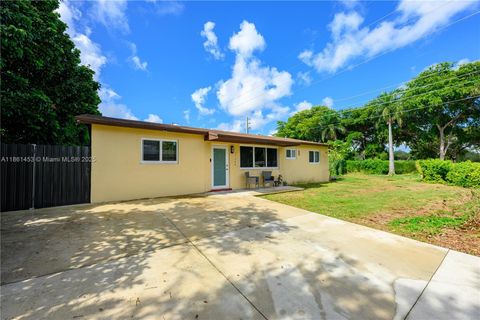
Active
$425,555
3
bds
|
1
ba
|
1,141
sqft
|
built
1947
1875 NW 53rd St, Miami, FL 33142
$-528
Cash flow
-6.5%
Cash-on-Cash Return
4.7%
Cap rate
0.7%
Rent to Value Ratio
3,961 out of 4,230 properties for sale in Miami Dade County
Limited Results Shown
Create a free account, or log in to reveal all property listings and enjoy the complete experience.
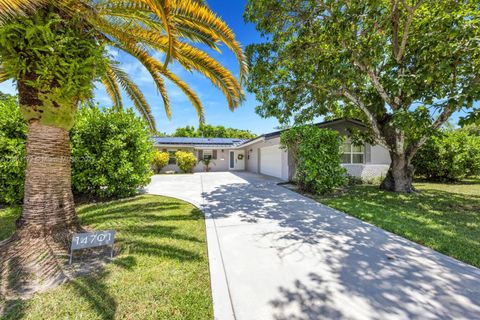
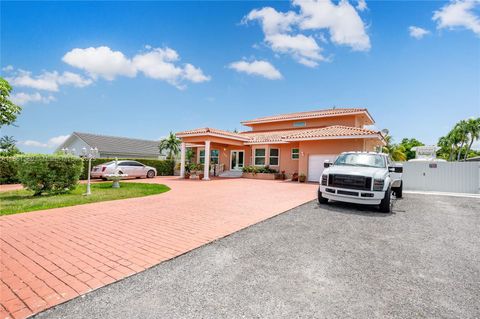
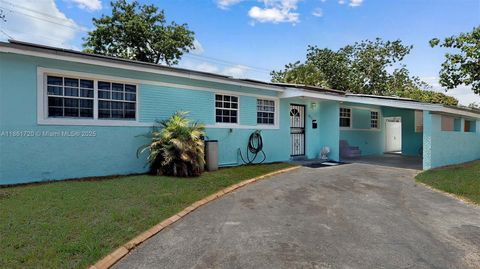
Active
$1,200,000
3
bds
|
3
ba
|
1,817
sqft
|
built
1960
14701 SW 84th Ct, Palmetto Bay, FL 33158
$-2,962
Cash flow
-12.9%
Cash-on-Cash Return
3.2%
Cap rate
0.5%
Rent to Value Ratio

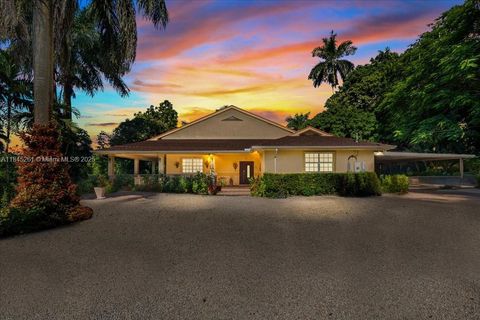
Active
$530,000
3
bds
|
1
ba
|
1,268
sqft
|
built
1940
9156 NW 5th Ave, Miami, FL 33150
$-1,350
Cash flow
-13.3%
Cash-on-Cash Return
3.1%
Cap rate
0.6%
Rent to Value Ratio

Active
$1,299,000
4
bds
|
2
ba
|
2,057
sqft
|
built
1975
12505 SW 99th Ave, Miami, FL 33176
$-3,636
Cash flow
-14.6%
Cash-on-Cash Return
2.8%
Cap rate
0.4%
Rent to Value Ratio

Active
$1,600,000
5
bds
|
4
ba
|
3,174
sqft
|
built
2023
457 Lafayette Dr, Miami Springs, FL 33166
$-3,599
Cash flow
-11.7%
Cash-on-Cash Return
3.4%
Cap rate
0.5%
Rent to Value Ratio
Active
$625,000
3
bds
|
2
ba
|
1,528
sqft
|
built
1987
2840 SW 132nd Ct, Miami, FL 33175
$-925
Cash flow
-7.7%
Cash-on-Cash Return
4.4%
Cap rate
0.6%
Rent to Value Ratio
Active
$1,195,000
3
bds
|
3
ba
|
2,193
sqft
|
built
1975
6841 SW 48th St, Miami, FL 33155
$-1,309
Cash flow
-5.7%
Cash-on-Cash Return
4.8%
Cap rate
0.7%
Rent to Value Ratio
Active
$719,000
3
bds
|
2
ba
|
1,733
sqft
|
built
1991
14364 SW 113th Ter, Miami, FL 33186
$-1,729
Cash flow
-12.5%
Cash-on-Cash Return
3.3%
Cap rate
0.4%
Rent to Value Ratio

Active
$594,999
3
bds
|
2
ba
|
1,352
sqft
|
built
1994
20990 SW 119th Ct, Miami, FL 33177
$-1,037
Cash flow
-9.1%
Cash-on-Cash Return
4.1%
Cap rate
0.5%
Rent to Value Ratio
Active
$3,560,000
5
bds
|
4
ba
|
2,429
sqft
|
built
1951
677 Hampton Ln, Key Biscayne, FL 33149
$-13,696
Cash flow
-20.1%
Cash-on-Cash Return
1.5%
Cap rate
0.3%
Rent to Value Ratio
Active
$12,900,000
6
bds
|
7
ba
|
5,960
sqft
|
built
2005
365 Gulf Rd, Key Biscayne, FL 33149
$-65,096
Cash flow
-26.3%
Cash-on-Cash Return
0.1%
Cap rate
0.1%
Rent to Value Ratio
Active
$849,000
3
bds
|
2
ba
|
1,612
sqft
|
built
1957
8560 SW 27th Ln, Miami, FL 33155
$-2,073
Cash flow
-12.7%
Cash-on-Cash Return
3.2%
Cap rate
0.4%
Rent to Value Ratio
Active
$1,048,888
5
bds
|
4
ba
|
2,487
sqft
|
built
1988
6775 SW 103rd Ct, Miami, FL 33173
$-1,890
Cash flow
-9.4%
Cash-on-Cash Return
4.0%
Cap rate
0.6%
Rent to Value Ratio
Active
$480,000
3
bds
|
1
ba
|
1,700
sqft
|
built
1953
3515 NW 98th St, Miami, FL 33147
$-728
Cash flow
-7.9%
Cash-on-Cash Return
4.3%
Cap rate
0.6%
Rent to Value Ratio
Active
$1,299,999
5
bds
|
3
ba
|
2,821
sqft
|
built
2016
27410 SW 172nd Ave, Homestead, FL 33031
$-3,881
Cash flow
-15.6%
Cash-on-Cash Return
2.6%
Cap rate
0.4%
Rent to Value Ratio
Active
$800,000
3
bds
|
3
ba
|
2,460
sqft
|
built
2017
3392 W 103rd Ter, Hialeah, FL 33018
$-2,237
Cash flow
-14.6%
Cash-on-Cash Return
2.8%
Cap rate
0.5%
Rent to Value Ratio

Active
$2,500,000
5
bds
|
4
ba
|
3,582
sqft
|
built
1979
17640 Old Cutler Rd, Palmetto Bay, FL 33157
$-6,841
Cash flow
-14.3%
Cash-on-Cash Return
2.9%
Cap rate
0.4%
Rent to Value Ratio

Active
$629,000
3
bds
|
3
ba
|
1,540
sqft
|
built
2022
18700 SW 117th Ave, Miami, FL 33177
$-1,480
Cash flow
-12.3%
Cash-on-Cash Return
3.3%
Cap rate
0.6%
Rent to Value Ratio
Active
$3,900,000
3
bds
|
2
ba
|
2,852
sqft
|
built
1948
4445 N Michigan Ave, Miami Beach, FL 33140
$-17,341
Cash flow
-23.2%
Cash-on-Cash Return
0.8%
Cap rate
0.2%
Rent to Value Ratio
Active
$615,000
3
bds
|
2
ba
|
1,707
sqft
|
built
1953
275 E 34th St, Hialeah, FL 33013
$-824
Cash flow
-7.0%
Cash-on-Cash Return
4.5%
Cap rate
0.6%
Rent to Value Ratio
Active
$520,000
3
bds
|
1
ba
|
1,185
sqft
|
built
1956
1770 NW 9th St, Homestead, FL 33030
$-1,034
Cash flow
-10.4%
Cash-on-Cash Return
3.8%
Cap rate
0.5%
Rent to Value Ratio

Active
$500,000
3
bds
|
2
ba
|
1,341
sqft
|
built
1959
1301 NW 175th St, Miami Gardens, FL 33169
$-899
Cash flow
-9.4%
Cash-on-Cash Return
4.0%
Cap rate
0.6%
Rent to Value Ratio
Active
$774,900
3
bds
|
2
ba
|
1,943
sqft
|
built
1992
19922 NW 88th Ave, Hialeah, FL 33018
$-1,501
Cash flow
-10.1%
Cash-on-Cash Return
3.8%
Cap rate
0.7%
Rent to Value Ratio
Active
$1,455,000
4
bds
|
5
ba
|
2,718
sqft
|
built
1992
13926 SW 14th St, Miami, FL 33184
$-3,888
Cash flow
-13.9%
Cash-on-Cash Return
2.9%
Cap rate
0.4%
Rent to Value Ratio
Active
$1,300,000
3
bds
|
3
ba
|
2,608
sqft
|
built
2002
23600 SW 187th Ave, Homestead, FL 33031
$-4,323
Cash flow
-17.3%
Cash-on-Cash Return
2.2%
Cap rate
0.3%
Rent to Value Ratio
Active
$1,650,000
4
bds
|
3
ba
|
2,662
sqft
|
built
1964
8355 SW 89th St, Miami, FL 33156
$-2,717
Cash flow
-8.6%
Cash-on-Cash Return
4.2%
Cap rate
0.5%
Rent to Value Ratio
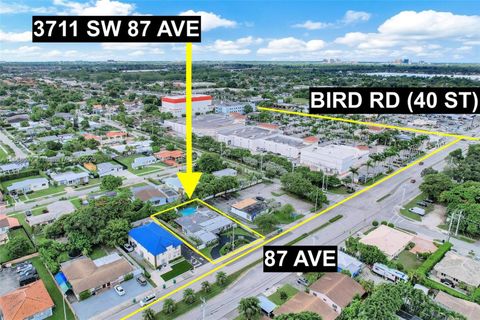
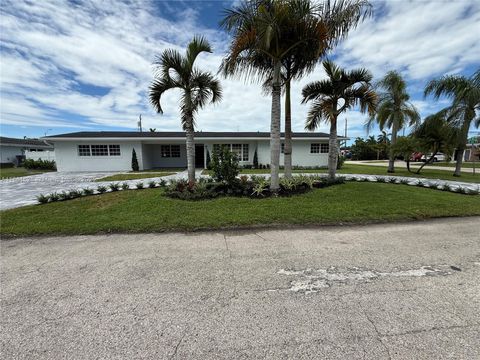
Active
$1,600,000
4
bds
|
3
ba
|
2,928
sqft
|
built
1954
3711 SW 87th Ave, Miami, FL 33165
$-4,986
Cash flow
-16.3%
Cash-on-Cash Return
2.4%
Cap rate
0.3%
Rent to Value Ratio
Active
$825,000
4
bds
|
3
ba
|
3,042
sqft
|
built
1994
26605 SW 173rd Ct, Homestead, FL 33031
$-1,074
Cash flow
-6.8%
Cash-on-Cash Return
4.6%
Cap rate
0.7%
Rent to Value Ratio
Active
$830,000
4
bds
|
3
ba
|
2,393
sqft
|
built
2018
15012 SW 177th Ter, Miami, FL 33187
$-1,142
Cash flow
-7.2%
Cash-on-Cash Return
4.5%
Cap rate
0.6%
Rent to Value Ratio
Active
$455,000
2
bds
|
1
ba
|
720
sqft
|
built
1957
2930 NW 90th St, Miami, FL 33147
$-1,153
Cash flow
-13.2%
Cash-on-Cash Return
3.1%
Cap rate
0.5%
Rent to Value Ratio
Active
$510,000
3
bds
|
2
ba
|
1,286
sqft
|
built
1987
2141 W 53rd St, Hialeah, FL 33016
$-712
Cash flow
-7.3%
Cash-on-Cash Return
4.5%
Cap rate
0.6%
Rent to Value Ratio
Active
$7,595,000
6
bds
|
6
ba
|
6,530
sqft
|
built
2020
6175 SW 128th St, Pinecrest, FL 33156
$-40,624
Cash flow
-27.9%
Cash-on-Cash Return
-0.3%
Cap rate
0.1%
Rent to Value Ratio

Active
$669,000
4
bds
|
3
ba
|
2,532
sqft
|
built
1996
16611 SW 103rd Ter, Miami, FL 33196
$-829
Cash flow
-6.5%
Cash-on-Cash Return
4.7%
Cap rate
0.6%
Rent to Value Ratio
Active
$799,000
4
bds
|
2
ba
|
1,650
sqft
|
built
1976
7302 SW 134th Pl, Miami, FL 33183
$-1,631
Cash flow
-10.7%
Cash-on-Cash Return
3.7%
Cap rate
0.6%
Rent to Value Ratio
Active
$1,200,000
5
bds
|
4
ba
|
2,702
sqft
|
built
2013
19220 NE 9th Pl, Miami, FL 33179
$-4,038
Cash flow
-17.6%
Cash-on-Cash Return
2.1%
Cap rate
0.5%
Rent to Value Ratio
Active
$2,465,000
4
bds
|
3
ba
|
2,465
sqft
|
built
1978
1019 Venetia Ave, Coral Gables, FL 33134
$-8,830
Cash flow
-18.7%
Cash-on-Cash Return
1.8%
Cap rate
0.3%
Rent to Value Ratio
Active
$569,900
4
bds
|
3
ba
|
1,820
sqft
|
built
1998
12091 SW 250th Ter, Homestead, FL 33032
$-1,107
Cash flow
-10.1%
Cash-on-Cash Return
3.8%
Cap rate
0.6%
Rent to Value Ratio
Active
$515,900
4
bds
|
2
ba
|
1,216
sqft
|
built
1971
15640 SW 295th Ter, Homestead, FL 33033
$-873
Cash flow
-8.8%
Cash-on-Cash Return
4.1%
Cap rate
0.7%
Rent to Value Ratio
Active
$599,999
3
bds
|
2
ba
|
1,690
sqft
|
built
1960
18502 NW 23rd Ct, Miami Gardens, FL 33056
$-1,359
Cash flow
-11.8%
Cash-on-Cash Return
3.4%
Cap rate
0.7%
Rent to Value Ratio