Miami Dade County Investment Properties for Sale
Browse homes for sale and investment properties in Miami Dade County. Refine your search by price, property type, or more.
Best cash flowing properties in Miami Dade County
Active
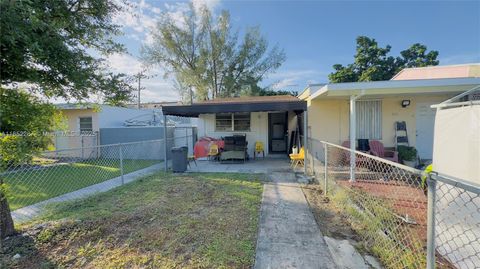
$340,000
2
bds
|
2
ba
|
728
sqft
|
built
1965
509 E 21st St, Hialeah, FL 33013
$-256
Cash flow
-3.9%
Cash-on-Cash Return
5.2%
Cap rate
0.6%
Rent to Value Ratio
Active
$173,000
1
bds
|
1
ba
|
635
sqft
|
built
1968
7370 SW 82nd St, Miami, FL 33143
$-326
Cash flow
-9.8%
Cash-on-Cash Return
3.9%
Cap rate
1.0%
Rent to Value Ratio
10,000 out of 13,645 properties for sale in Miami Dade County
Limited Results Shown
Create a free account, or log in to reveal all property listings and enjoy the complete experience.
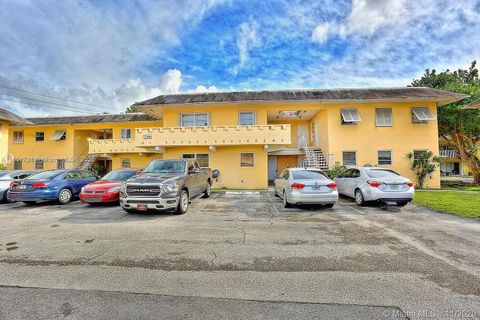
Active
$650,000
3
bds
|
2
ba
|
1,267
sqft
|
built
1947
10851 NE 2nd Ct, Miami, FL 33161
$-1,189
Cash flow
-9.5%
Cash-on-Cash Return
4.0%
Cap rate
0.6%
Rent to Value Ratio
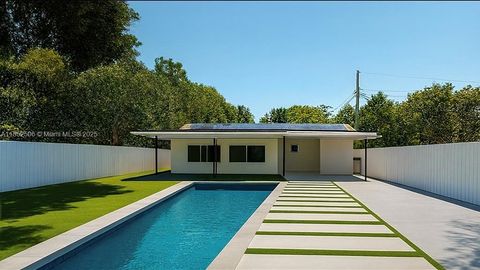
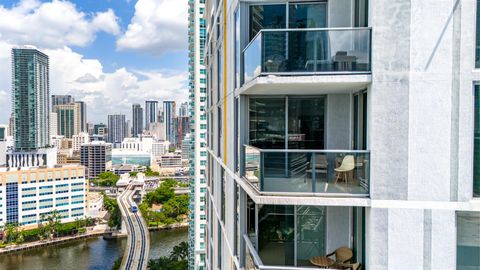
Active
$549,000
2
bds
|
2
ba
|
1,111
sqft
|
built
2007
3250 NE 1st Ave, Miami, FL 33137
$-2,352
Cash flow
-22.4%
Cash-on-Cash Return
1.0%
Cap rate
0.7%
Rent to Value Ratio
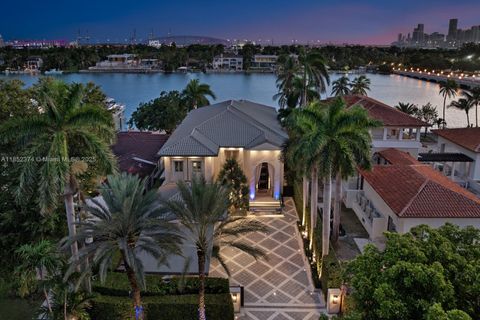
Active
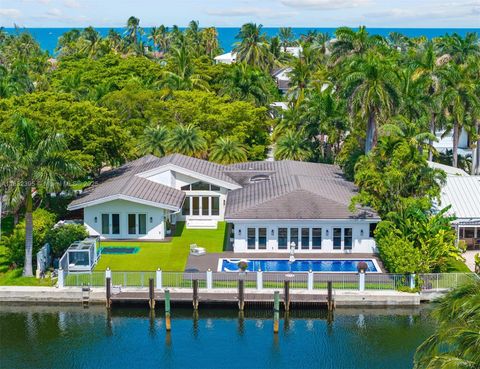
$18,900,000
6
bds
|
7
ba
|
6,211
sqft
|
built
2002
176 S Hibiscus Dr, Miami Beach, FL 33139
$-104,030
Cash flow
-28.7%
Cash-on-Cash Return
-0.5%
Cap rate
0.0%
Rent to Value Ratio
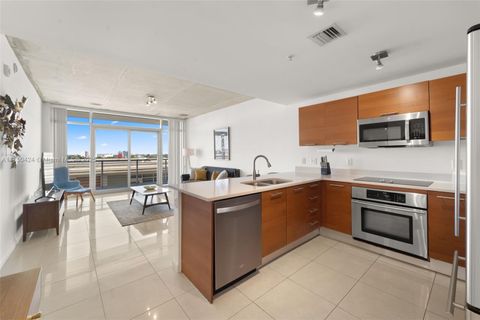
Active
$515,000
1
bds
|
2
ba
|
950
sqft
|
built
1967
5 Island Ave, Miami Beach, FL 33139
$-2,151
Cash flow
-21.8%
Cash-on-Cash Return
1.1%
Cap rate
0.8%
Rent to Value Ratio
Active
$895,000
2
bds
|
2
ba
|
1,935
sqft
|
built
1967
5640 Collins Ave, Miami, FL 33140
$-2,967
Cash flow
-17.3%
Cash-on-Cash Return
2.2%
Cap rate
0.6%
Rent to Value Ratio
Active
$545,000
2
bds
|
2
ba
|
1,290
sqft
|
built
1971
6039 Collins Ave, Miami Beach, FL 33140
$-2,179
Cash flow
-20.9%
Cash-on-Cash Return
1.3%
Cap rate
0.6%
Rent to Value Ratio
Active
$560,000
1
bds
|
2
ba
|
1,095
sqft
|
built
2007
1800 N Bayshore Dr, Miami, FL 33132
$-1,665
Cash flow
-15.5%
Cash-on-Cash Return
2.6%
Cap rate
0.7%
Rent to Value Ratio
Active
$270,000
2
bds
|
2
ba
|
914
sqft
|
built
1981
9686 Fontainebleau Blvd, Miami, FL 33172
$-428
Cash flow
-8.3%
Cash-on-Cash Return
4.2%
Cap rate
0.9%
Rent to Value Ratio
Active
$1,100,000
2
bds
|
3
ba
|
1,251
sqft
|
built
2017
2900 NE 7th Ave, Miami, FL 33137
$-3,590
Cash flow
-17.0%
Cash-on-Cash Return
2.2%
Cap rate
0.6%
Rent to Value Ratio
Active
$574,900
4
bds
|
0
ba
|
1,320
sqft
|
built
1950
6720 NW 4th Ave, Miami, FL 33150
$-2,104
Cash flow
-19.1%
Cash-on-Cash Return
1.8%
Cap rate
0.3%
Rent to Value Ratio
Active
$819,000
2
bds
|
3
ba
|
1,088
sqft
|
built
2007
3470 E Coast Ave, Miami, FL 33137
$-1,720
Cash flow
-11.0%
Cash-on-Cash Return
3.6%
Cap rate
0.6%
Rent to Value Ratio
Active
$874,900
4
bds
|
2
ba
|
2,199
sqft
|
built
1979
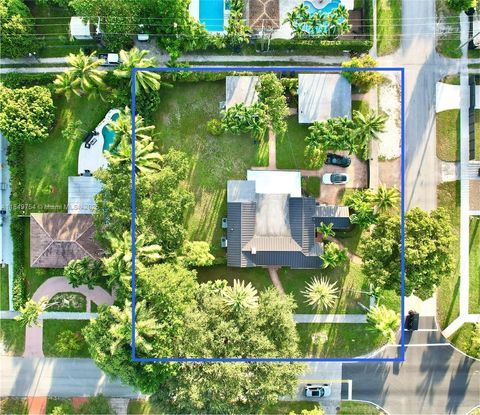
13262 SW 102nd Ter, Miami, FL 33186
$-2,080
Cash flow
-12.4%
Cash-on-Cash Return
3.3%
Cap rate
0.5%
Rent to Value Ratio
Active
$450,000
2
bds
|
2
ba
|
1,520
sqft
|
built
1981
1000 Quayside Ter, Miami, FL 33138
$-1,338
Cash flow
-15.5%
Cash-on-Cash Return
2.6%
Cap rate
0.7%
Rent to Value Ratio
Active
$1,300,000
3
bds
|
2
ba
|
1,676
sqft
|
built
1942
2219 SW 9th Ave, Miami, FL 33129
$-4,350
Cash flow
-17.5%
Cash-on-Cash Return
2.1%
Cap rate
0.4%
Rent to Value Ratio
Active
$995,000
3
bds
|
3
ba
|
1,304
sqft
|
built
2013
6700 Indian Creek Dr, Miami Beach, FL 33141
$-3,068
Cash flow
-16.1%
Cash-on-Cash Return
2.4%
Cap rate
0.9%
Rent to Value Ratio
Active
$699,999
6
bds
|
2
ba
|
1,688
sqft
|
built
1934
920 SW 8th Ct, Miami, FL 33130
$-1,468
Cash flow
-10.9%
Cash-on-Cash Return
3.6%
Cap rate
0.5%
Rent to Value Ratio
Active
$210,000
1
bds
|
2
ba
|
755
sqft
|
built
1974
3675 N Country Club Dr, Aventura, FL 33180
$-496
Cash flow
-12.3%
Cash-on-Cash Return
3.3%
Cap rate
1.1%
Rent to Value Ratio
Active
$424,900
1
bds
|
2
ba
|
1,019
sqft
|
built
1961
5055 Collins Ave, Miami Beach, FL 33140
$-1,997
Cash flow
-24.5%
Cash-on-Cash Return
0.5%
Cap rate
0.7%
Rent to Value Ratio
Active
$525,000
2
bds
|
2
ba
|
940
sqft
|
built
1966
701 Collins Ave, Miami Beach, FL 33139
$-2,174
Cash flow
-21.6%
Cash-on-Cash Return
1.2%
Cap rate
0.5%
Rent to Value Ratio
Active
$239,000
1
bds
|
2
ba
|
1,066
sqft
|
built
1974
2801 NE 183rd St, Aventura, FL 33160
$-847
Cash flow
-18.5%
Cash-on-Cash Return
1.9%
Cap rate
0.9%
Rent to Value Ratio
Active
$729,900
3
bds
|
3
ba
|
1,840
sqft
|
built
1986
1717 N Bayshore Dr, Miami, FL 33132
$-2,127
Cash flow
-15.2%
Cash-on-Cash Return
2.7%
Cap rate
0.8%
Rent to Value Ratio
Active
$458,500
3
bds
|
3
ba
|
1,539
sqft
|
built
2022
9925 SW 228th Ter, Miami, FL 33190
$-1,294
Cash flow
-14.7%
Cash-on-Cash Return
2.8%
Cap rate
0.6%
Rent to Value Ratio
Active
$639,977
1
bds
|
2
ba
|
843
sqft
|
built
2017
45 SW 9th St, Miami, FL 33130
$-1,921
Cash flow
-15.7%
Cash-on-Cash Return
2.5%
Cap rate
0.6%
Rent to Value Ratio
Active
$800,000
4
bds
|
4
ba
|
1,997
sqft
|
built
2023
19447 SW 124th Ct, Miami, FL 33177
$-1,903
Cash flow
-12.4%
Cash-on-Cash Return
3.3%
Cap rate
0.6%
Rent to Value Ratio
Active
$1,375,000
5
bds
|
4
ba
|
2,848
sqft
|
built
2019
9220 SW 170th St, Palmetto Bay, FL 33157
$-2,458
Cash flow
-9.3%
Cash-on-Cash Return
4.0%
Cap rate
0.6%
Rent to Value Ratio
Active
$259,900
1
bds
|
2
ba
|
922
sqft
|
built
1972
20 NW 87th Ave, Miami, FL 33172
$-373
Cash flow
-7.5%
Cash-on-Cash Return
4.4%
Cap rate
0.8%
Rent to Value Ratio
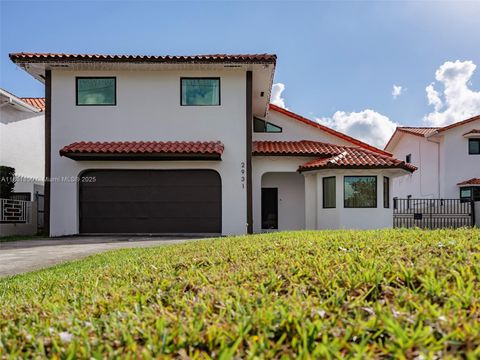
Active
$1,580,000
5
bds
|
4
ba
|
3,718
sqft
|
built
1989
2931 SW 117th Ave, Miami, FL 33175
$-2,605
Cash flow
-8.6%
Cash-on-Cash Return
4.2%
Cap rate
0.6%
Rent to Value Ratio
Active
$349,000
1
bds
|
2
ba
|
815
sqft
|
built
1970
5838 Collins Ave, Miami Beach, FL 33140
$-1,616
Cash flow
-24.2%
Cash-on-Cash Return
0.6%
Cap rate
0.6%
Rent to Value Ratio
Active
$690,000
3
bds
|
2
ba
|
1,763
sqft
|
built
1992
20848 SW 118th Ave, Miami, FL 33177
$-2,072
Cash flow
-15.7%
Cash-on-Cash Return
2.5%
Cap rate
0.4%
Rent to Value Ratio
Active
$490,000
2
bds
|
2
ba
|
1,129
sqft
|
built
2019
4636 NW 84th Ave, Doral, FL 33166
$-2,140
Cash flow
-22.8%
Cash-on-Cash Return
0.9%
Cap rate
0.5%
Rent to Value Ratio
Active
$319,000
1
bds
|
1
ba
|
836
sqft
|
built
2007
3001 NE 185th St, Miami, FL 33180
$-922
Cash flow
-15.1%
Cash-on-Cash Return
2.7%
Cap rate
0.9%
Rent to Value Ratio
Active
$395,000
3
bds
|
3
ba
|
1,150
sqft
|
built
1996
14224 SW 121st Pl, Miami, FL 33186
$-929
Cash flow
-12.3%
Cash-on-Cash Return
3.3%
Cap rate
0.7%
Rent to Value Ratio
Active
$1,549,999
2
bds
|
3
ba
|
2,084
sqft
|
built
2010
15811 Collins Ave, Sunny Isles Beach, FL 33160
$-7,151
Cash flow
-24.1%
Cash-on-Cash Return
0.6%
Cap rate
0.5%
Rent to Value Ratio
Active
$545,000
3
bds
|
2
ba
|
1,350
sqft
|
built
1994
19501 E Country Club Dr, Aventura, FL 33180
$-1,702
Cash flow
-16.3%
Cash-on-Cash Return
2.4%
Cap rate
0.7%
Rent to Value Ratio
Active
$1,599,000
7
bds
|
5
ba
|
3,536
sqft
|
built
1936
500 South Dr, Miami Springs, FL 33166
$-6,950
Cash flow
-22.7%
Cash-on-Cash Return
0.9%
Cap rate
0.2%
Rent to Value Ratio
Active
$8,995,000
7
bds
|
6
ba
|
4,596
sqft
|
built
1955
194 Golden Beach Dr, Golden Beach, FL 33160
$-51,181
Cash flow
-29.7%
Cash-on-Cash Return
-0.7%
Cap rate
0.1%
Rent to Value Ratio
Active
$668,900
2
bds
|
2
ba
|
1,116
sqft
|
built
2014
31 SE 6th St, Miami, FL 33131
$-2,308
Cash flow
-18.0%
Cash-on-Cash Return
2.0%
Cap rate
0.8%
Rent to Value Ratio
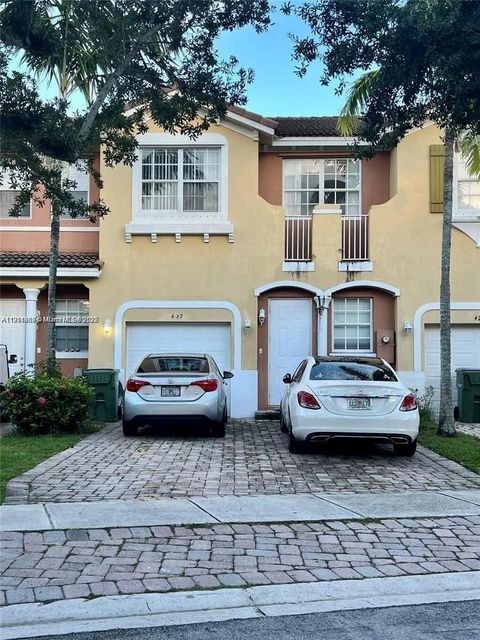
Active
$369,900
4
bds
|
3
ba
|
1,592
sqft
|
built
2006
427 NE 21st Ter, Homestead, FL 33033
$-883
Cash flow
-12.5%
Cash-on-Cash Return
3.3%
Cap rate
0.7%
Rent to Value Ratio