Miami Dade County Investment Properties for Sale
Browse homes for sale and investment properties in Miami Dade County. Refine your search by price, property type, or more.
Best cash flowing properties in Miami Dade County
Active
$25,000
2
bds
|
0
ba
|
0
sqft
|
built
2008
90 SW 3rd St, Miami, FL 33130
$1,674
Cash flow
78.0%
Cash-on-Cash Return
80.4%
Cap rate
16.4%
Rent to Value Ratio

Active
$240,000
3
bds
|
2
ba
|
1,200
sqft
|
built
1978
28131 SW 142nd Ct, Homestead, FL 33033
$26
Cash flow
0.6%
Cash-on-Cash Return
6.4%
Cap rate
1.0%
Rent to Value Ratio
10,000 out of 16,821 properties for sale in Miami Dade County
Limited Results Shown
Create a free account, or log in to reveal all property listings and enjoy the complete experience.

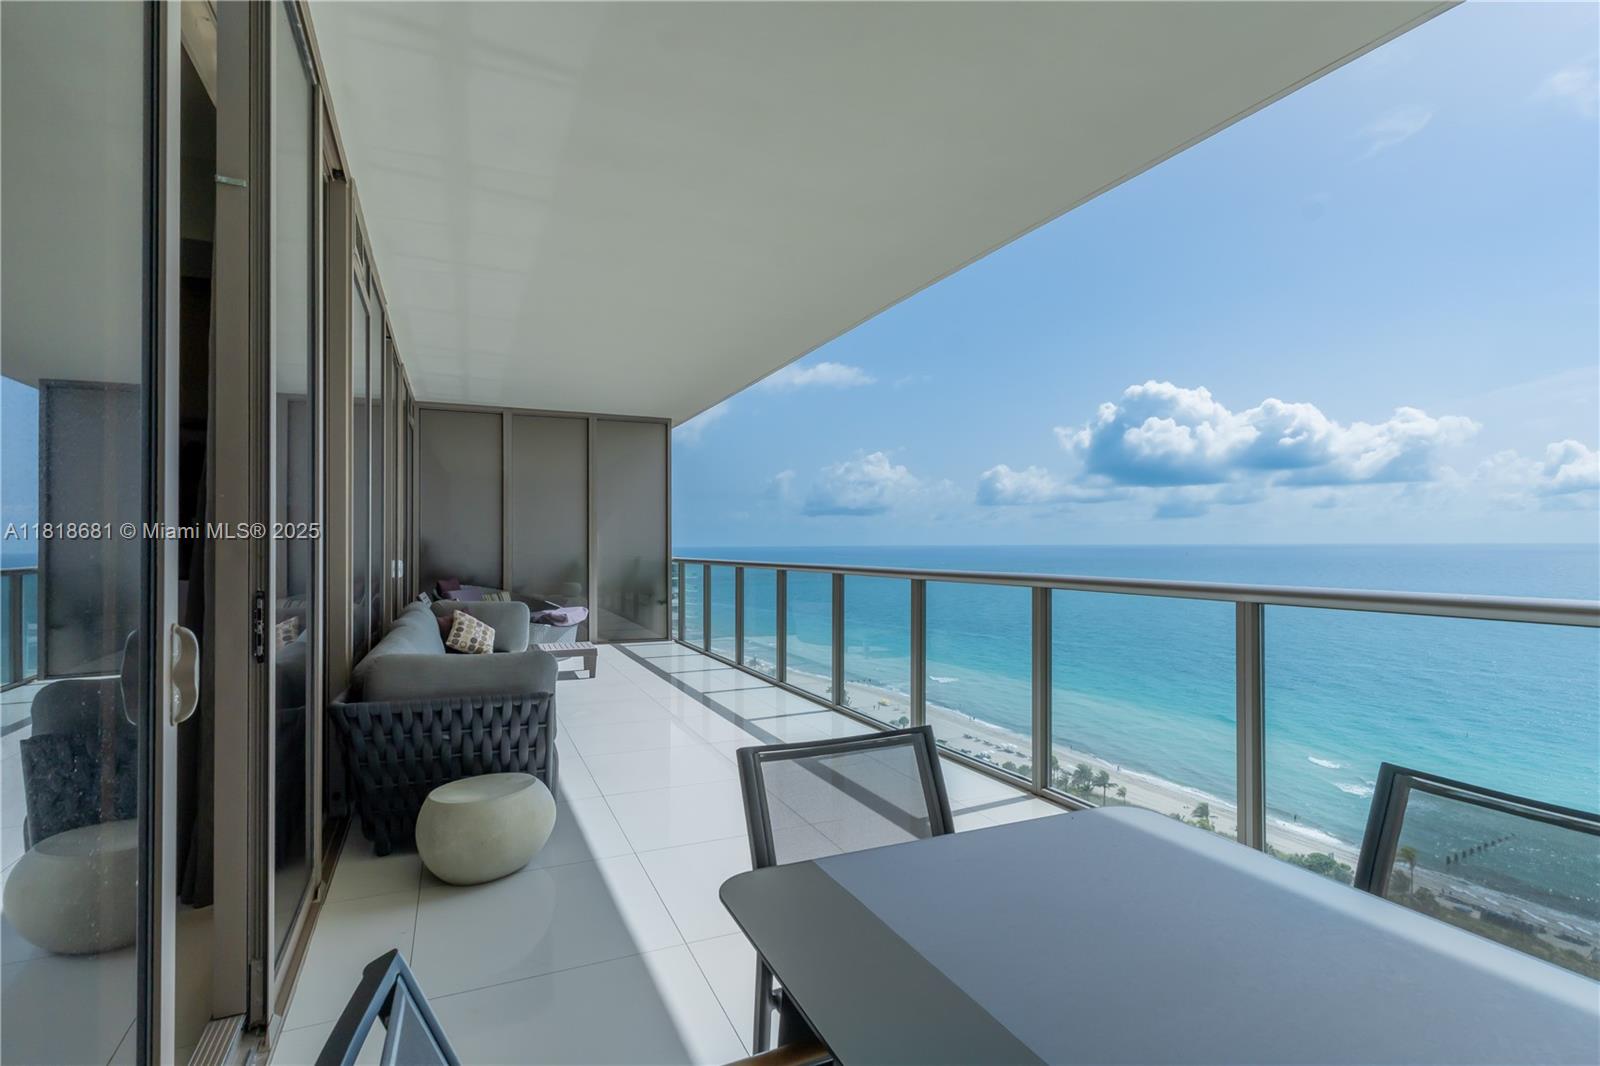
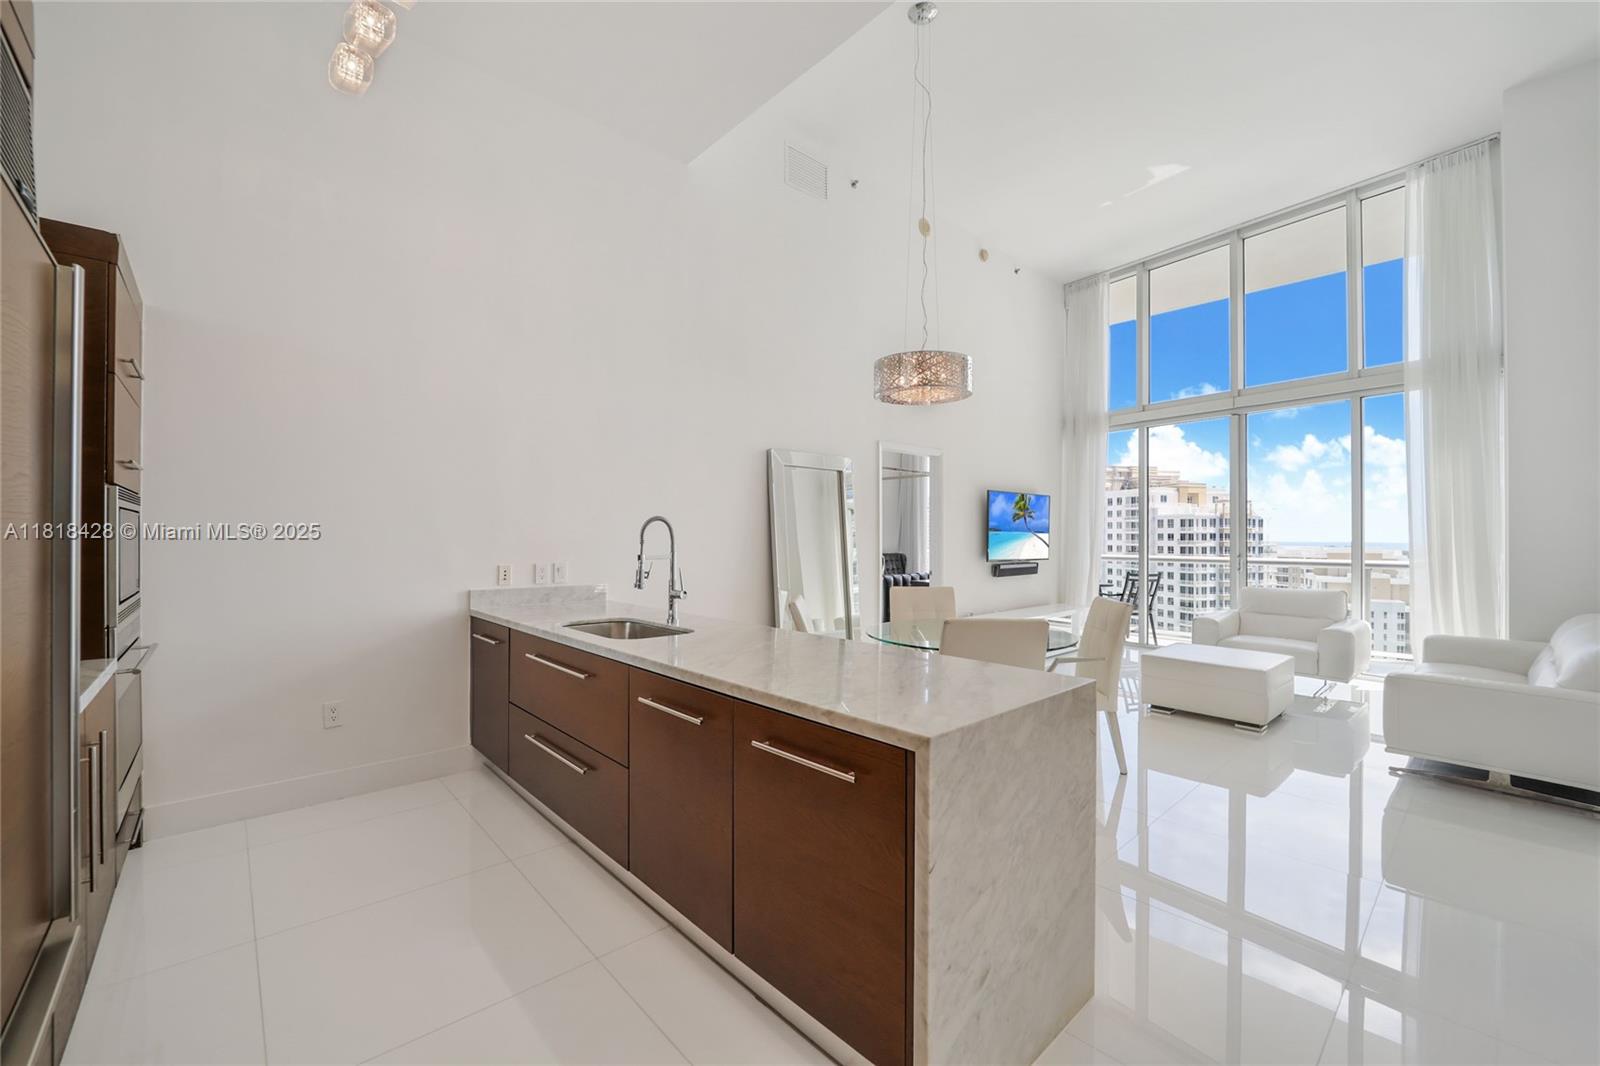
Active
$279,000
1
bds
|
1
ba
|
1,000
sqft
|
built
1971
19390 Collins Ave, Sunny Isles Beach, FL 33160
$-868
Cash flow
-16.2%
Cash-on-Cash Return
2.6%
Cap rate
0.8%
Rent to Value Ratio
Active
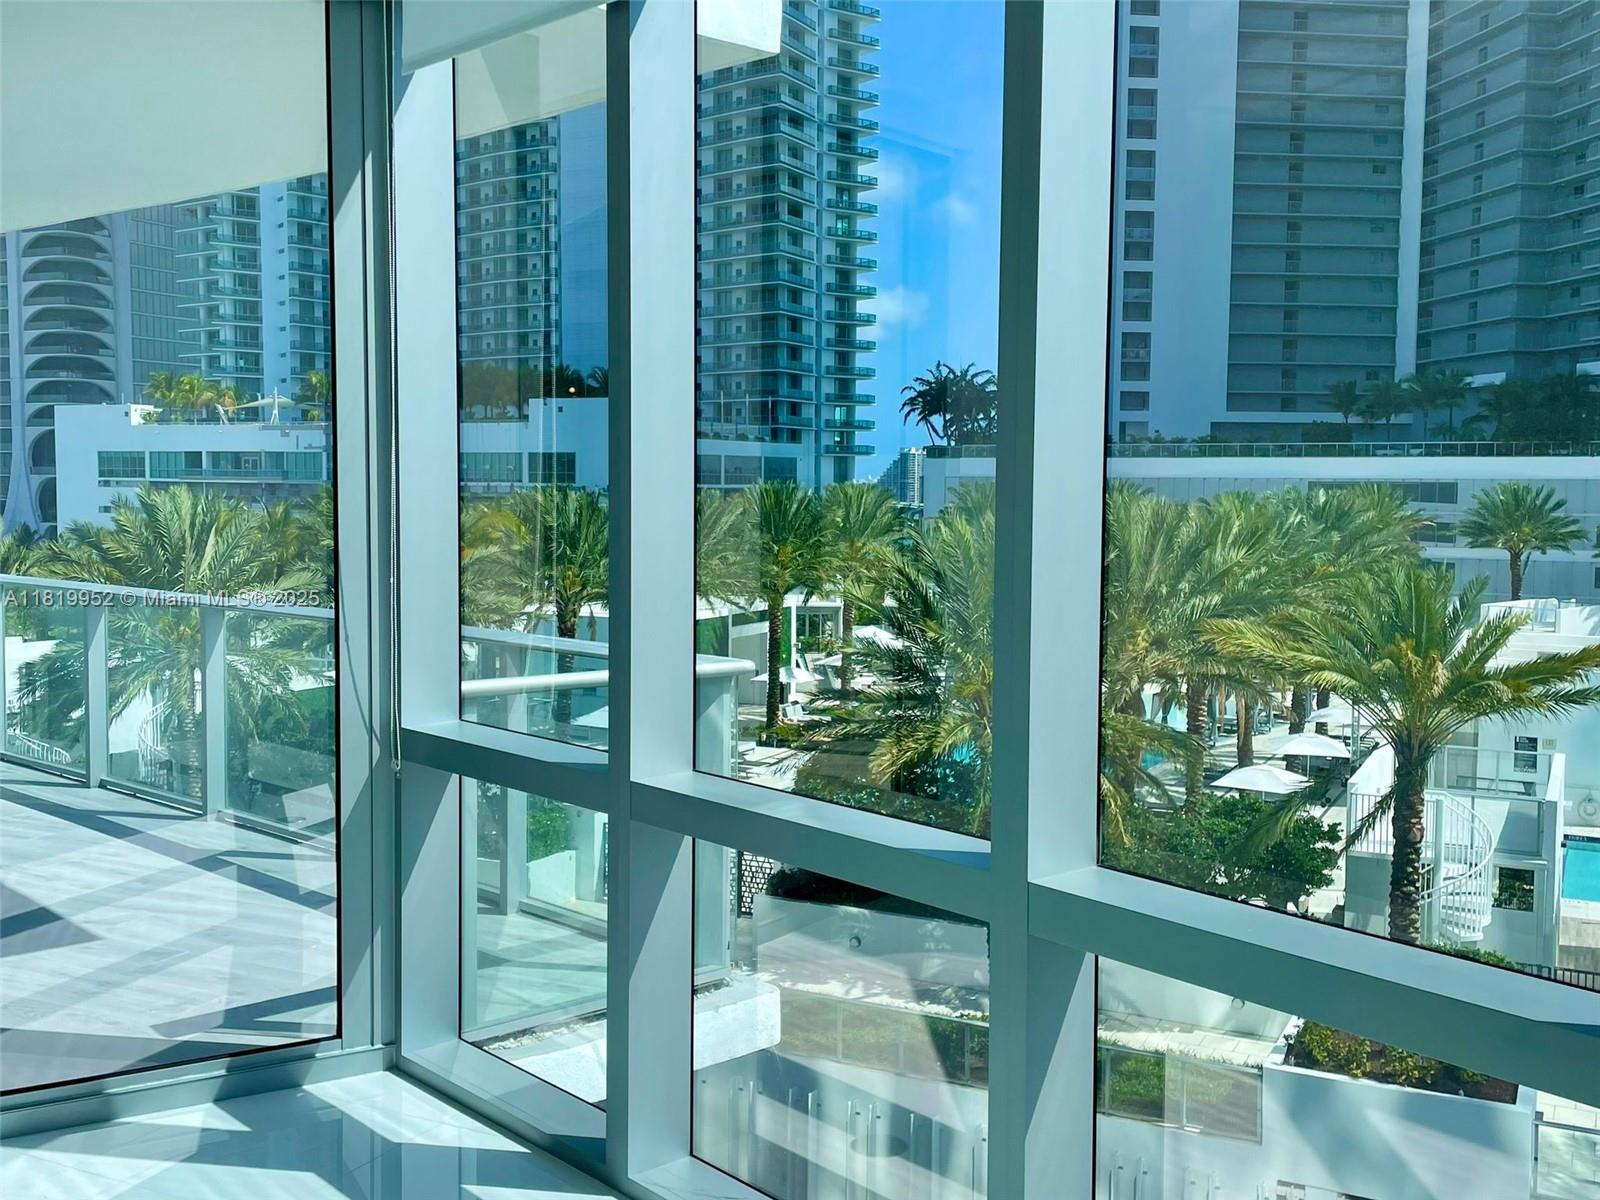
$7,500,000
4
bds
|
5
ba
|
4,600
sqft
|
built
2019
1000 Biscayne Blvd, Miami, FL 33132
$-50,609
Cash flow
-35.2%
Cash-on-Cash Return
-1.8%
Cap rate
0.1%
Rent to Value Ratio
Active
$1,199,999
5
bds
|
4
ba
|
2,916
sqft
|
built
2002
16262 SW 44th Ter, Miami, FL 33185
$-3,482
Cash flow
-15.1%
Cash-on-Cash Return
2.8%
Cap rate
0.4%
Rent to Value Ratio
Active
$775,000
4
bds
|
2
ba
|
1,362
sqft
|
built
1976
12900 SW 85th St, Miami, FL 33183
$-1,880
Cash flow
-12.7%
Cash-on-Cash Return
3.4%
Cap rate
0.5%
Rent to Value Ratio
Active
$450,000
2
bds
|
2
ba
|
1,028
sqft
|
built
1980
5022 SW 139th Pl, Miami, FL 33175
$-675
Cash flow
-7.8%
Cash-on-Cash Return
4.5%
Cap rate
0.6%
Rent to Value Ratio
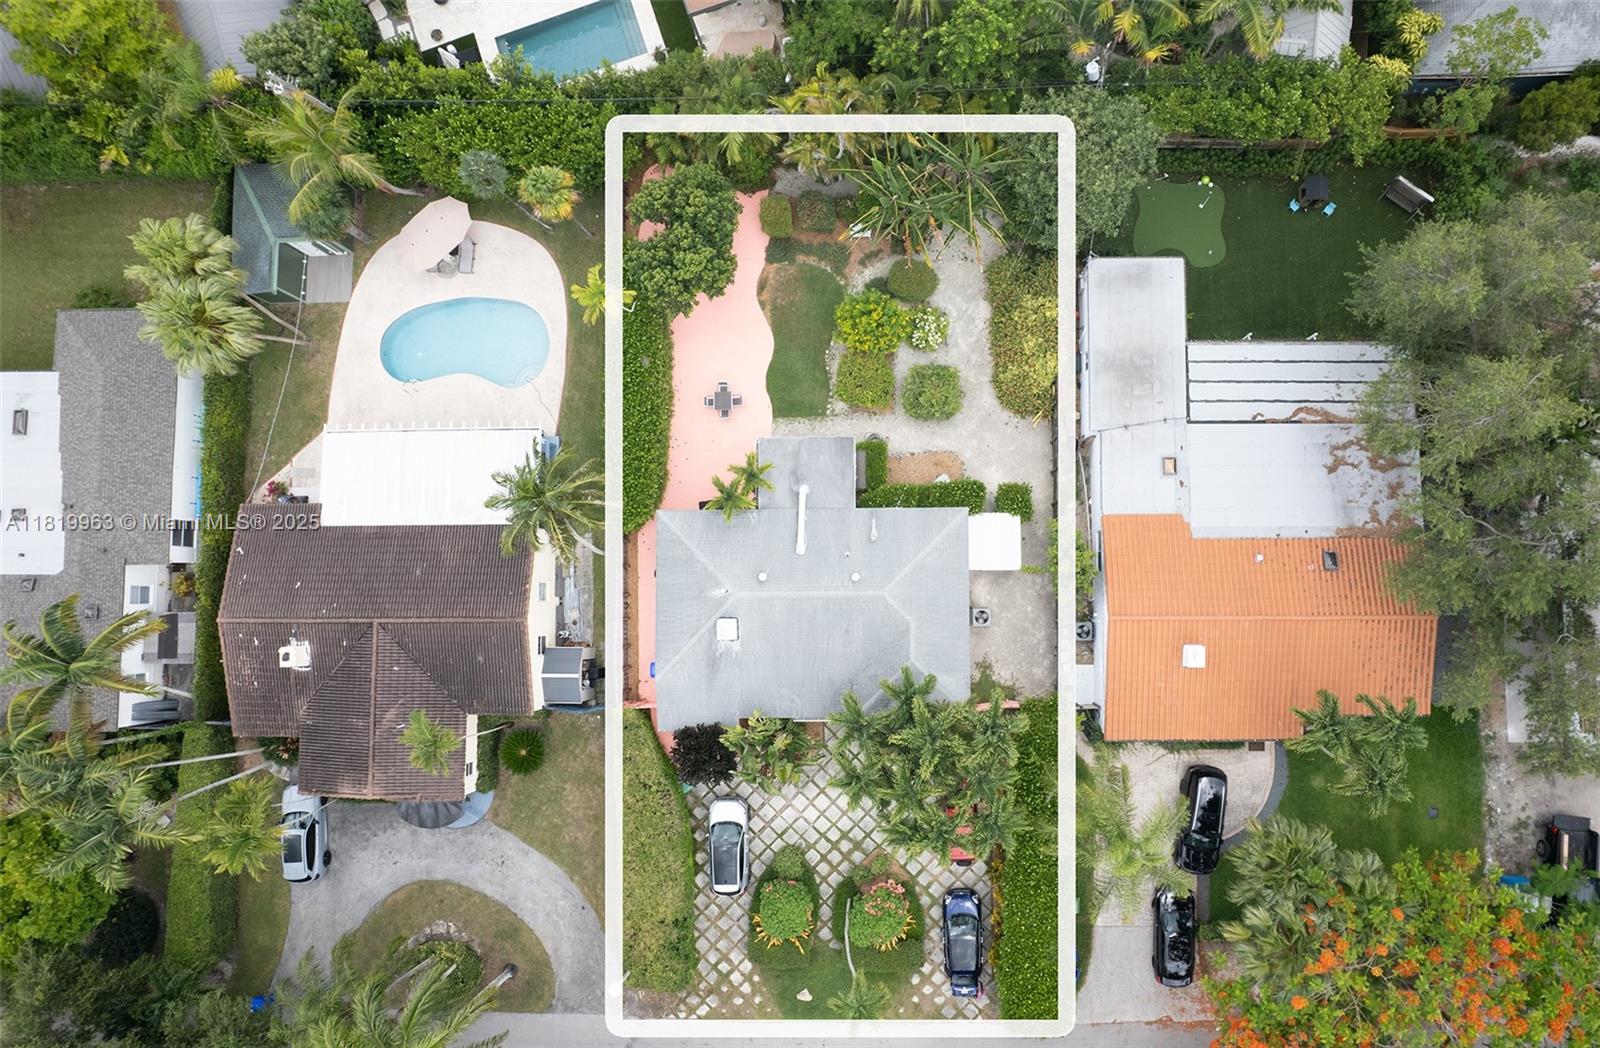
Active
$995,000
2
bds
|
0
ba
|
1,472
sqft
|
built
1956
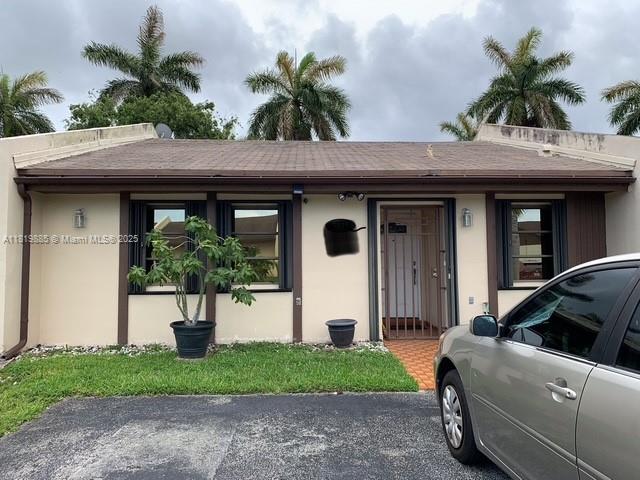
3121 SW 25th Ter, Miami, FL 33133
$-4,476
Cash flow
-23.5%
Cash-on-Cash Return
0.9%
Cap rate
0.3%
Rent to Value Ratio
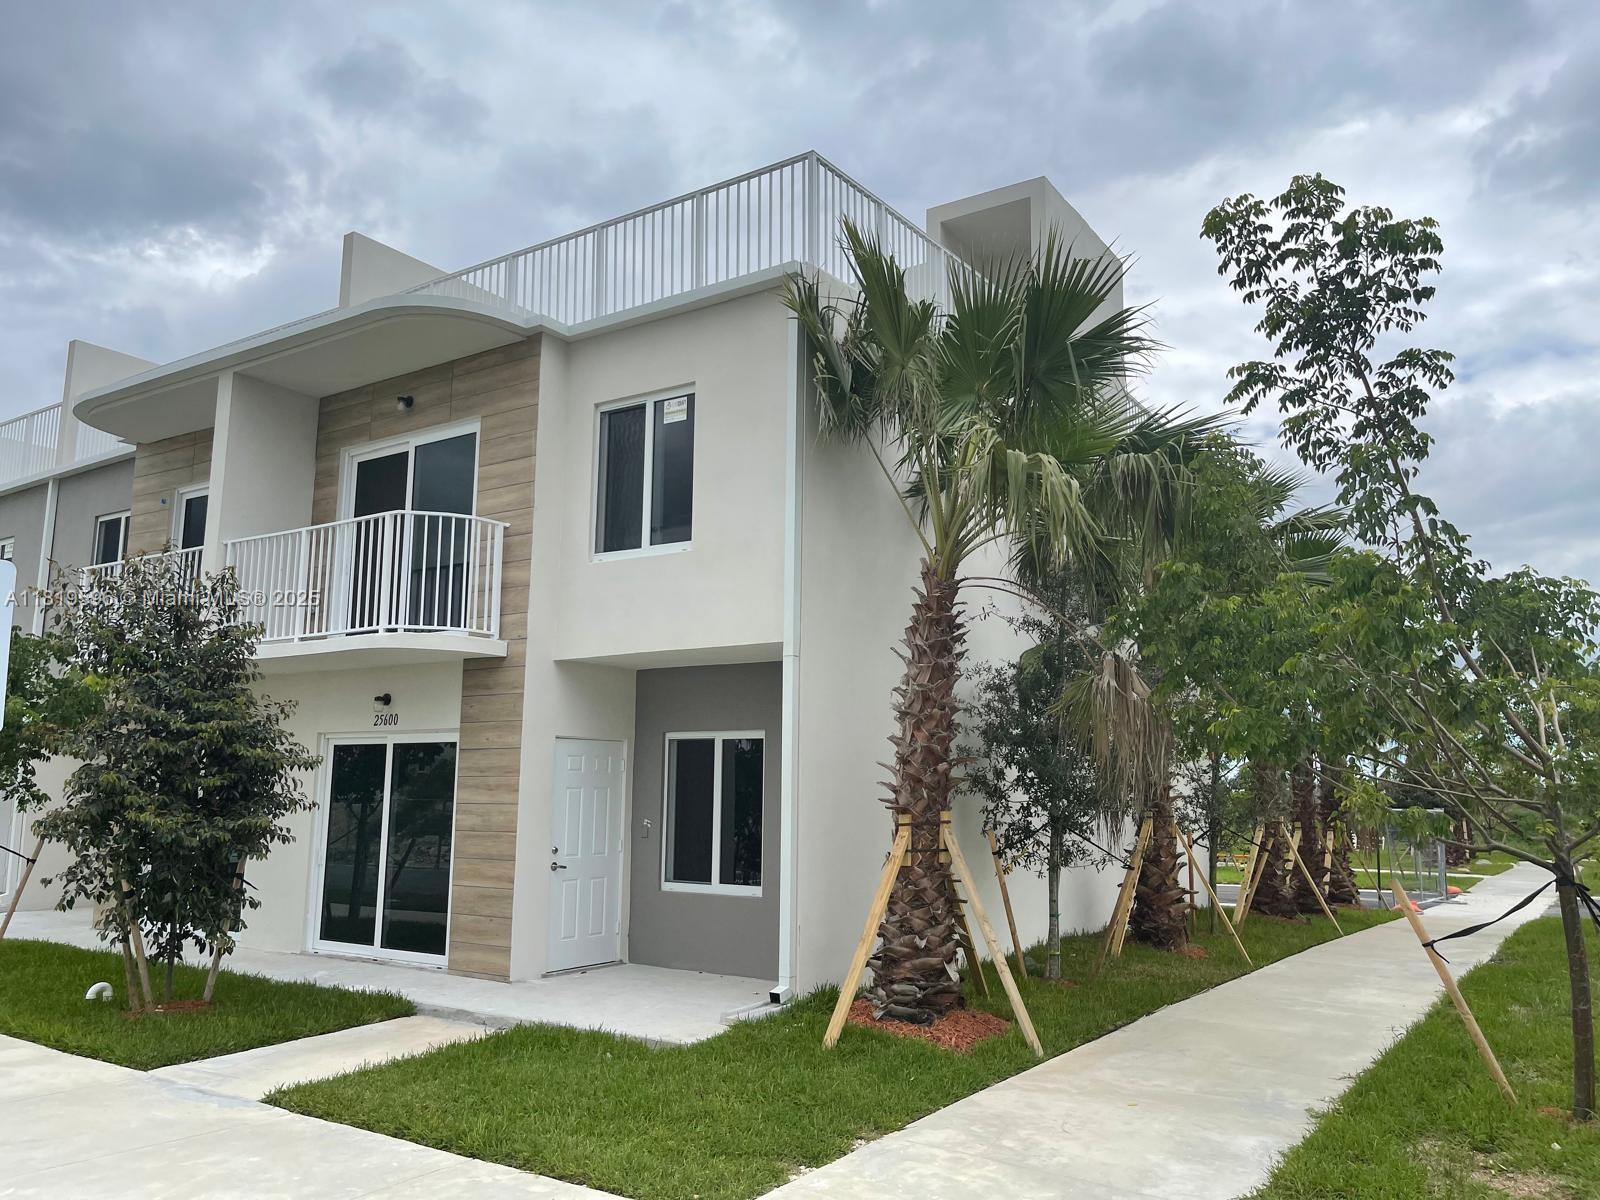
Active
$440,000
4
bds
|
4
ba
|
1,398
sqft
|
built
2022
25600 SW 143rd Path, Homestead, FL 33032
$-1,037
Cash flow
-12.3%
Cash-on-Cash Return
3.5%
Cap rate
0.6%
Rent to Value Ratio
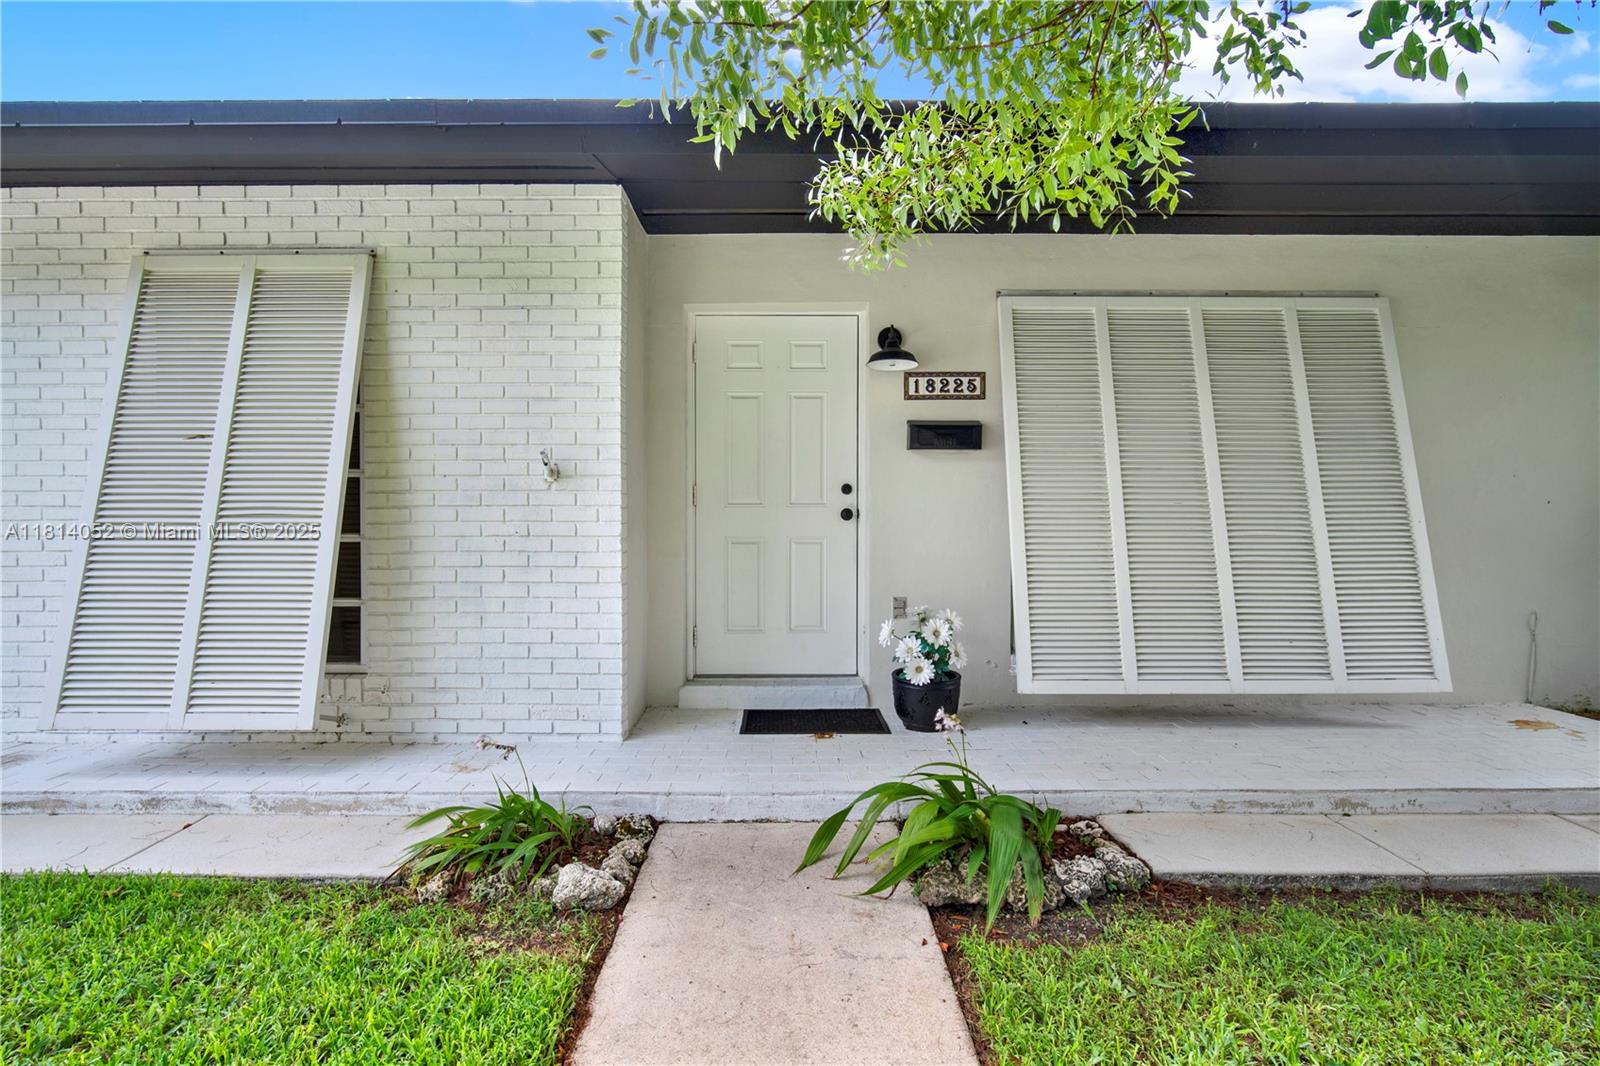
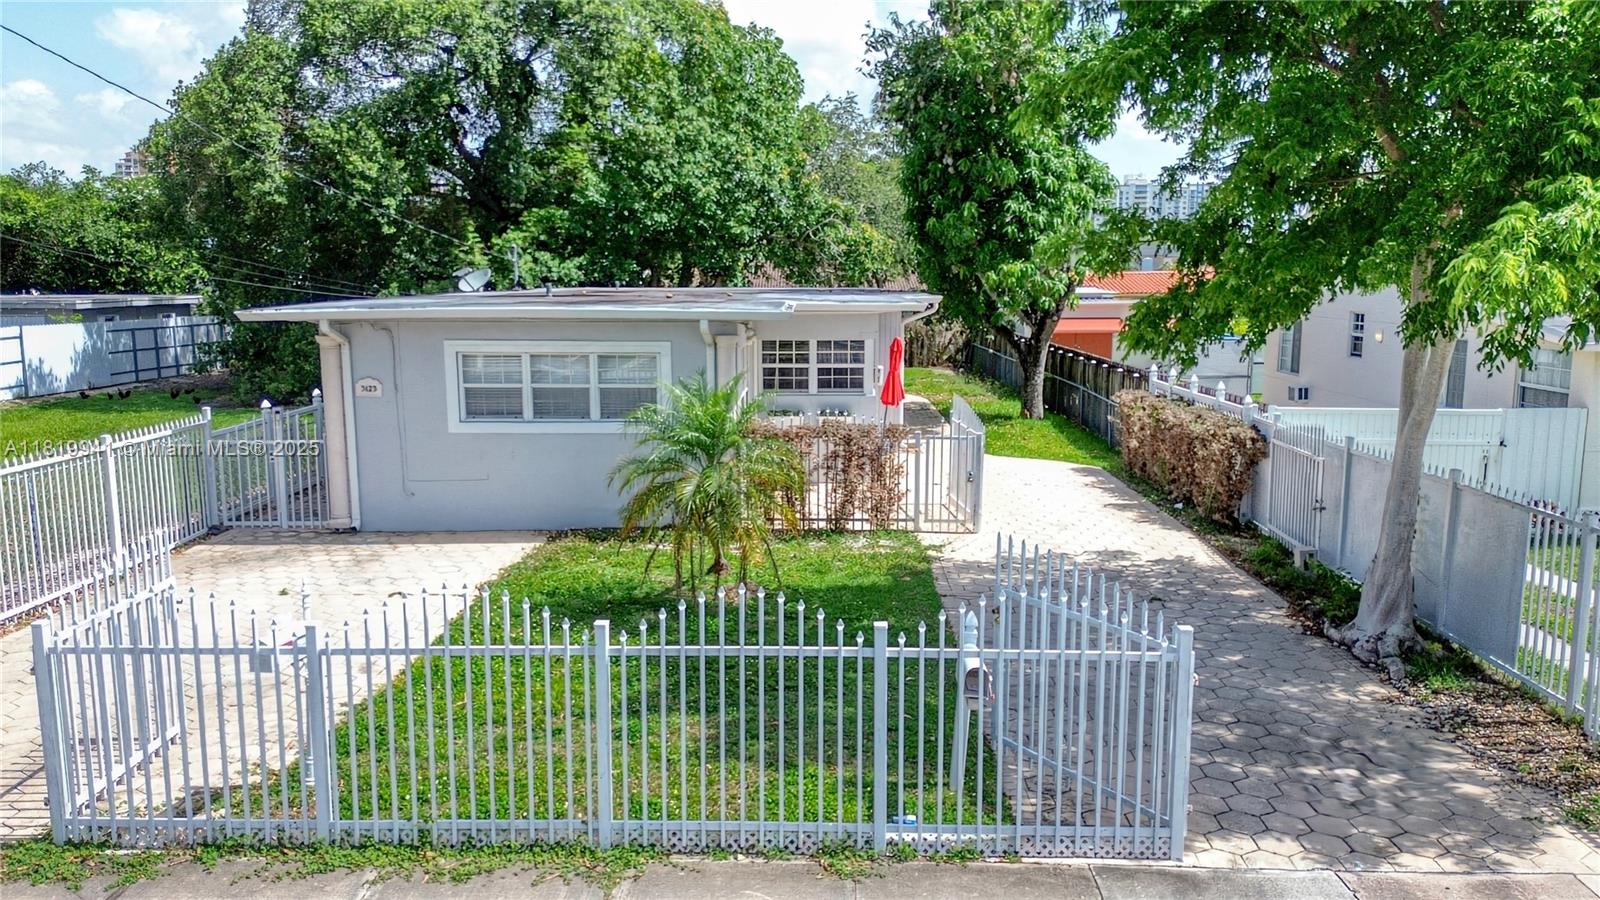
Active
$615,000
3
bds
|
1
ba
|
1,078
sqft
|
built
1972
18225 SW 94th Ave, Palmetto Bay, FL 33157
$-1,290
Cash flow
-10.9%
Cash-on-Cash Return
3.8%
Cap rate
0.5%
Rent to Value Ratio
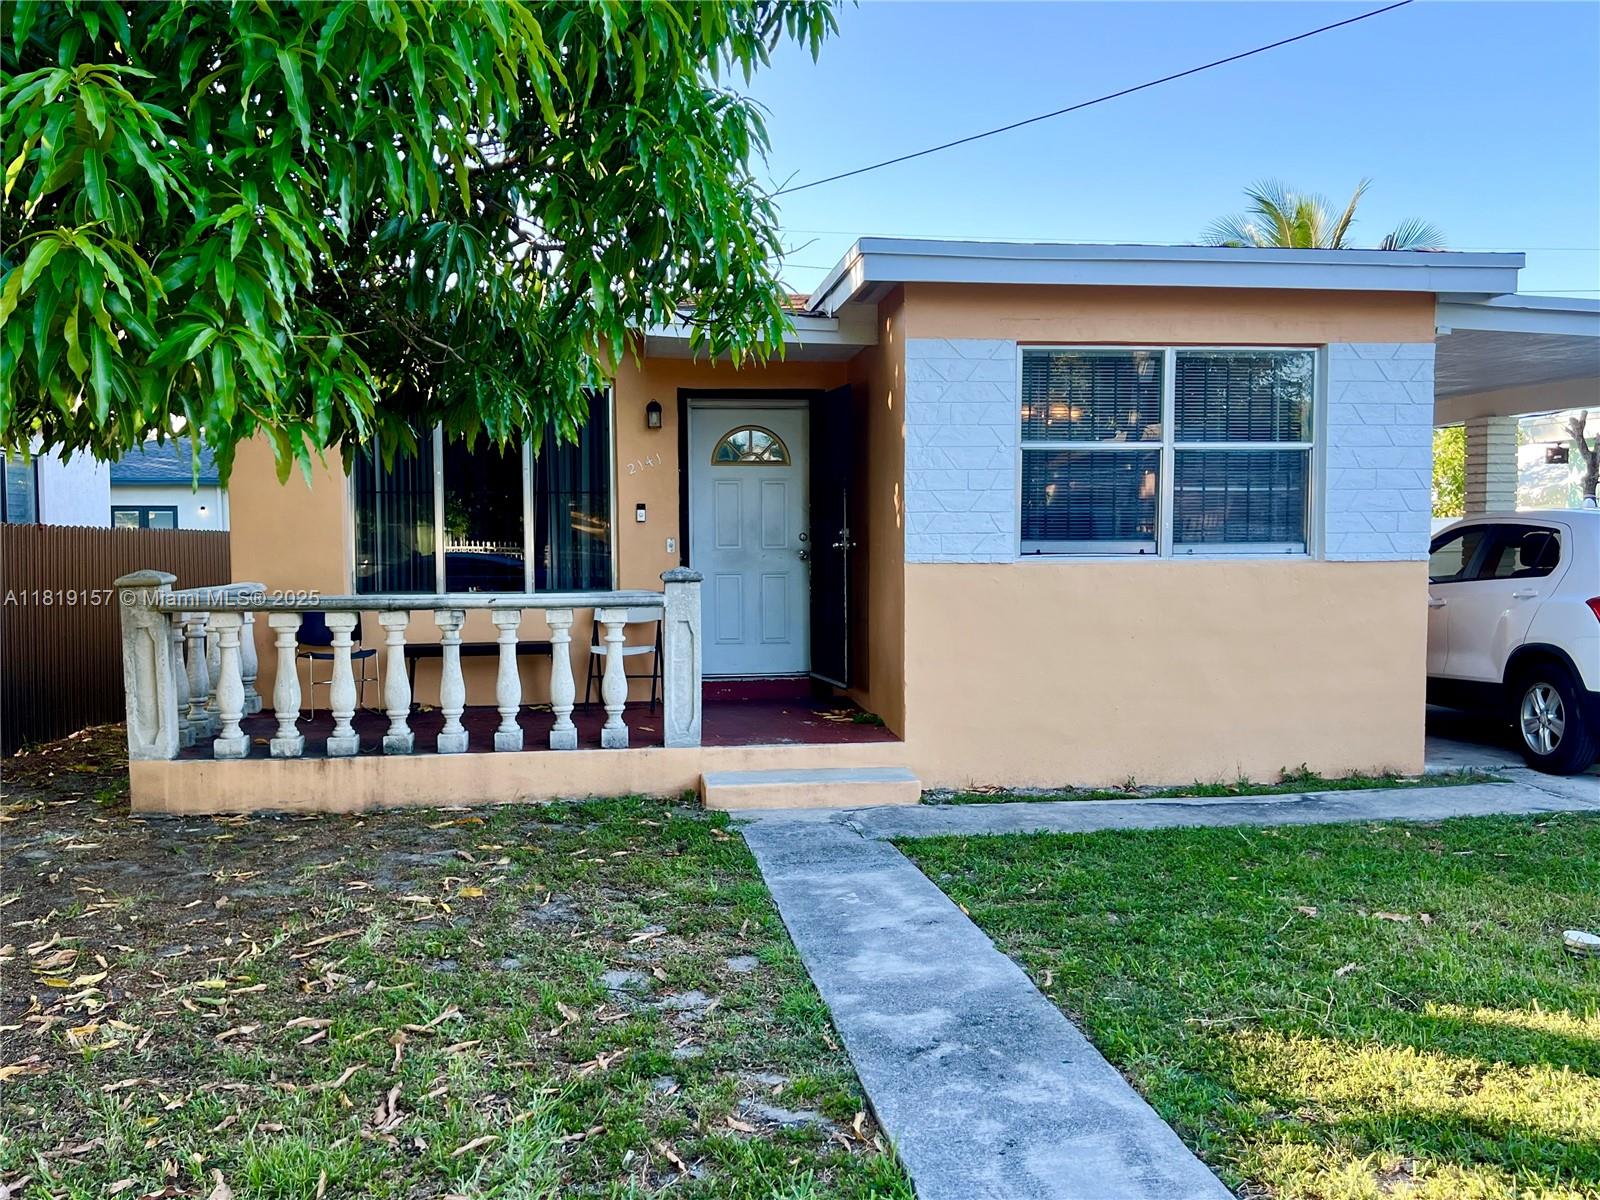
Active
$398,000
3
bds
|
2
ba
|
1,202
sqft
|
built
1956
2141 NW 57th St, Miami, FL 33142
$-291
Cash flow
-3.8%
Cash-on-Cash Return
5.4%
Cap rate
0.8%
Rent to Value Ratio

Active
$2,875,000
4
bds
|
5
ba
|
4,185
sqft
|
built
1980
10304 SW 87th Ct, Miami, FL 33176
$-9,859
Cash flow
-17.9%
Cash-on-Cash Return
2.2%
Cap rate
0.3%
Rent to Value Ratio
Active
$700,000
5
bds
|
4
ba
|
2,564
sqft
|
built
2015
27260 SW 136th Path, Homestead, FL 33032
$-1,618
Cash flow
-12.1%
Cash-on-Cash Return
3.5%
Cap rate
0.5%
Rent to Value Ratio
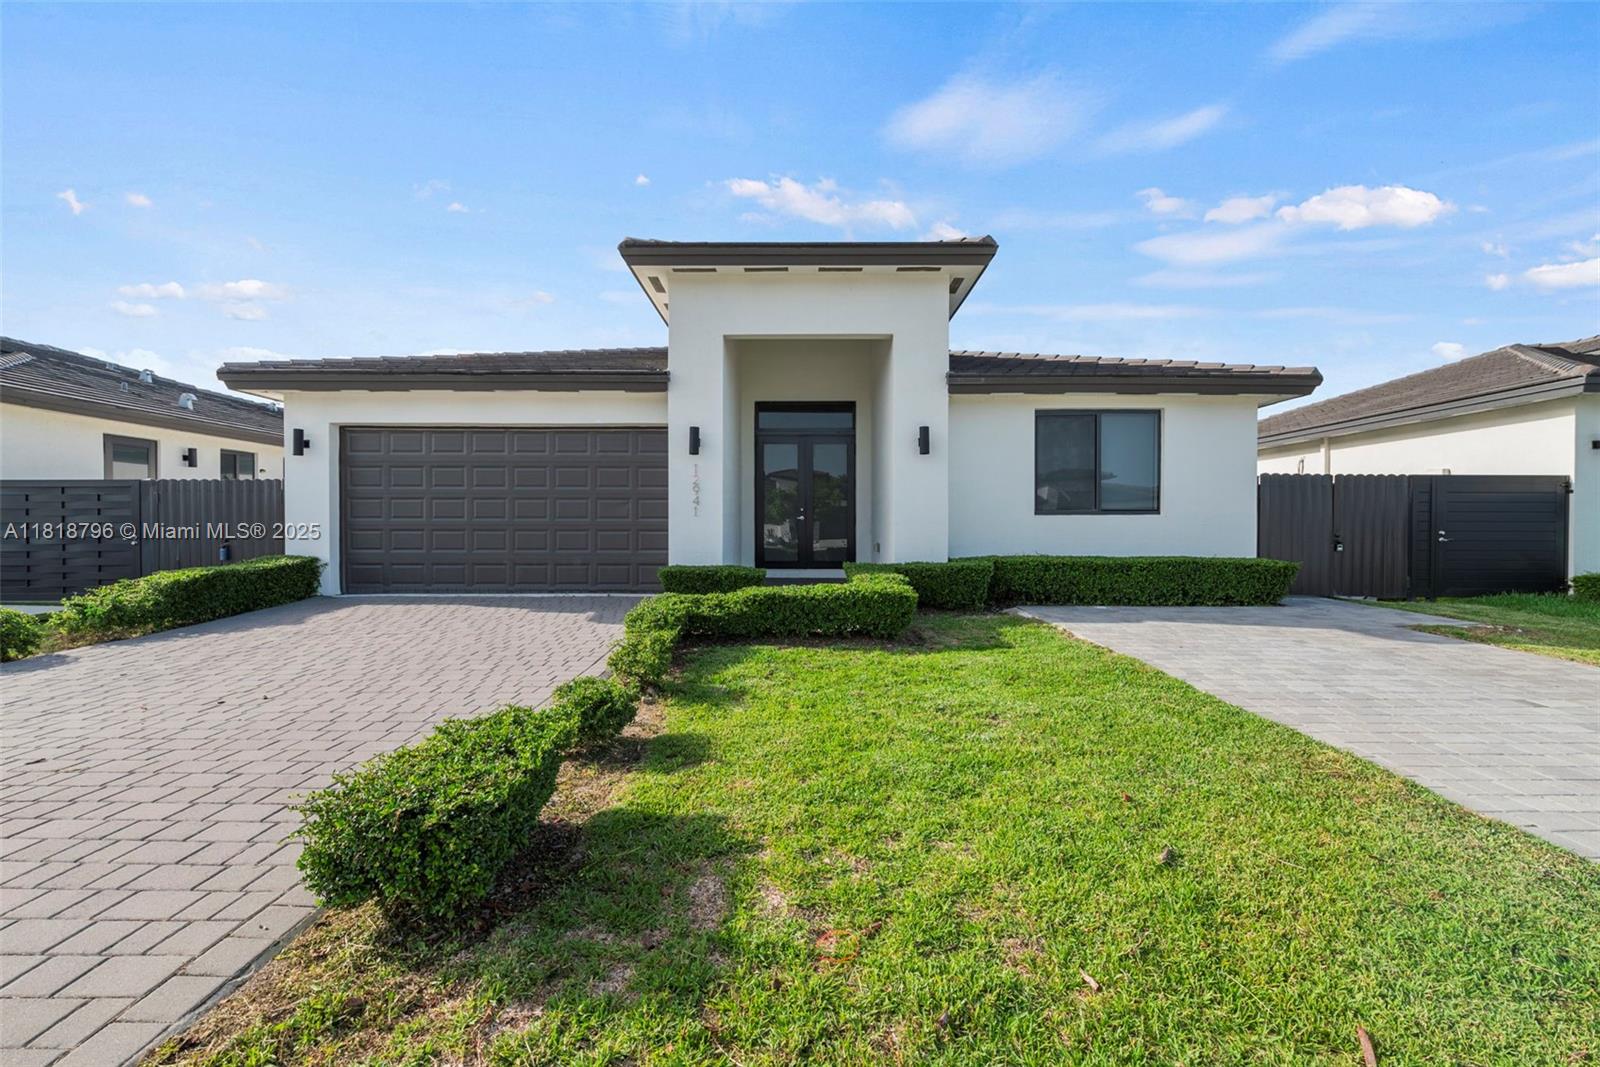
Active
$730,000
4
bds
|
3
ba
|
2,066
sqft
|
built
2023
12941 SW 227th St, Miami, FL 33170
$-1,537
Cash flow
-11.0%
Cash-on-Cash Return
3.8%
Cap rate
0.6%
Rent to Value Ratio
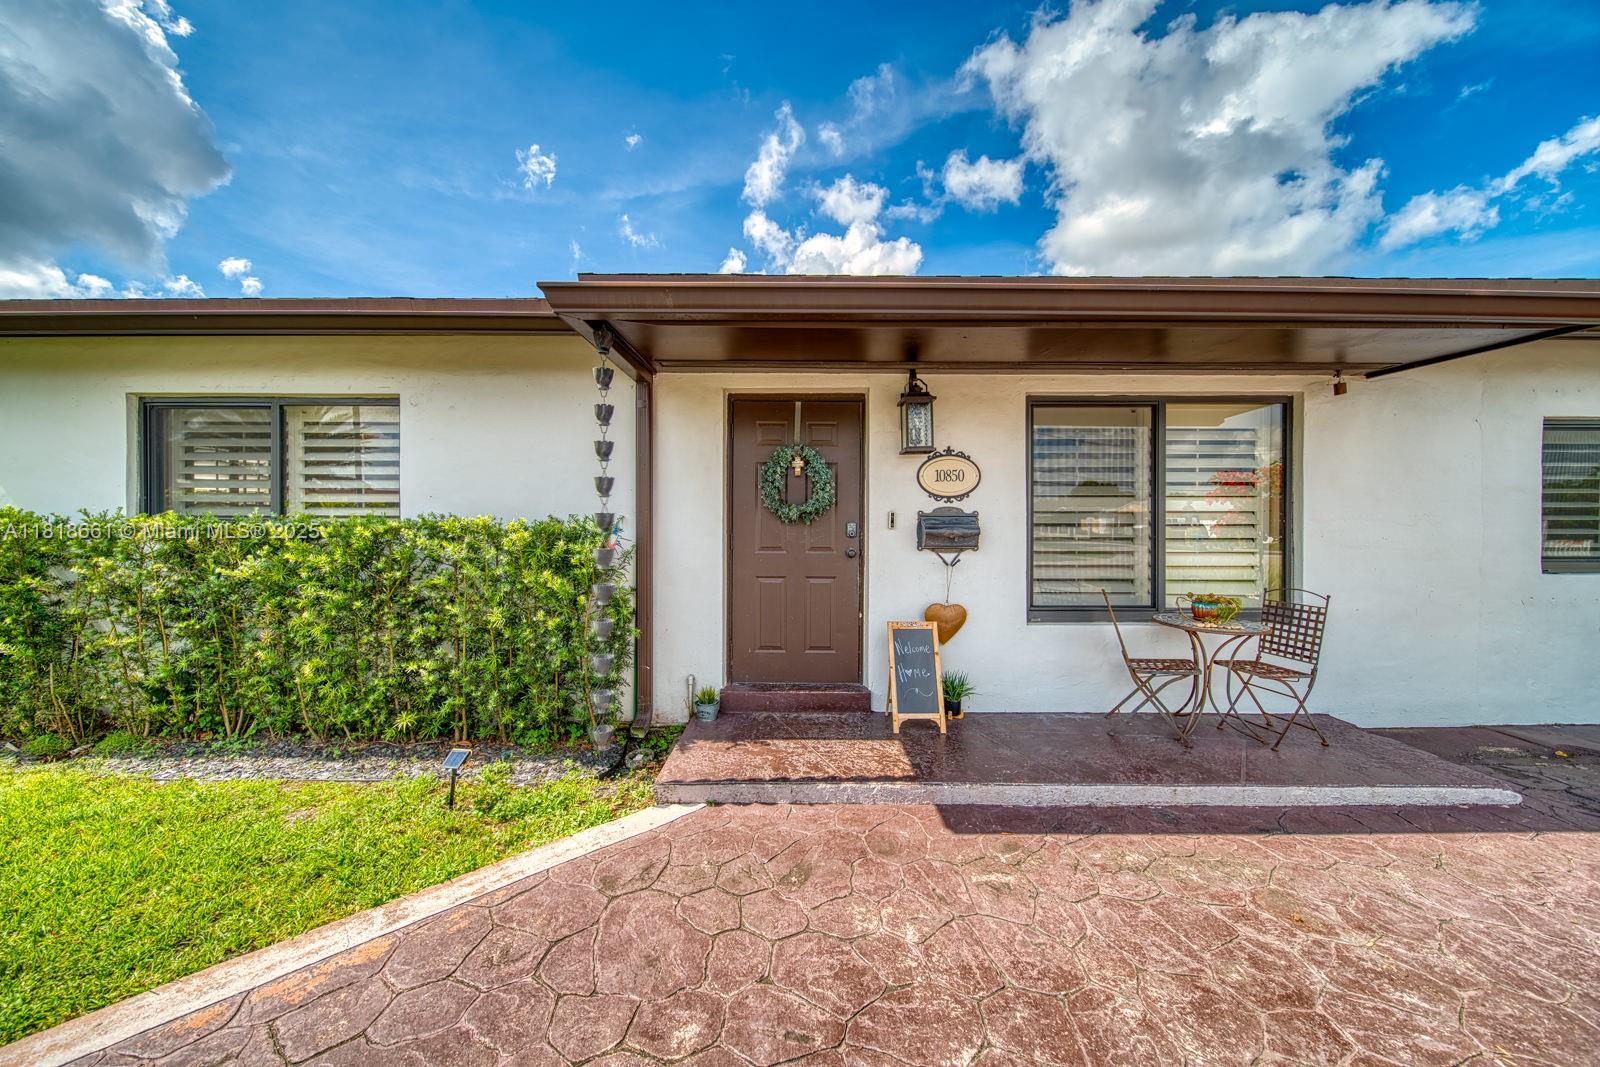
Active
$780,000
3
bds
|
2
ba
|
1,800
sqft
|
built
1965
10850 SW 61st St, Miami, FL 33173
$-2,031
Cash flow
-13.6%
Cash-on-Cash Return
3.2%
Cap rate
0.5%
Rent to Value Ratio
Active
$4,450,000
2
bds
|
3
ba
|
1,685
sqft
|
built
2011
9705 Collins Ave, Bal Harbour, FL 33154
$-28,733
Cash flow
-33.7%
Cash-on-Cash Return
-1.5%
Cap rate
0.2%
Rent to Value Ratio
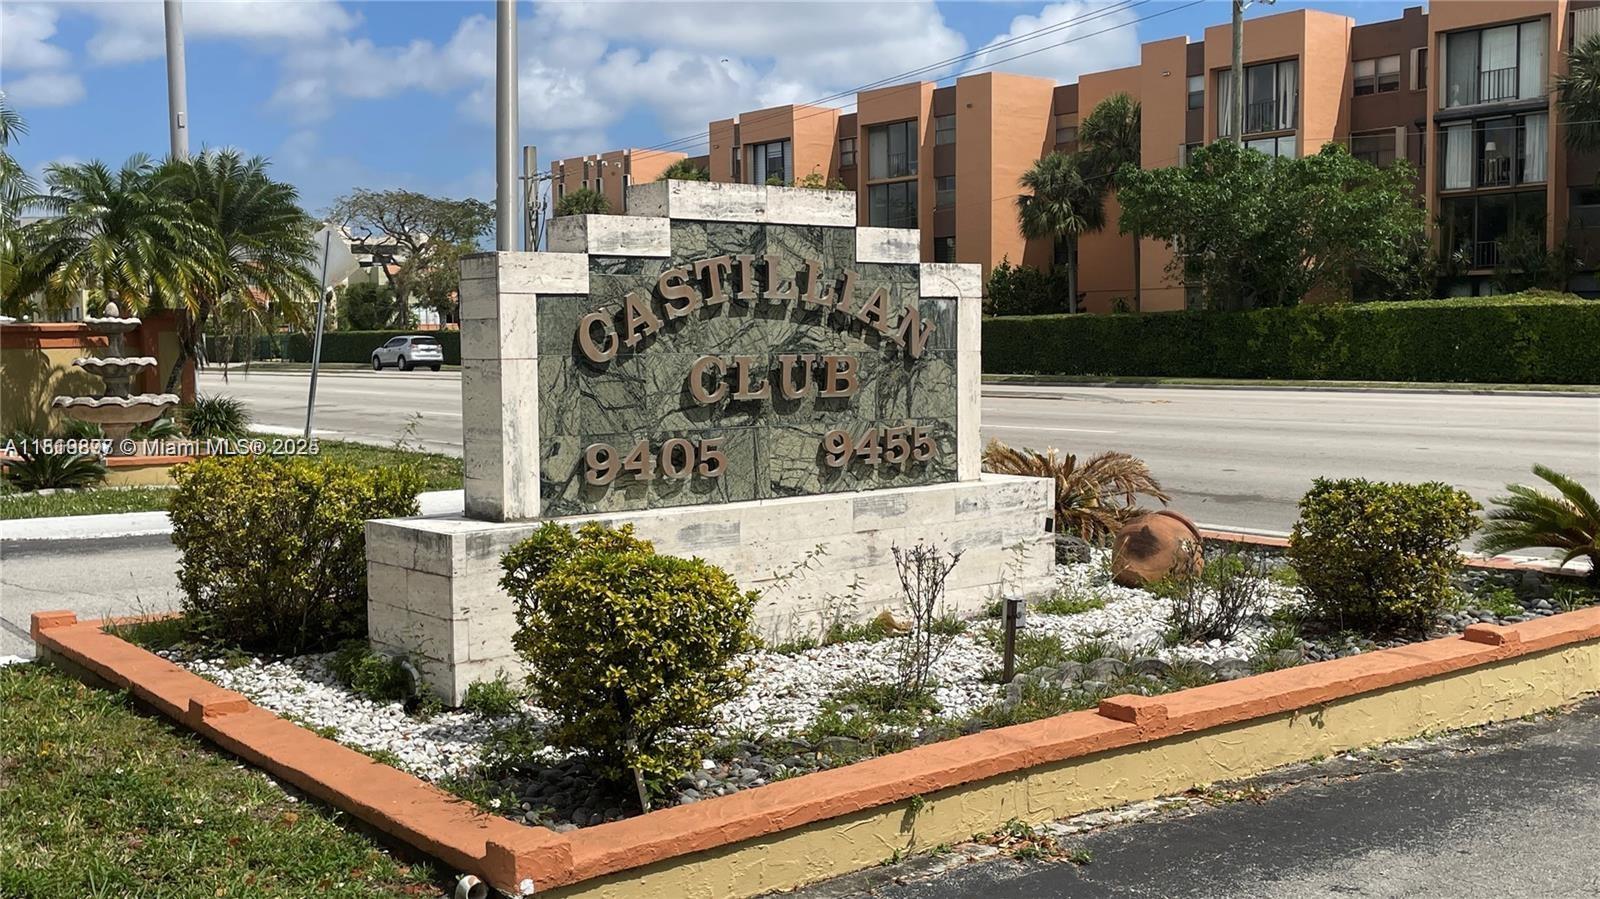
Active
$230,000
1
bds
|
1
ba
|
667
sqft
|
built
1973
9455 W Flagler St, Miami, FL 33174
$-363
Cash flow
-8.2%
Cash-on-Cash Return
4.4%
Cap rate
0.9%
Rent to Value Ratio
Active
$540,000
4
bds
|
2
ba
|
1,355
sqft
|
built
1953
29125 Indiana Rd, Homestead, FL 33033
$-1,037
Cash flow
-10.0%
Cash-on-Cash Return
4.0%
Cap rate
0.6%
Rent to Value Ratio
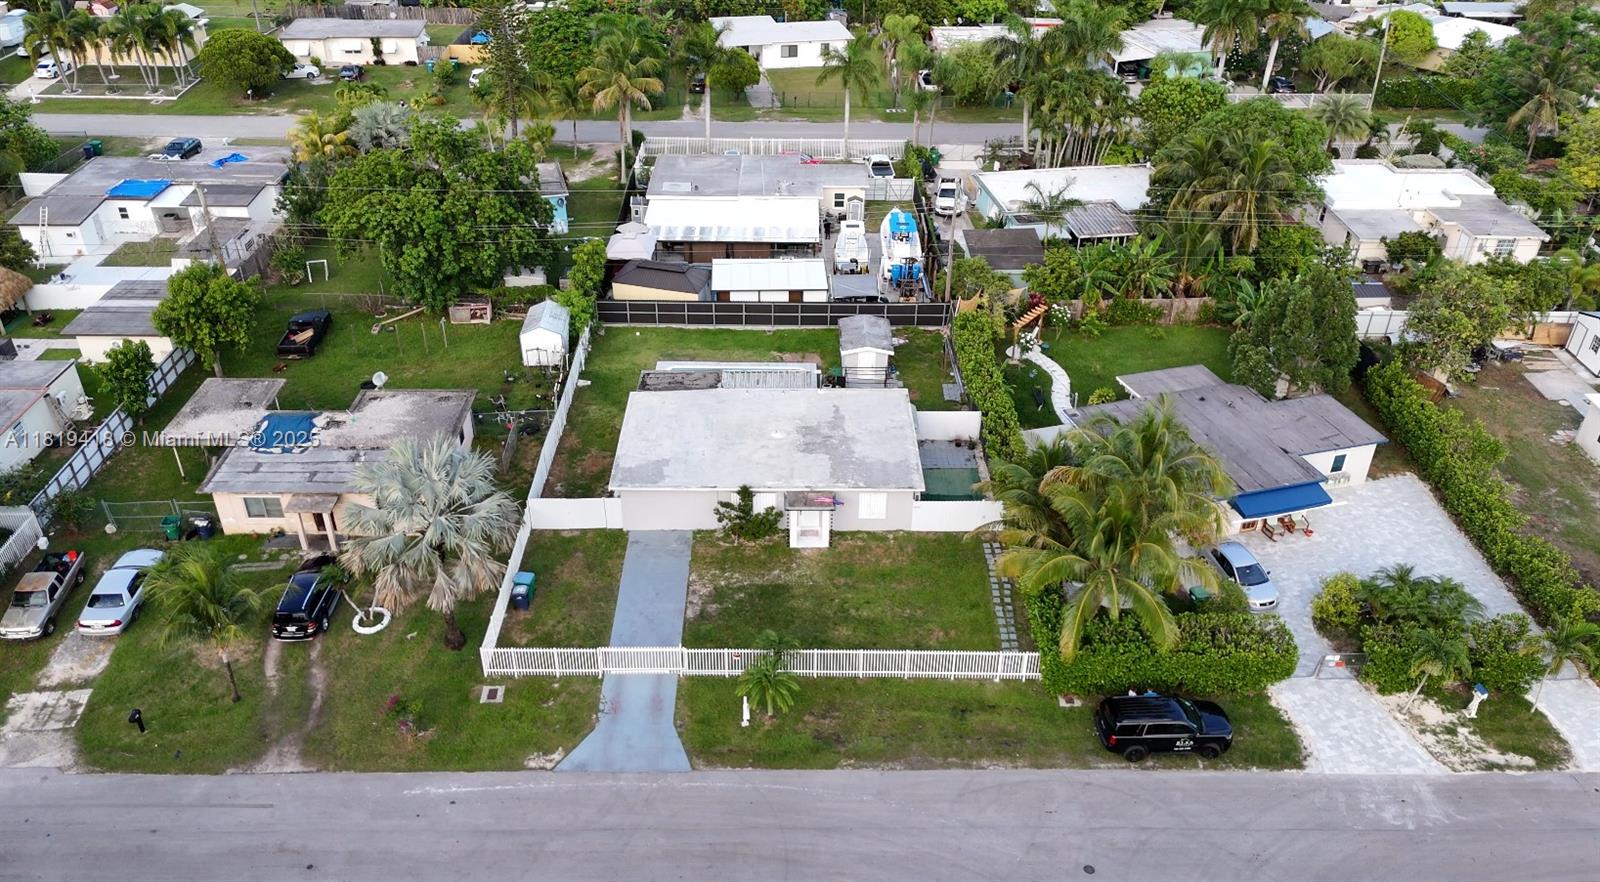
Active
$240,000
3
bds
|
2
ba
|
1,200
sqft
|
built
1978
14266 SW 283rd St, Homestead, FL 33033
$-57
Cash flow
-1.2%
Cash-on-Cash Return
6.0%
Cap rate
1.0%
Rent to Value Ratio
Active
$520,000
2
bds
|
2
ba
|
1,023
sqft
|
built
2004
1250 S Miami Ave, Miami, FL 33130
$-2,317
Cash flow
-23.2%
Cash-on-Cash Return
0.9%
Cap rate
0.6%
Rent to Value Ratio
Active
$275,000
2
bds
|
2
ba
|
1,099
sqft
|
built
1977
8511 NW 8th St, Miami, FL 33126
$-606
Cash flow
-11.5%
Cash-on-Cash Return
3.6%
Cap rate
0.8%
Rent to Value Ratio
Active
$840,000
4
bds
|
3
ba
|
1,751
sqft
|
built
1961
3551 SW 121st Ave, Miami, FL 33175
$-2,101
Cash flow
-13.0%
Cash-on-Cash Return
3.3%
Cap rate
0.5%
Rent to Value Ratio
Active
$850,000
2
bds
|
3
ba
|
1,345
sqft
|
built
1982
4000 NE 168th St, North Miami Beach, FL 33160
$-3,043
Cash flow
-18.7%
Cash-on-Cash Return
2.0%
Cap rate
0.5%
Rent to Value Ratio
Active
$765,000
4
bds
|
3
ba
|
1,895
sqft
|
built
2017
7227 NW 103rd Path, Doral, FL 33178
$-2,087
Cash flow
-14.2%
Cash-on-Cash Return
3.0%
Cap rate
0.6%
Rent to Value Ratio
Active
$25,000
2
bds
|
0
ba
|
0
sqft
|
built
2008
90 SW 3rd St, Miami, FL 33130
$1,674
Cash flow
78.0%
Cash-on-Cash Return
80.4%
Cap rate
16.4%
Rent to Value Ratio
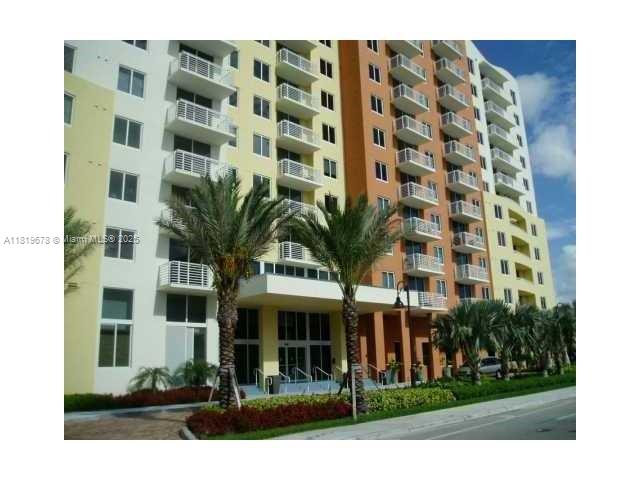
Active
$400,000
1
bds
|
1
ba
|
850
sqft
|
built
1966
800 West Ave, Miami Beach, FL 33139
$-1,196
Cash flow
-15.6%
Cash-on-Cash Return
2.7%
Cap rate
0.9%
Rent to Value Ratio
Active
$2,650,000
5
bds
|
4
ba
|
3,142
sqft
|
built
1961
7570 SW 60th St, Miami, FL 33143
$-9,424
Cash flow
-18.6%
Cash-on-Cash Return
2.0%
Cap rate
0.3%
Rent to Value Ratio
Active
$1,975,000
4
bds
|
4
ba
|
3,327
sqft
|
built
1952
5757 SW 49th St, Miami, FL 33155
$-5,734
Cash flow
-15.1%
Cash-on-Cash Return
2.8%
Cap rate
0.4%
Rent to Value Ratio
Active
$990,000
3
bds
|
3
ba
|
1,552
sqft
|
built
2019
851 NE 1st Ave, Miami, FL 33132
$-2,266
Cash flow
-11.9%
Cash-on-Cash Return
3.5%
Cap rate
1.0%
Rent to Value Ratio
Active
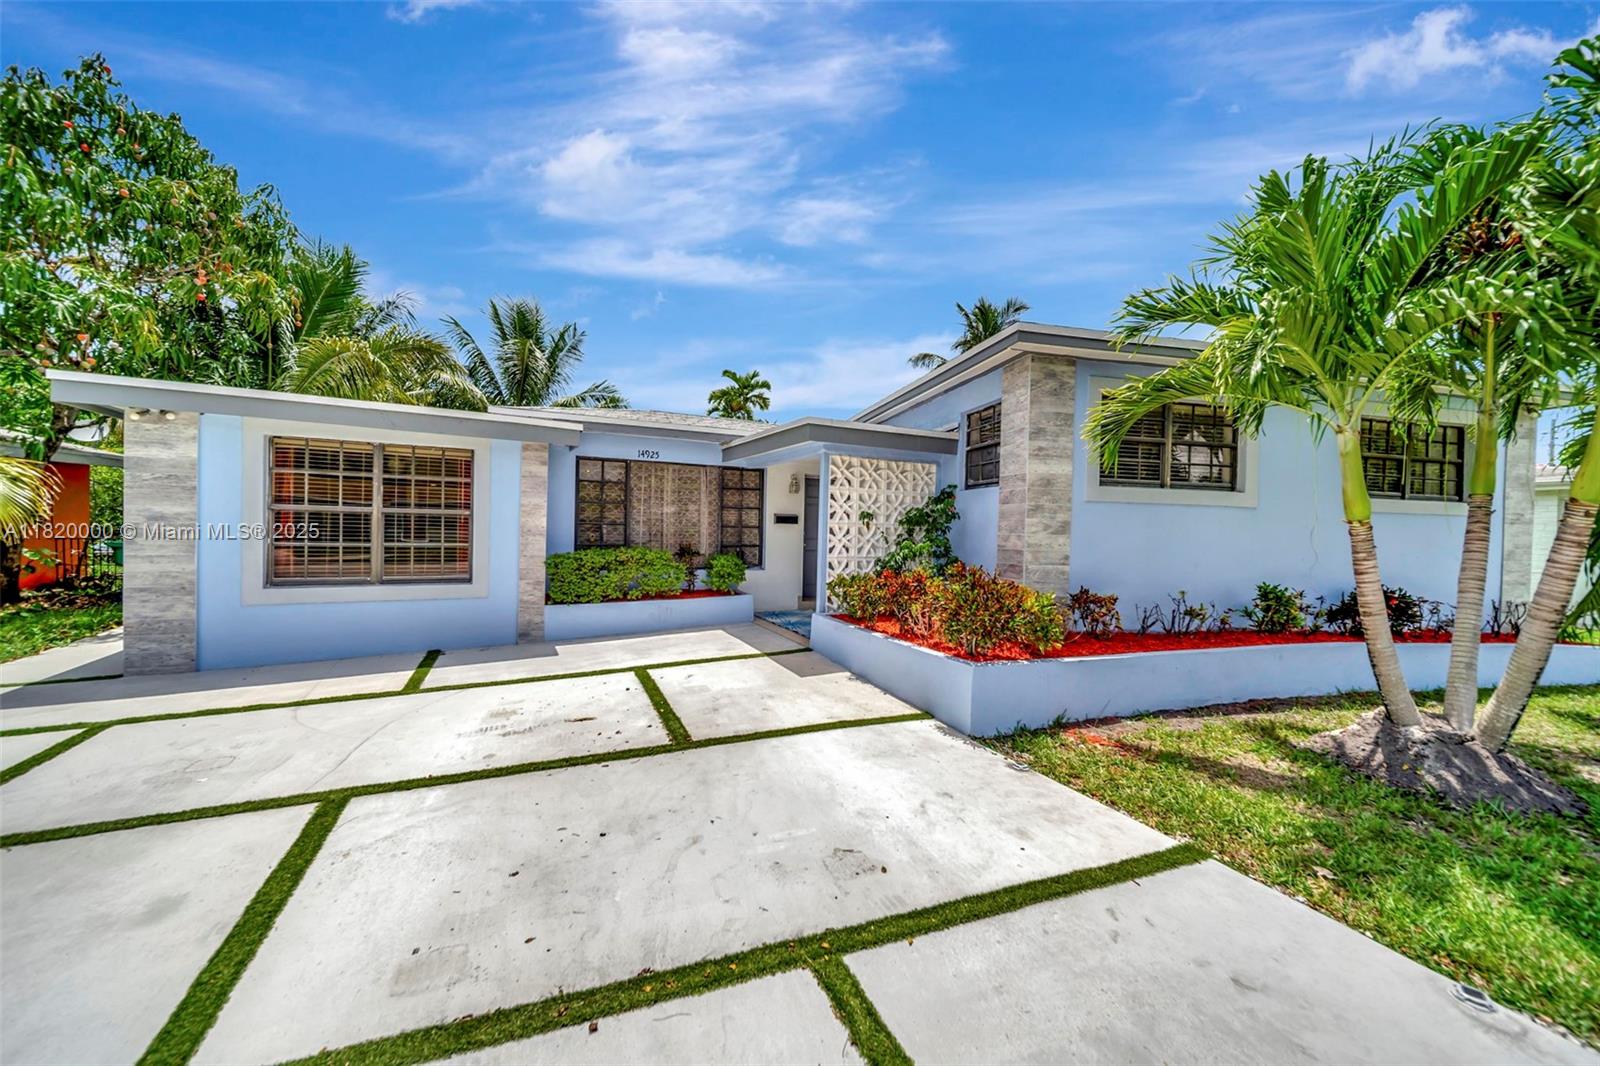
$775,000
4
bds
|
3
ba
|
1,821
sqft
|
built
1957
14925 NE 7th Ave, Miami, FL 33161
$-1,939
Cash flow
-13.1%
Cash-on-Cash Return
3.3%
Cap rate
0.5%
Rent to Value Ratio
Active
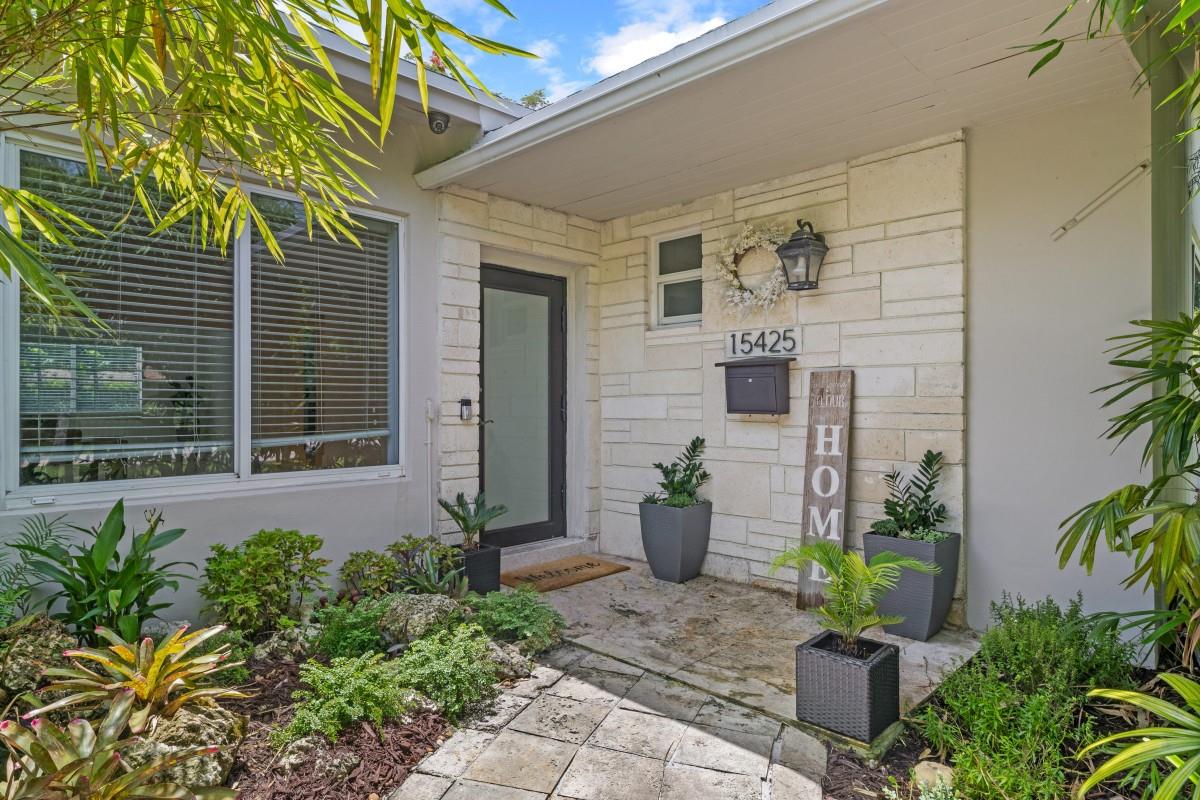
$1,299,000
5
bds
|
3
ba
|
2,810
sqft
|
built
1959
15425 SW 84th Ct, Palmetto Bay, FL 33157
$-3,811
Cash flow
-15.3%
Cash-on-Cash Return
2.8%
Cap rate
0.4%
Rent to Value Ratio

Active
$420,000
2
bds
|
3
ba
|
1,351
sqft
|
built
1981
1651 SW 122nd Ct, Miami, FL 33175
$-880
Cash flow
-10.9%
Cash-on-Cash Return
3.8%
Cap rate
0.7%
Rent to Value Ratio
Active
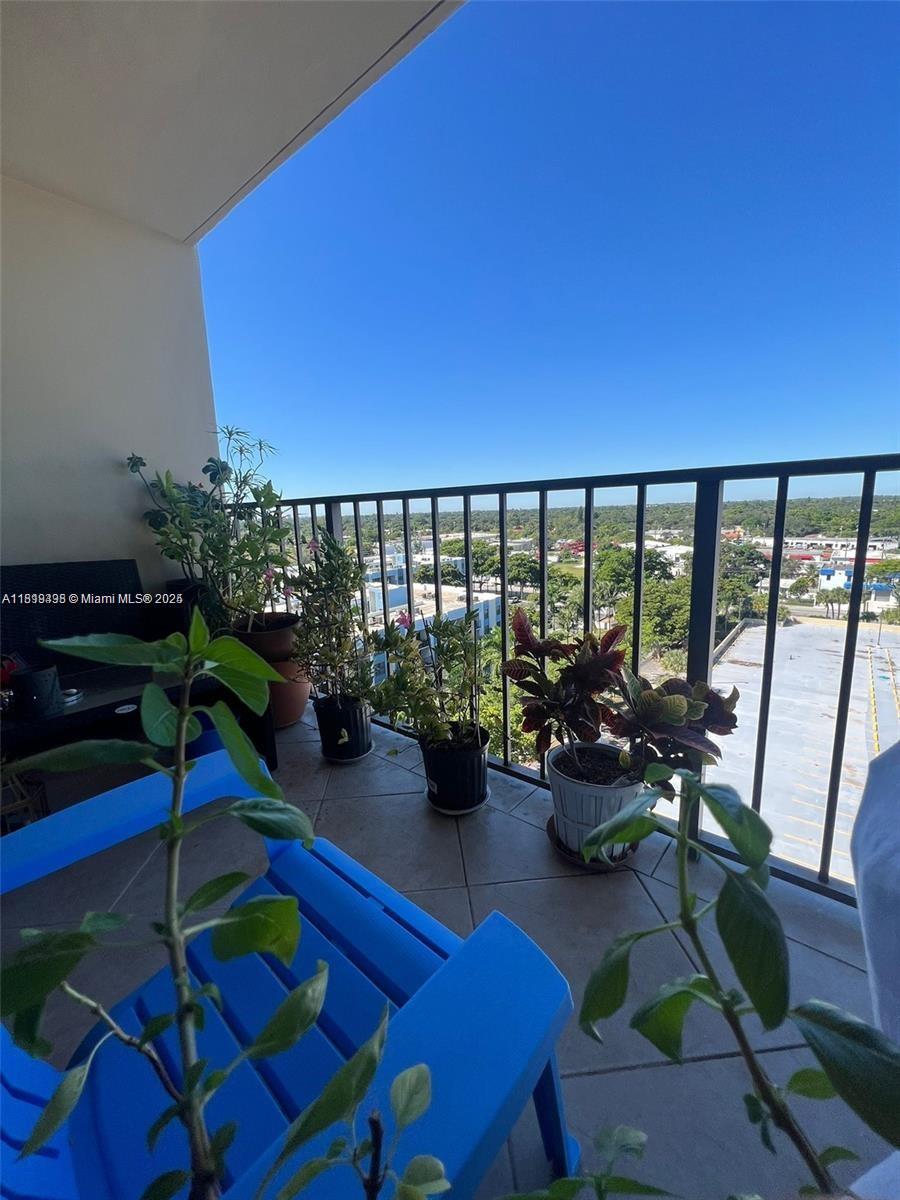
$179,000
1
bds
|
1
ba
|
782
sqft
|
built
1981
1470 NE 123rd St, North Miami, FL 33161
$-581
Cash flow
-16.9%
Cash-on-Cash Return
2.4%
Cap rate
1.0%
Rent to Value Ratio
Active
$1,198,000
2
bds
|
2
ba
|
1,461
sqft
|
built
2008
475 Brickell Ave, Miami, FL 33131
$-4,791
Cash flow
-20.9%
Cash-on-Cash Return
1.5%
Cap rate
0.5%
Rent to Value Ratio
Active
$3,000,000
2
bds
|
0
ba
|
0
sqft
|
built
1920
4245 Braganza Ave, Miami, FL 33133
$-12,153
Cash flow
-21.1%
Cash-on-Cash Return
1.4%
Cap rate
0.2%
Rent to Value Ratio
Active
$360,000
1
bds
|
1
ba
|
754
sqft
|
built
2005
2775 NE 187th St, Aventura, FL 33180
$-1,348
Cash flow
-19.5%
Cash-on-Cash Return
1.8%
Cap rate
0.6%
Rent to Value Ratio

Active
$679,990
4
bds
|
3
ba
|
1,793
sqft
|
built
2016
10380 NW 88th Ter, Doral, FL 33178
$-2,178
Cash flow
-16.7%
Cash-on-Cash Return
2.4%
Cap rate
0.6%
Rent to Value Ratio
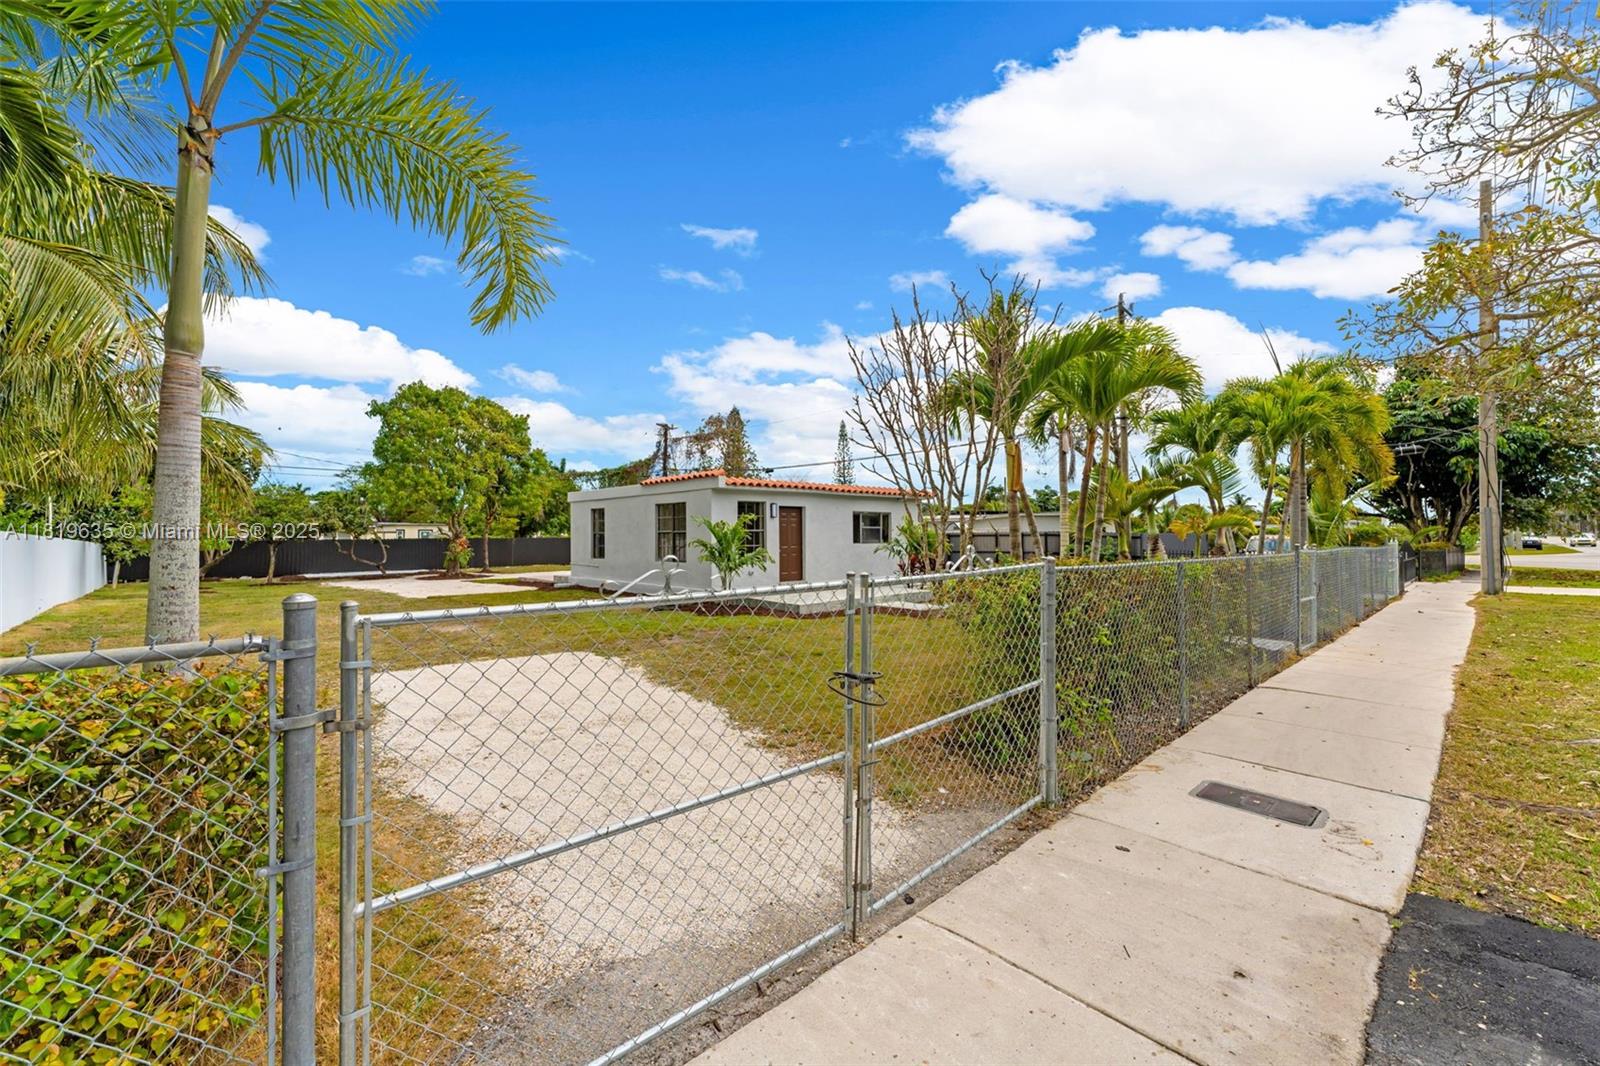
Pending
$425,000
3
bds
|
1
ba
|
792
sqft
|
built
1951
29035 SW 157th Ave, Homestead, FL 33033
$-1,070
Cash flow
-13.1%
Cash-on-Cash Return
3.3%
Cap rate
0.5%
Rent to Value Ratio
Active
$440,000
2
bds
|
3
ba
|
1,150
sqft
|
built
2007
18062 NW 74th Ct, Hialeah, FL 33015
$-1,150
Cash flow
-13.6%
Cash-on-Cash Return
3.1%
Cap rate
0.6%
Rent to Value Ratio
Active
$1,399,000
2
bds
|
2
ba
|
1,286
sqft
|
built
2009
485 Brickell Ave, Miami, FL 33131
$-2,403
Cash flow
-9.0%
Cash-on-Cash Return
4.2%
Cap rate
0.7%
Rent to Value Ratio
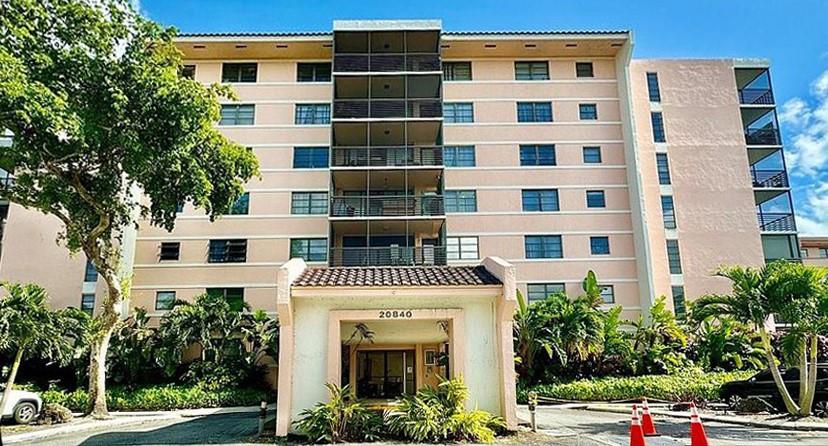
Active
$214,999
2
bds
|
2
ba
|
1,596
sqft
|
built
1983
20840 San Simeon Way, Miami, FL 33179
$-324
Cash flow
-7.9%
Cash-on-Cash Return
4.5%
Cap rate
1.1%
Rent to Value Ratio
Active
$240,000
3
bds
|
2
ba
|
1,200
sqft
|
built
1978
28131 SW 142nd Ct, Homestead, FL 33033
$26
Cash flow
0.6%
Cash-on-Cash Return
6.4%
Cap rate
1.0%
Rent to Value Ratio