Miami Dade County Investment Properties for Sale
Browse homes for sale and investment properties in Miami Dade County. Refine your search by price, property type, or more.
Best cash flowing properties in Miami Dade County
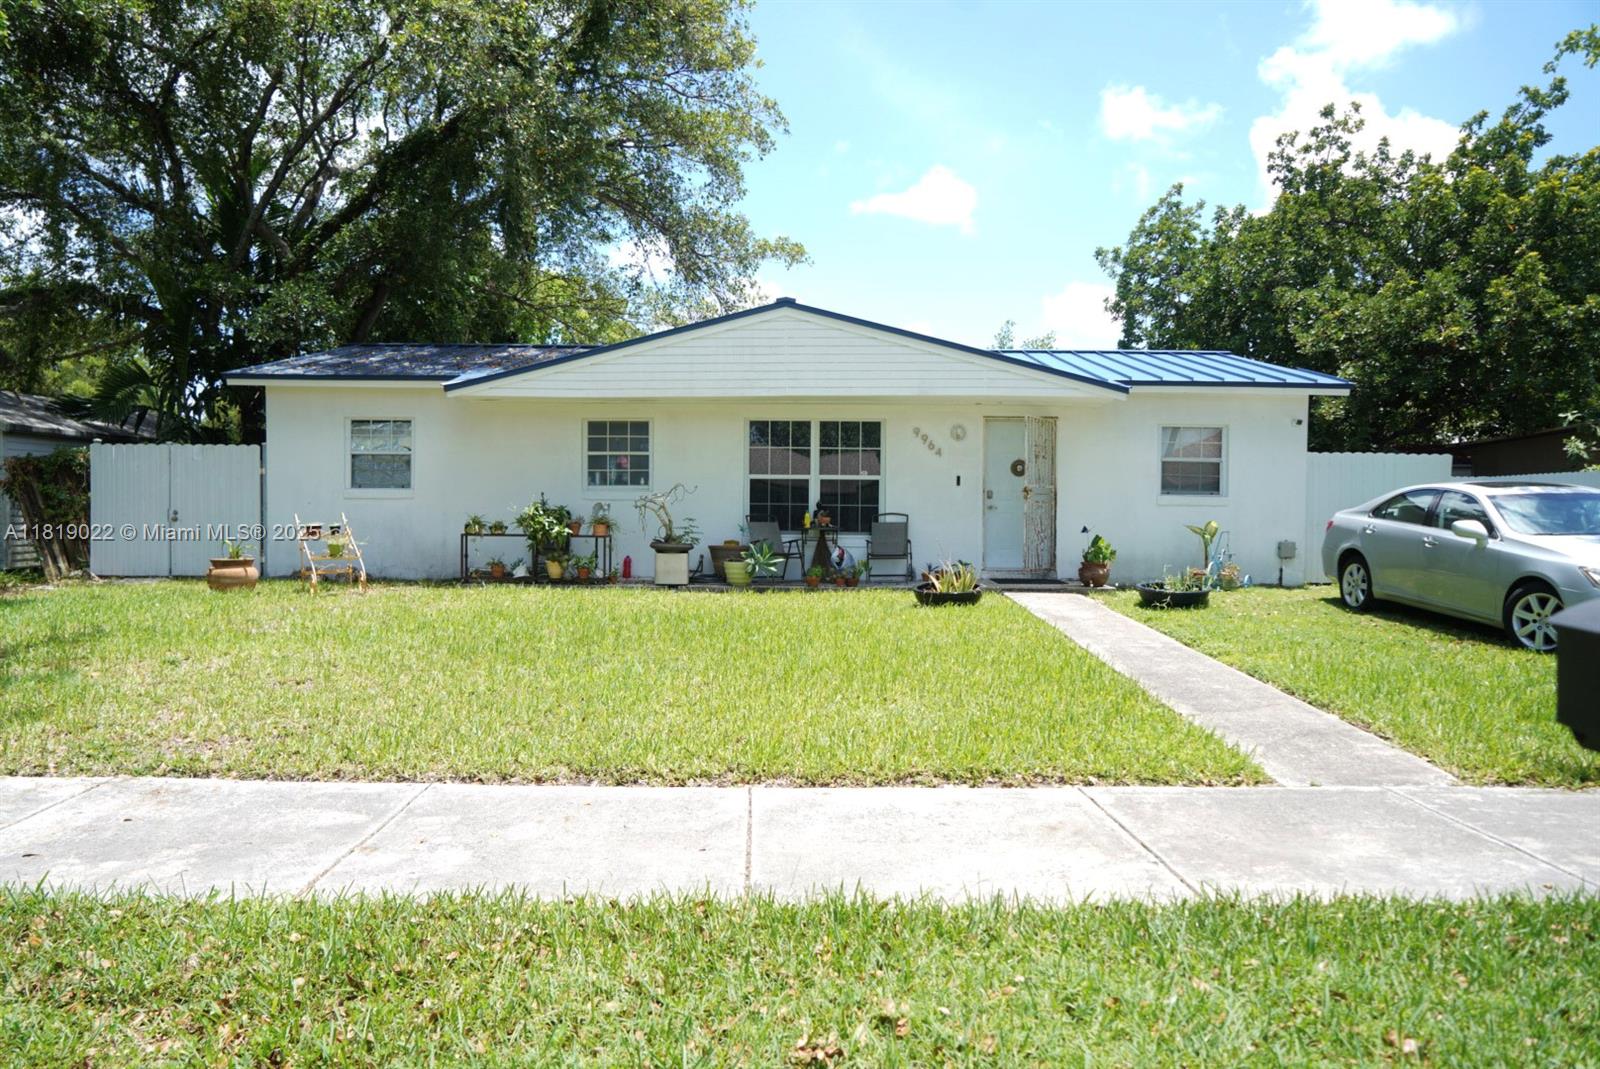
Active
$195,000
1
bds
|
2
ba
|
920
sqft
|
built
2000
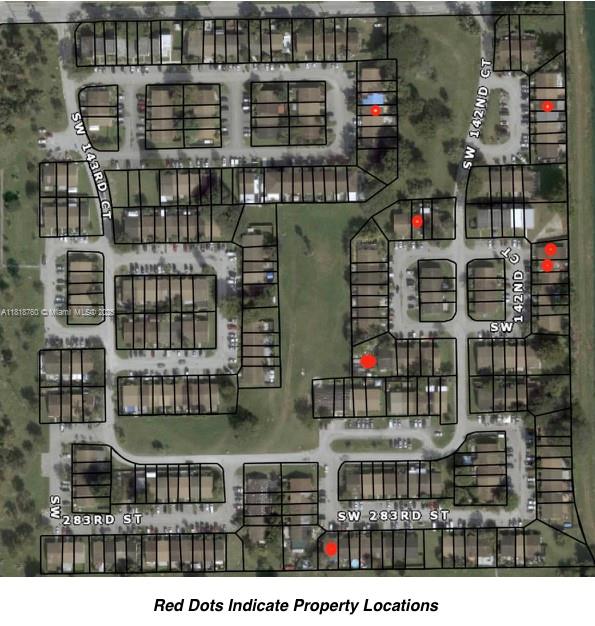
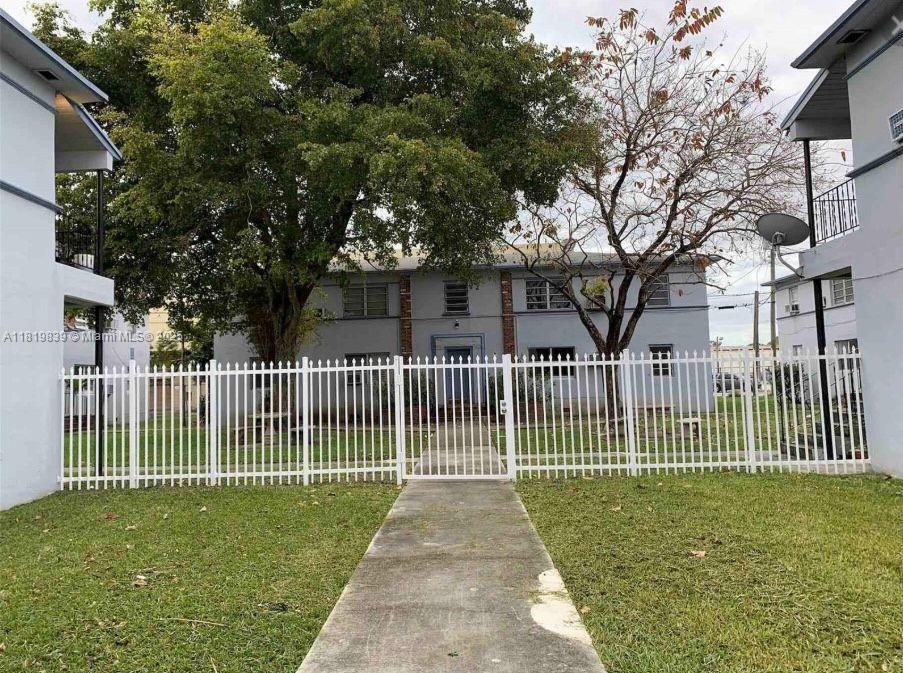
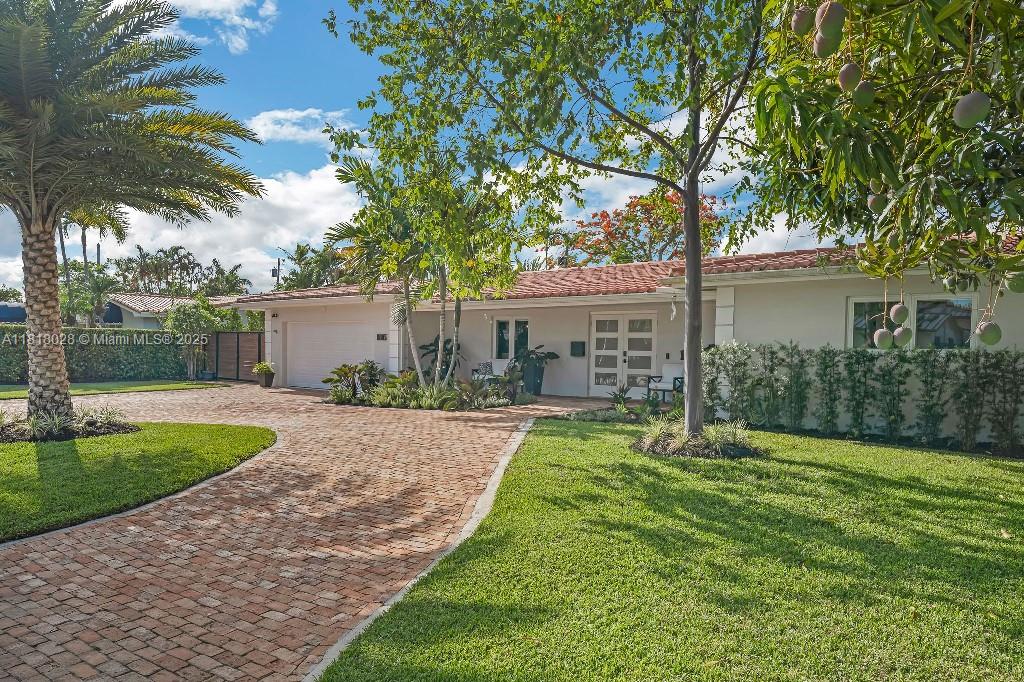
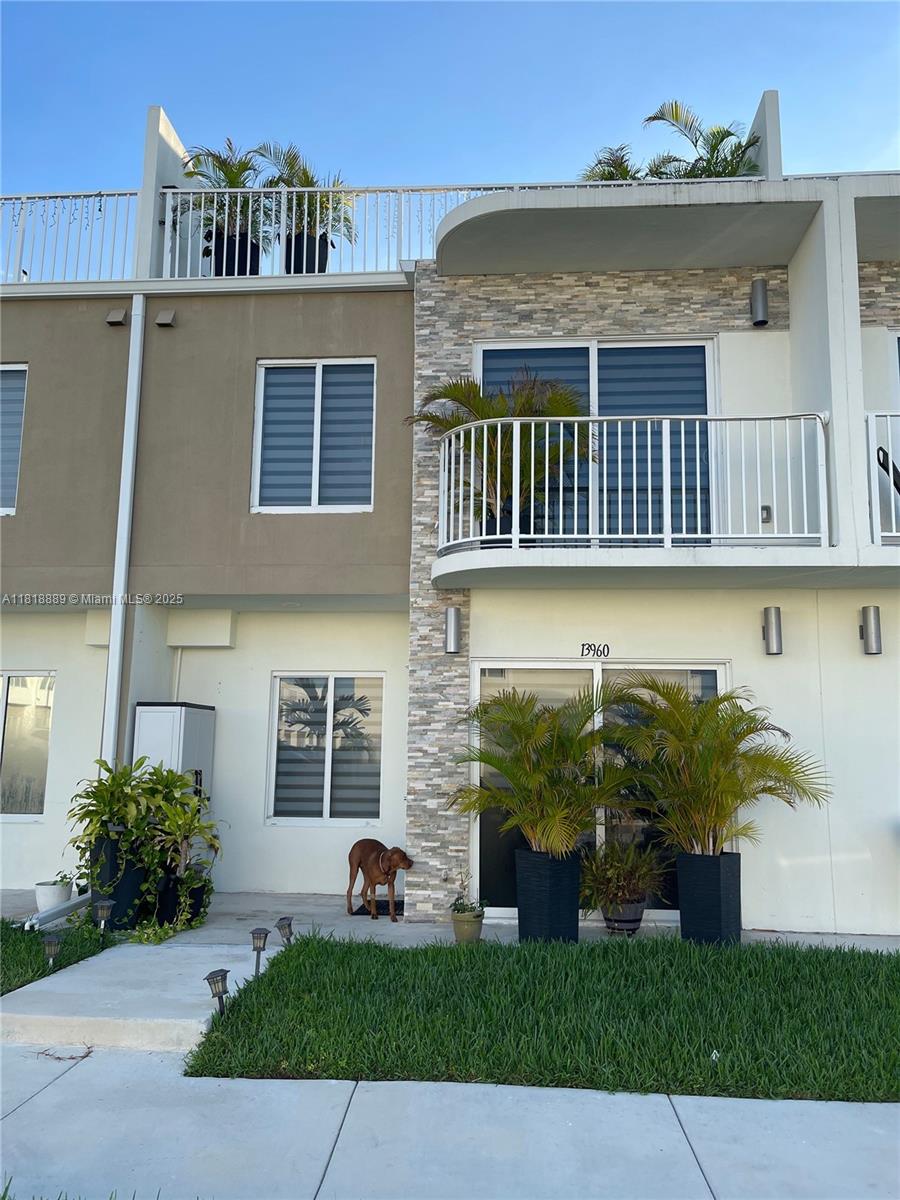
28124 SW 142nd Ct, Homestead, FL 33033
$39
Cash flow
1.0%
Cash-on-Cash Return
6.5%
Cap rate
1.0%
Rent to Value Ratio

Active
$240,000
3
bds
|
2
ba
|
1,200
sqft
|
built
1978
28131 SW 142nd Ct, Homestead, FL 33033
$26
Cash flow
0.6%
Cash-on-Cash Return
6.4%
Cap rate
1.0%
Rent to Value Ratio
10,000 out of 16,821 properties for sale in Miami Dade County
Limited Results Shown
Create a free account, or log in to reveal all property listings and enjoy the complete experience.
Active
$255,000
2
bds
|
2
ba
|
832
sqft
|
built
1972
6825 W Flagler St, Miami, FL 33144
$-356
Cash flow
-7.3%
Cash-on-Cash Return
4.6%
Cap rate
0.9%
Rent to Value Ratio
Active
$999,999
2
bds
|
2
ba
|
1,726
sqft
|
built
1954
950 NE 172nd St, Miami, FL 33162
$-2,938
Cash flow
-15.3%
Cash-on-Cash Return
2.8%
Cap rate
0.4%
Rent to Value Ratio
Active
$664,999
4
bds
|
3
ba
|
2,078
sqft
|
built
1960
1150 W 69th Pl, Hialeah, FL 33014
$-1,152
Cash flow
-9.0%
Cash-on-Cash Return
4.2%
Cap rate
0.5%
Rent to Value Ratio

Active
$385,000
1
bds
|
1
ba
|
890
sqft
|
built
2006
9055 SW 73rd Ct, Pinecrest, FL 33156
$-1,800
Cash flow
-24.4%
Cash-on-Cash Return
0.7%
Cap rate
0.8%
Rent to Value Ratio
Active
$190,000
2
bds
|
1
ba
|
855
sqft
|
built
1945
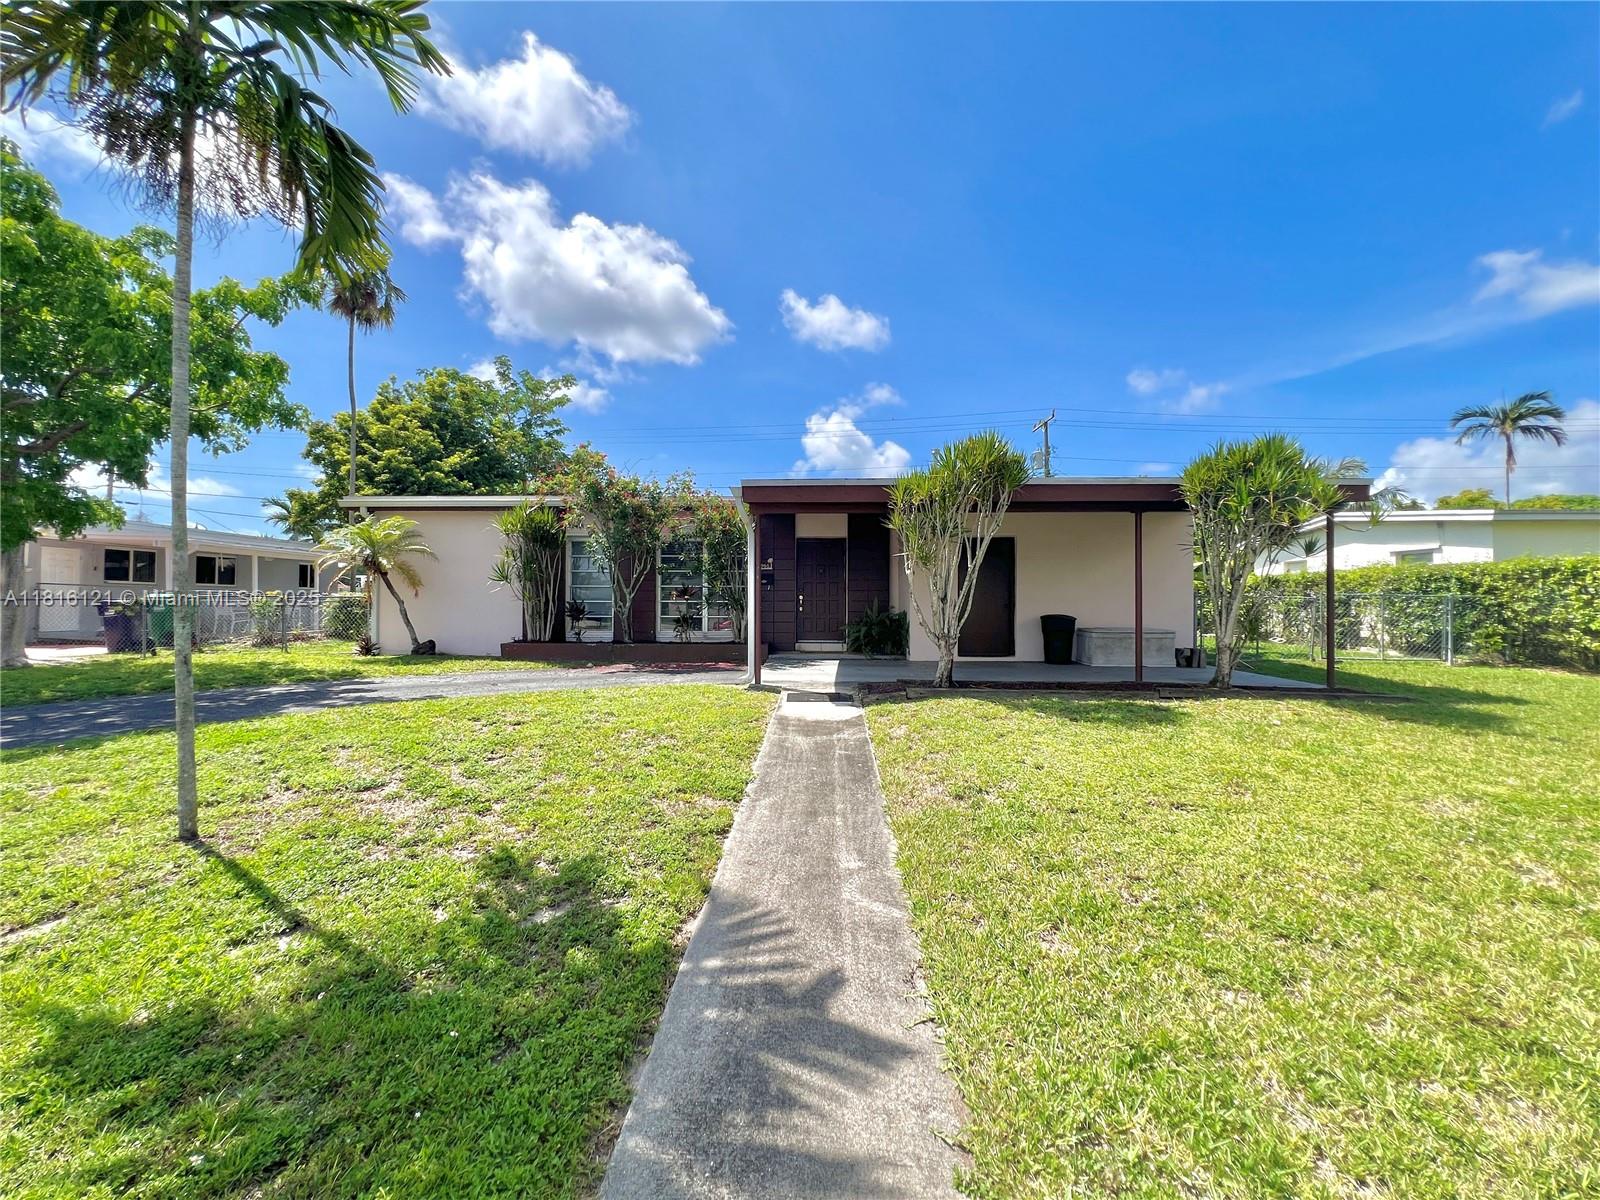
424 NE 82nd St, Miami, FL 33138
$-70
Cash flow
-1.9%
Cash-on-Cash Return
5.8%
Cap rate
1.2%
Rent to Value Ratio
Active
$249,900
0
bds
|
1
ba
|
571
sqft
|
built
1985
700 NE 63rd St, Miami, FL 33138
$-961
Cash flow
-20.1%
Cash-on-Cash Return
1.7%
Cap rate
0.8%
Rent to Value Ratio
Active
$195,000
1
bds
|
2
ba
|
920
sqft
|
built
2000
28124 SW 142nd Ct, Homestead, FL 33033
$39
Cash flow
1.0%
Cash-on-Cash Return
6.5%
Cap rate
1.0%
Rent to Value Ratio
Active
$240,000
3
bds
|
2
ba
|
1,200
sqft
|
built
1978
28131 SW 142nd Ct, Homestead, FL 33033
$26
Cash flow
0.6%
Cash-on-Cash Return
6.4%
Cap rate
1.0%
Rent to Value Ratio
Active
$3,290,000
3
bds
|
3
ba
|
2,117
sqft
|
built
1952
800 E Dilido Dr, Miami Beach, FL 33139
$-13,209
Cash flow
-20.9%
Cash-on-Cash Return
1.5%
Cap rate
0.3%
Rent to Value Ratio

Active
$379,995
2
bds
|
2
ba
|
1,188
sqft
|
built
1972
2150 Sans Souci Blvd, North Miami, FL 33181
$-1,246
Cash flow
-17.1%
Cash-on-Cash Return
2.3%
Cap rate
0.8%
Rent to Value Ratio
Active
$1,275,000
4
bds
|
3
ba
|
2,086
sqft
|
built
1944
3075 SW 19th St, Miami, FL 33145
$-3,940
Cash flow
-16.1%
Cash-on-Cash Return
2.6%
Cap rate
0.4%
Rent to Value Ratio
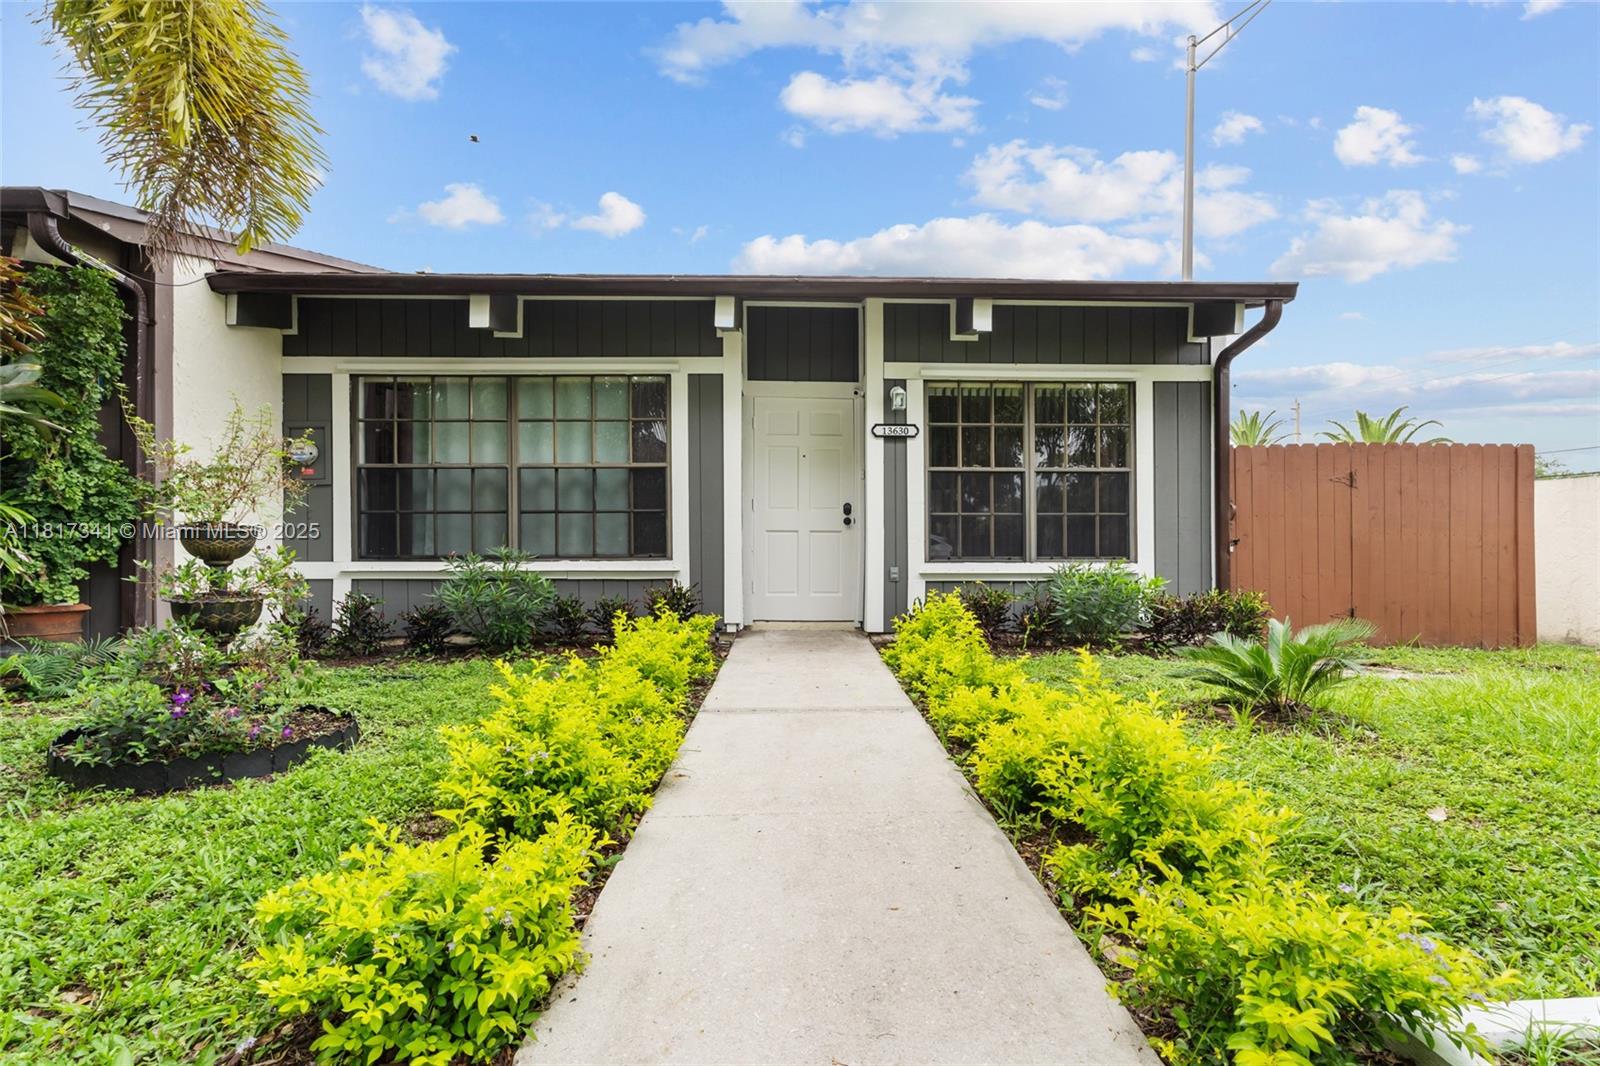
Active
$459,000
2
bds
|
2
ba
|
1,222
sqft
|
built
1979
13630 SW 101st Ln, Miami, FL 33186
$-1,151
Cash flow
-13.1%
Cash-on-Cash Return
3.3%
Cap rate
0.6%
Rent to Value Ratio
Active
$325,000
2
bds
|
2
ba
|
784
sqft
|
built
2007
1 Glen Royal Pkwy, Miami, FL 33125
$-822
Cash flow
-13.2%
Cash-on-Cash Return
3.2%
Cap rate
0.7%
Rent to Value Ratio
Active
$610,000
2
bds
|
2
ba
|
1,024
sqft
|
built
1940
600 Euclid Ave, Miami Beach, FL 33139
$-2,147
Cash flow
-18.4%
Cash-on-Cash Return
2.1%
Cap rate
0.7%
Rent to Value Ratio
Active
$1,499,500
2
bds
|
2
ba
|
1,658
sqft
|
built
2003
400 Alton Rd, Miami Beach, FL 33139
$-7,046
Cash flow
-24.5%
Cash-on-Cash Return
0.6%
Cap rate
0.5%
Rent to Value Ratio
Active
$1,775,000
4
bds
|
2
ba
|
2,361
sqft
|
built
1968
8005 SW 89th St, Miami, FL 33156
$-6,176
Cash flow
-18.2%
Cash-on-Cash Return
2.1%
Cap rate
0.3%
Rent to Value Ratio
Active
$500,000
3
bds
|
2
ba
|
1,050
sqft
|
built
1956
9950 Bahama Dr, Cutler Bay, FL 33189
$-859
Cash flow
-9.0%
Cash-on-Cash Return
4.2%
Cap rate
0.6%
Rent to Value Ratio
Active
$819,900
3
bds
|
3
ba
|
2,254
sqft
|
built
2003
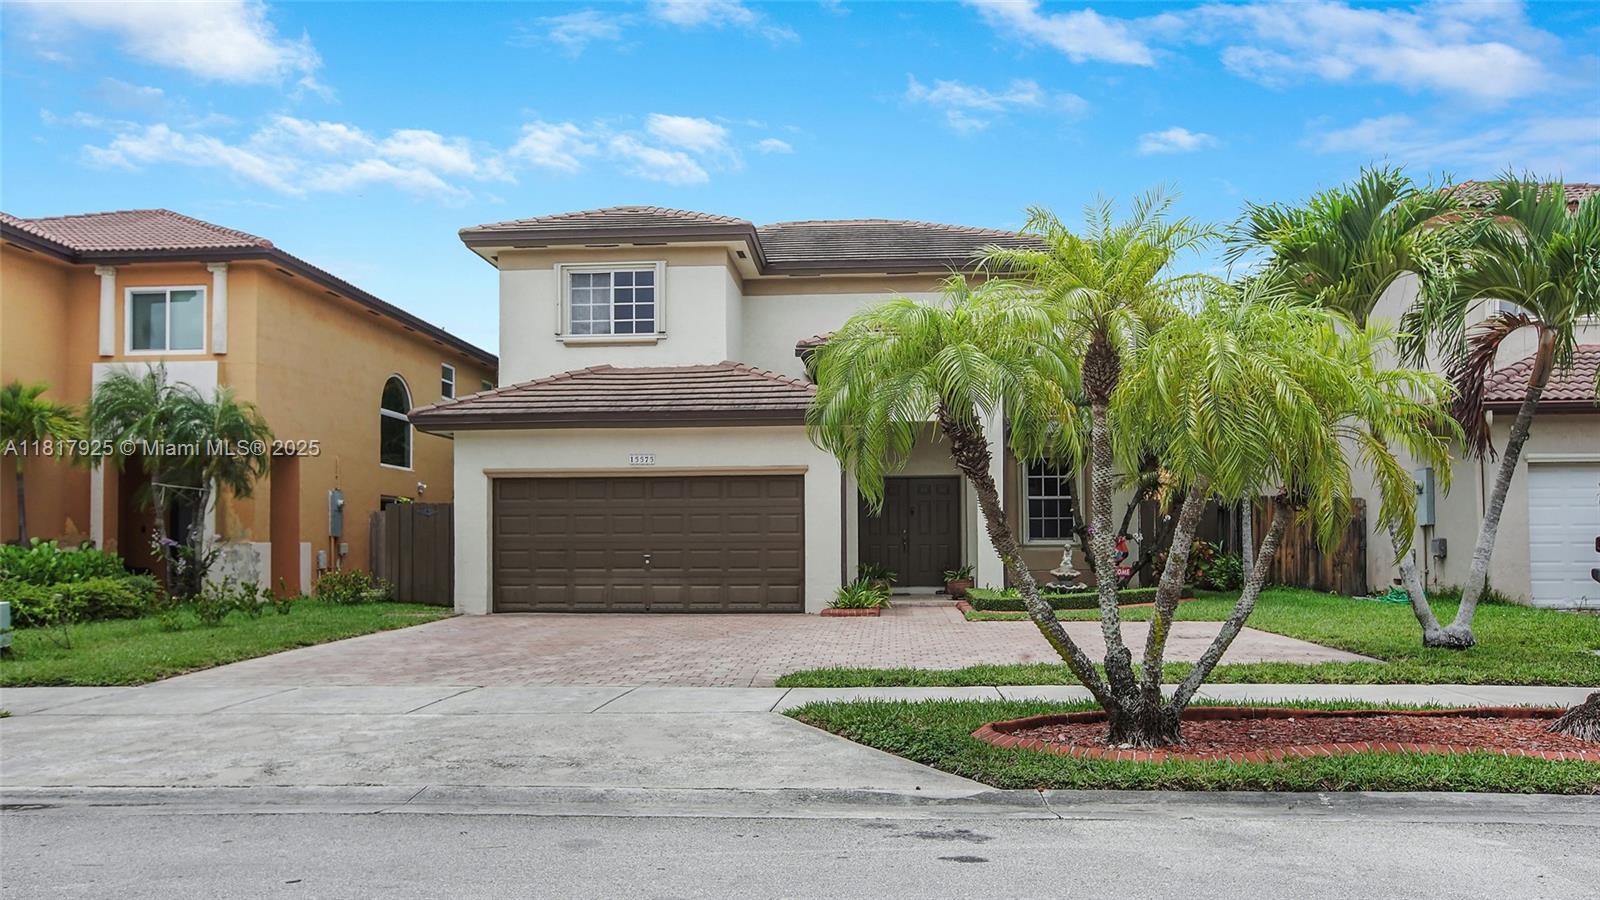
15575 SW 9th Ln, Miami, FL 33194
$-2,097
Cash flow
-13.3%
Cash-on-Cash Return
3.2%
Cap rate
0.5%
Rent to Value Ratio
Active
$455,000
3
bds
|
3
ba
|
1,656
sqft
|
built
2006
23720 SW 114th Pl, Homestead, FL 33032
$-821
Cash flow
-9.4%
Cash-on-Cash Return
4.1%
Cap rate
0.6%
Rent to Value Ratio
Active
$435,900
4
bds
|
4
ba
|
1,434
sqft
|
built
2020
13960 SW 258th Ter, Homestead, FL 33032
$-968
Cash flow
-11.6%
Cash-on-Cash Return
3.6%
Cap rate
0.6%
Rent to Value Ratio

Pending
$550,000
3
bds
|
2
ba
|
1,381
sqft
|
built
2006
21418 SW 89th Path, Cutler Bay, FL 33189
$-1,188
Cash flow
-11.3%
Cash-on-Cash Return
3.7%
Cap rate
0.6%
Rent to Value Ratio

Active
$775,000
2
bds
|
1
ba
|
1,216
sqft
|
built
1935
8730 NE 8th Ct, Miami, FL 33138
$-2,336
Cash flow
-15.7%
Cash-on-Cash Return
2.7%
Cap rate
0.4%
Rent to Value Ratio
Active
$650,000
3
bds
|
2
ba
|
1,673
sqft
|
built
1980
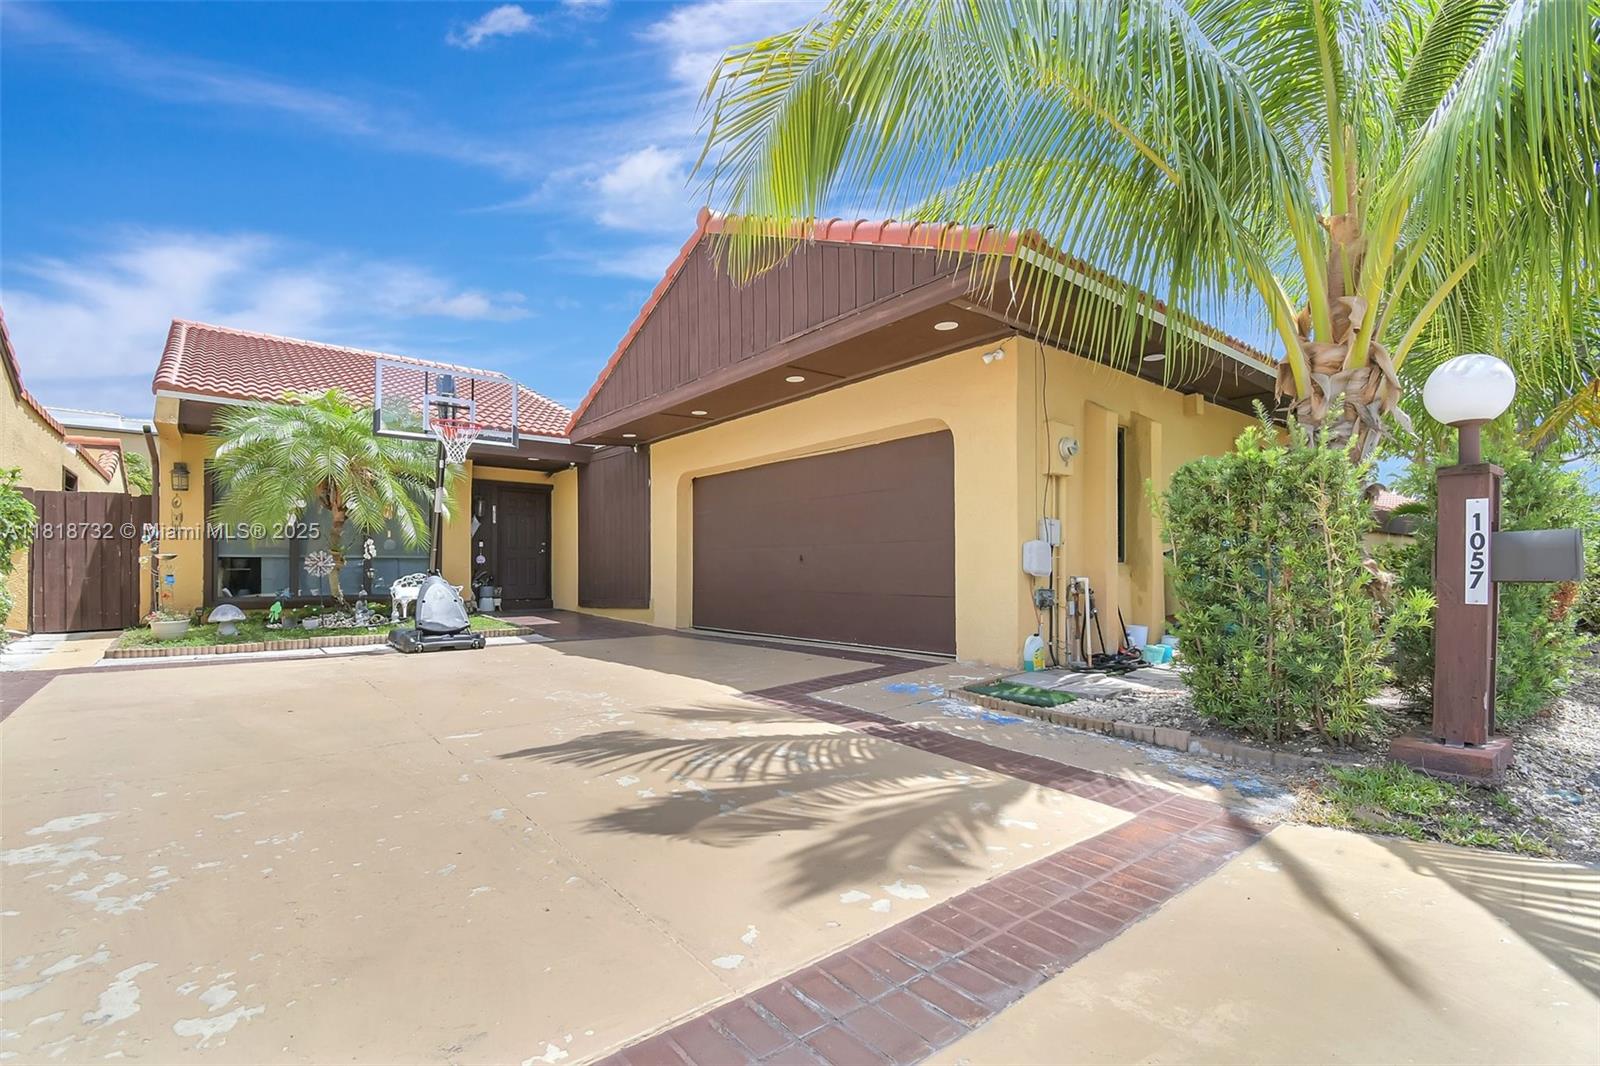
1057 NE 202nd Ln, Miami, FL 33179
$-1,689
Cash flow
-13.6%
Cash-on-Cash Return
3.2%
Cap rate
0.6%
Rent to Value Ratio
Active
$850,000
5
bds
|
4
ba
|
2,382
sqft
|
built
1954
1325 NE 203rd St, Miami, FL 33179
$-2,386
Cash flow
-14.6%
Cash-on-Cash Return
2.9%
Cap rate
0.5%
Rent to Value Ratio
Active
$620,000
3
bds
|
1
ba
|
1,265
sqft
|
built
1953
280 NE 169th St, North Miami Beach, FL 33162
$-1,081
Cash flow
-9.1%
Cash-on-Cash Return
4.2%
Cap rate
0.5%
Rent to Value Ratio
Active
$1,499,999
3
bds
|
4
ba
|
1,641
sqft
|
built
2016
68 SE 6th St, Miami, FL 33131
$-6,070
Cash flow
-21.1%
Cash-on-Cash Return
1.4%
Cap rate
0.6%
Rent to Value Ratio
Active
$590,000
2
bds
|
2
ba
|
1,180
sqft
|
built
2007
1900 N Bayshore Dr, Miami, FL 33132
$-1,880
Cash flow
-16.6%
Cash-on-Cash Return
2.5%
Cap rate
0.8%
Rent to Value Ratio
Active under contract
$305,000
3
bds
|
2
ba
|
972
sqft
|
built
1987
2760 W 61st Pl, Hialeah, FL 33016
$-413
Cash flow
-7.1%
Cash-on-Cash Return
4.7%
Cap rate
0.8%
Rent to Value Ratio
Active
$2,690,000
3
bds
|
3
ba
|
2,536
sqft
|
built
1939
923 Catalonia Ave, Coral Gables, FL 33134
$-10,261
Cash flow
-19.9%
Cash-on-Cash Return
1.7%
Cap rate
0.3%
Rent to Value Ratio
Active
$270,000
1
bds
|
2
ba
|
1,125
sqft
|
built
1972
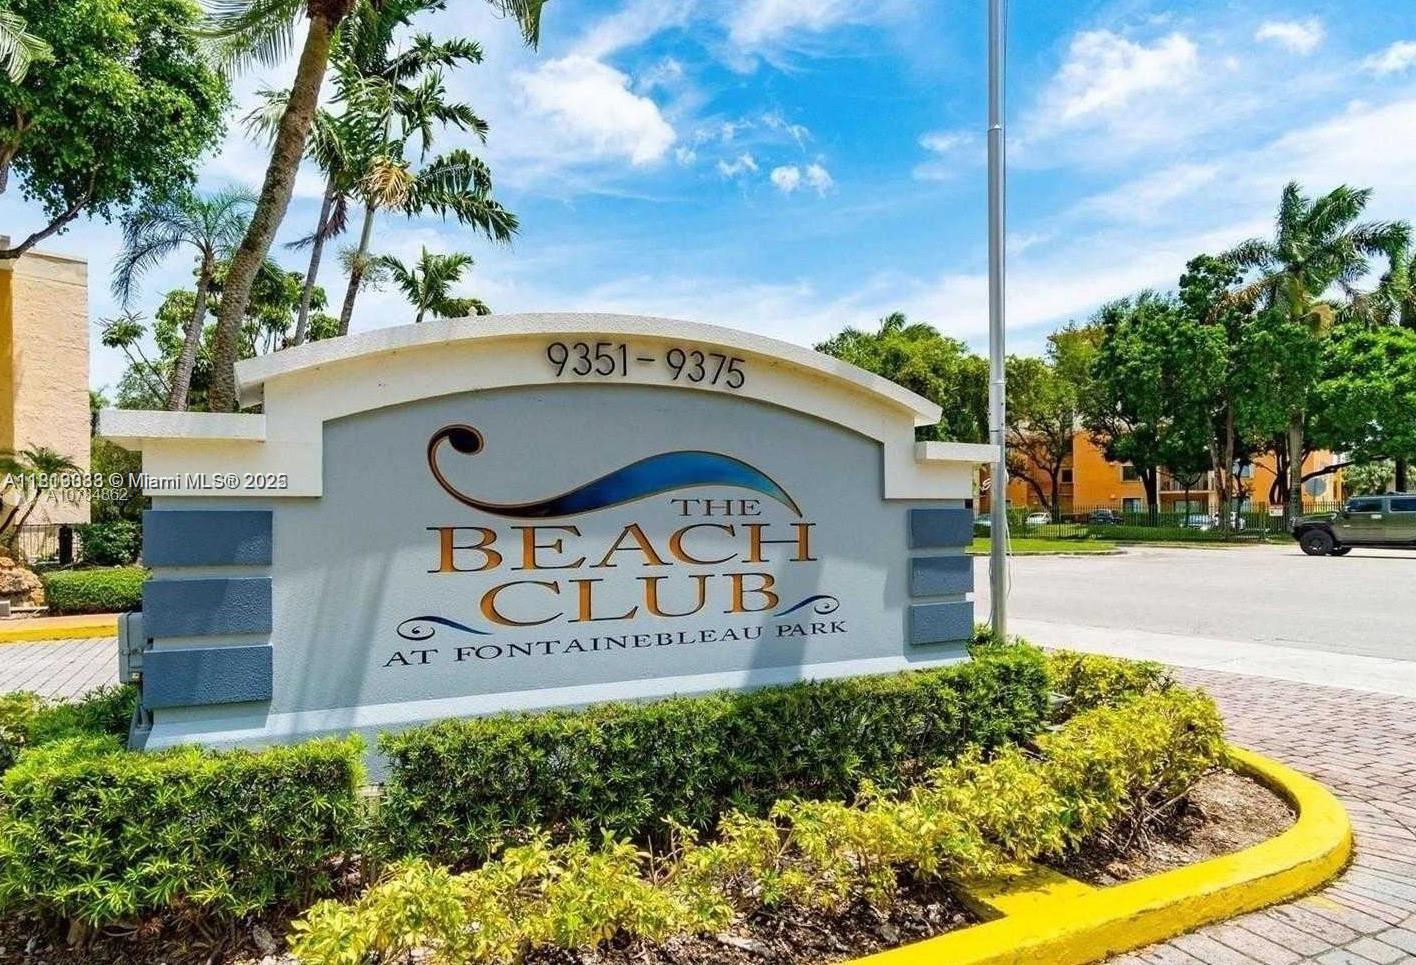
9363 Fontainebleau Blvd, Miami, FL 33172
$-653
Cash flow
-12.6%
Cash-on-Cash Return
3.4%
Cap rate
0.7%
Rent to Value Ratio
Active
$520,000
1
bds
|
2
ba
|
1,000
sqft
|
built
2008
1050 Brickell Ave, Miami, FL 33131
$-2,100
Cash flow
-21.1%
Cash-on-Cash Return
1.4%
Cap rate
0.7%
Rent to Value Ratio
Active
$1,100,000
4
bds
|
0
ba
|
1,924
sqft
|
built
1934
275 NW 81st St, Miami, FL 33150
$-4,434
Cash flow
-21.0%
Cash-on-Cash Return
1.4%
Cap rate
0.2%
Rent to Value Ratio
Active
$1,450,000
1
bds
|
2
ba
|
850
sqft
|
built
1926
2301 Collins Ave, Miami Beach, FL 33139
$-6,179
Cash flow
-22.2%
Cash-on-Cash Return
1.2%
Cap rate
0.4%
Rent to Value Ratio
Active
$1,000,000
2
bds
|
2
ba
|
1,423
sqft
|
built
2006
16699 Collins Ave, Sunny Isles Beach, FL 33160
$-2,817
Cash flow
-14.7%
Cash-on-Cash Return
2.9%
Cap rate
0.7%
Rent to Value Ratio
Active
$780,000
3
bds
|
3
ba
|
1,950
sqft
|
built
1990
1000 E Island Blvd, Aventura, FL 33160
$-3,462
Cash flow
-23.2%
Cash-on-Cash Return
1.0%
Cap rate
0.7%
Rent to Value Ratio
Active
$419,550
1
bds
|
1
ba
|
662
sqft
|
built
1970
345 Ocean Dr, Miami Beach, FL 33139
$-1,632
Cash flow
-20.3%
Cash-on-Cash Return
1.6%
Cap rate
0.7%
Rent to Value Ratio
Active
$3,545,000
3
bds
|
3
ba
|
2,031
sqft
|
built
2006
17875 Collins Ave, Sunny Isles Beach, FL 33160
$-19,891
Cash flow
-29.3%
Cash-on-Cash Return
-0.4%
Cap rate
0.2%
Rent to Value Ratio
Active
$469,900
3
bds
|
1
ba
|
1,058
sqft
|
built
1971
9964 SW 154th St, Miami, FL 33157
$-688
Cash flow
-7.6%
Cash-on-Cash Return
4.5%
Cap rate
0.6%
Rent to Value Ratio
Active
$280,000
2
bds
|
2
ba
|
963
sqft
|
built
1969
2000 NE 135th St, North Miami, FL 33181
$-112
Cash flow
-2.1%
Cash-on-Cash Return
5.8%
Cap rate
0.9%
Rent to Value Ratio
Active
$460,000
1
bds
|
1
ba
|
1,019
sqft
|
built
1965
10185 Collins Ave, Bal Harbour, FL 33154
$-2,039
Cash flow
-23.1%
Cash-on-Cash Return
1.0%
Cap rate
0.7%
Rent to Value Ratio