Miami Dade County Investment Properties for Sale
Browse homes for sale and investment properties in Miami Dade County. Refine your search by price, property type, or more.
Best cash flowing properties in Miami Dade County

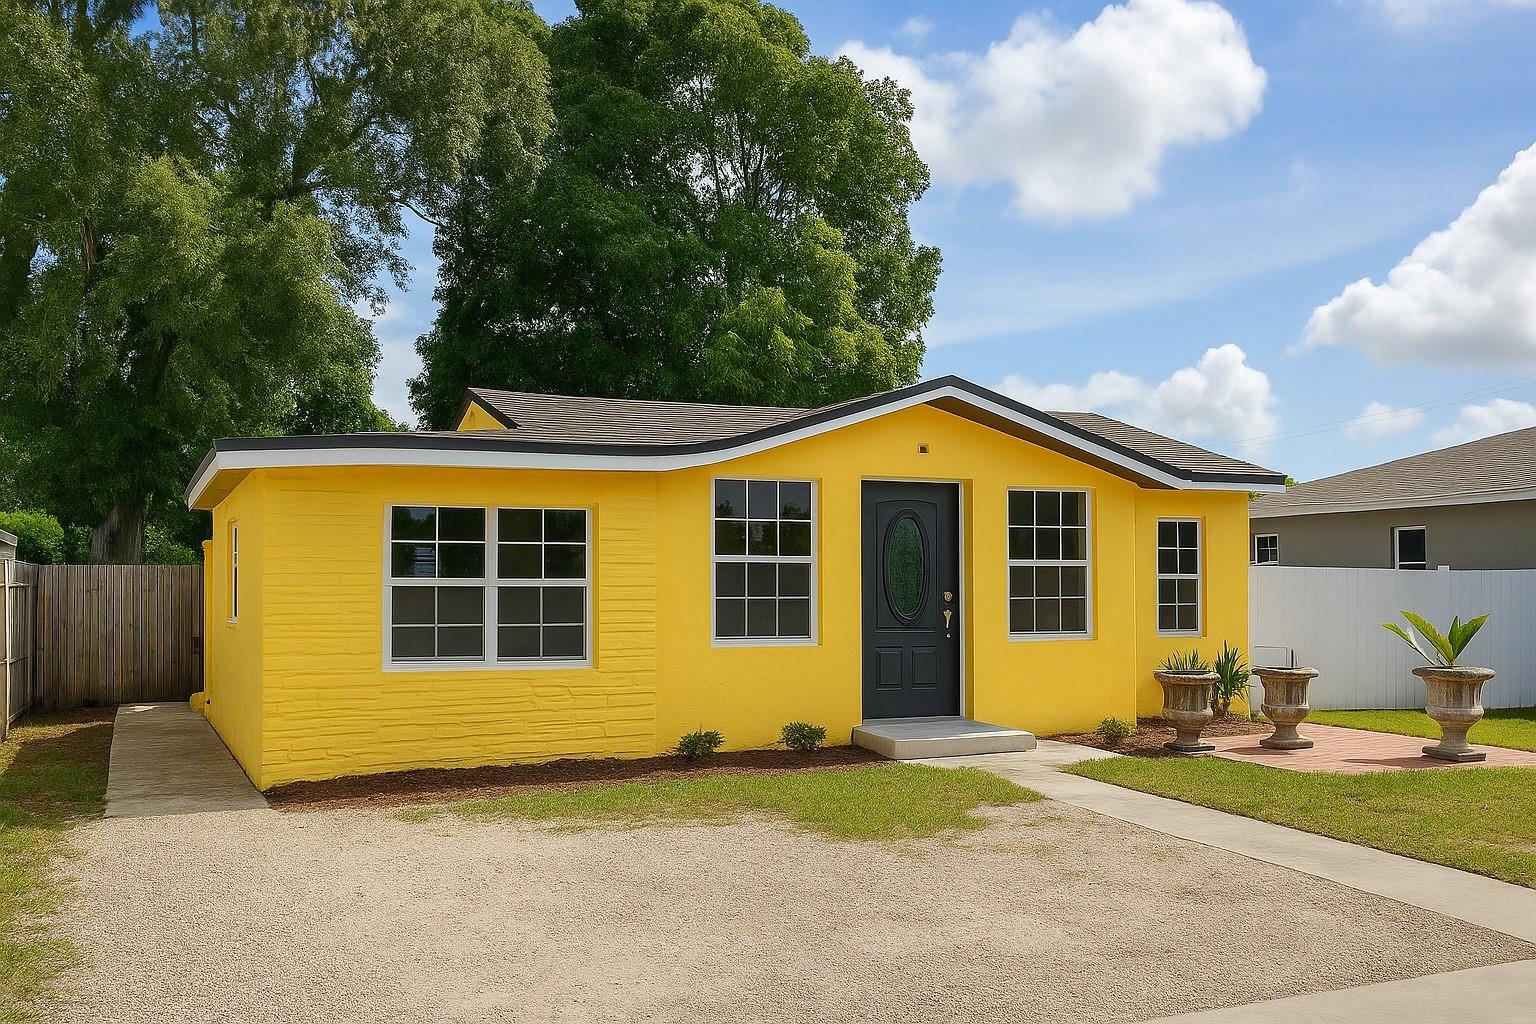
Active
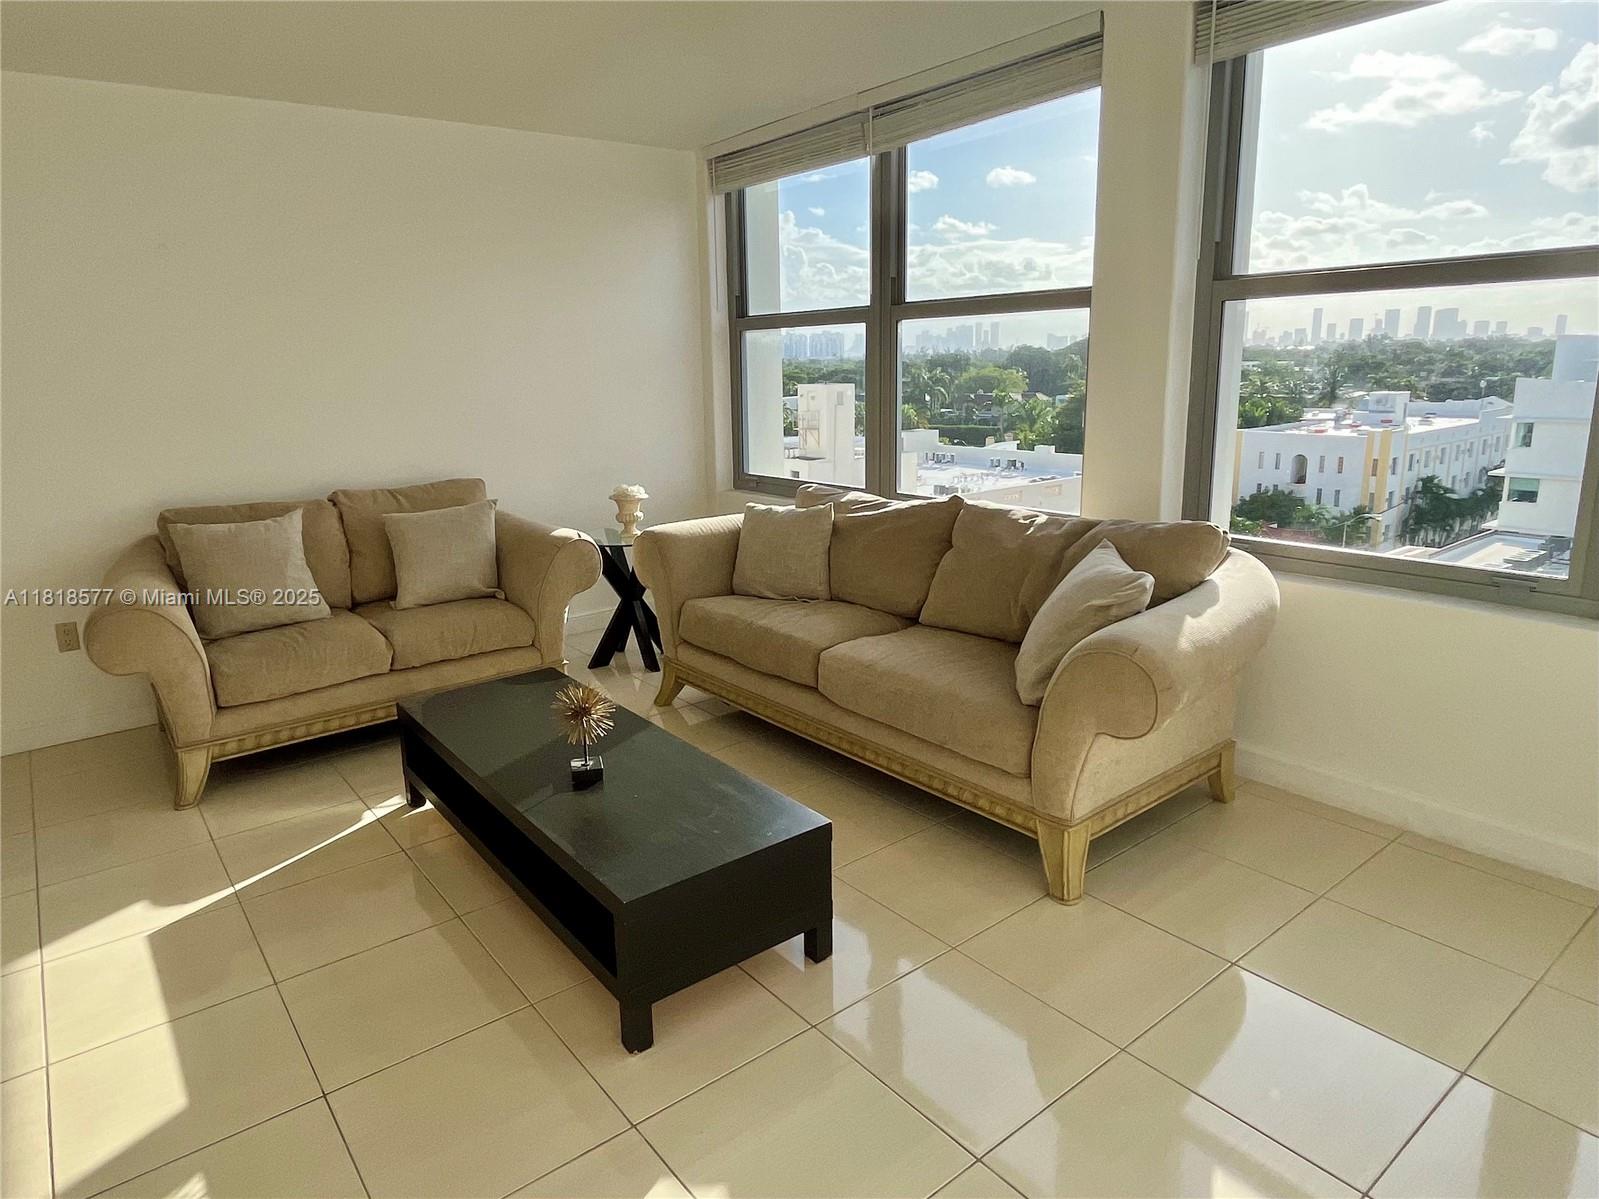
$243,000
2
bds
|
1
ba
|
870
sqft
|
built
1988
18785 NW 62nd Ave, Hialeah, FL 33015
$-234
Cash flow
-5.0%
Cash-on-Cash Return
5.1%
Cap rate
0.9%
Rent to Value Ratio
Active
$425,000
3
bds
|
2
ba
|
1,518
sqft
|
built
1930
2125 NW 43rd St, Miami, FL 33142
$-392
Cash flow
-4.8%
Cash-on-Cash Return
5.2%
Cap rate
0.7%
Rent to Value Ratio
10,000 out of 16,818 properties for sale in Miami Dade County
Limited Results Shown
Create a free account, or log in to reveal all property listings and enjoy the complete experience.
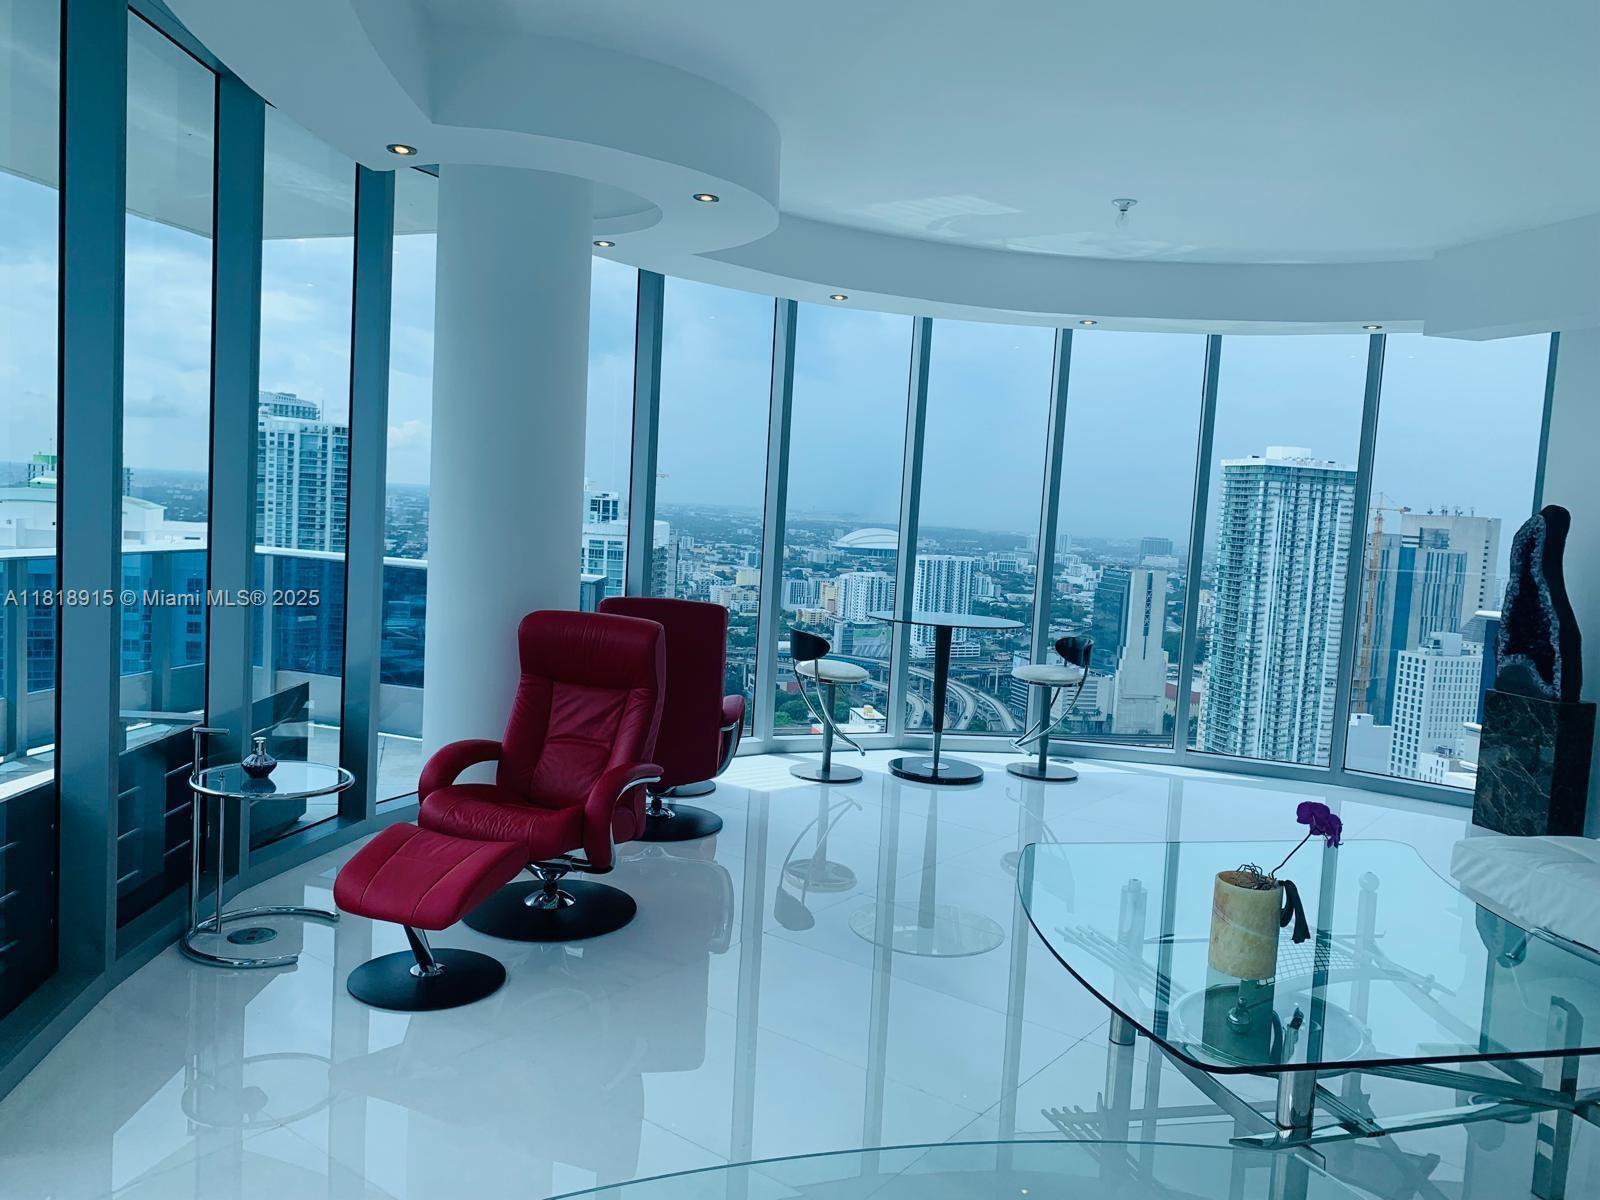
Active
$2,050,000
3
bds
|
4
ba
|
2,457
sqft
|
built
2008
200 Biscayne Boulevard Way, Miami, FL 33131
$-9,390
Cash flow
-23.9%
Cash-on-Cash Return
0.8%
Cap rate
0.5%
Rent to Value Ratio
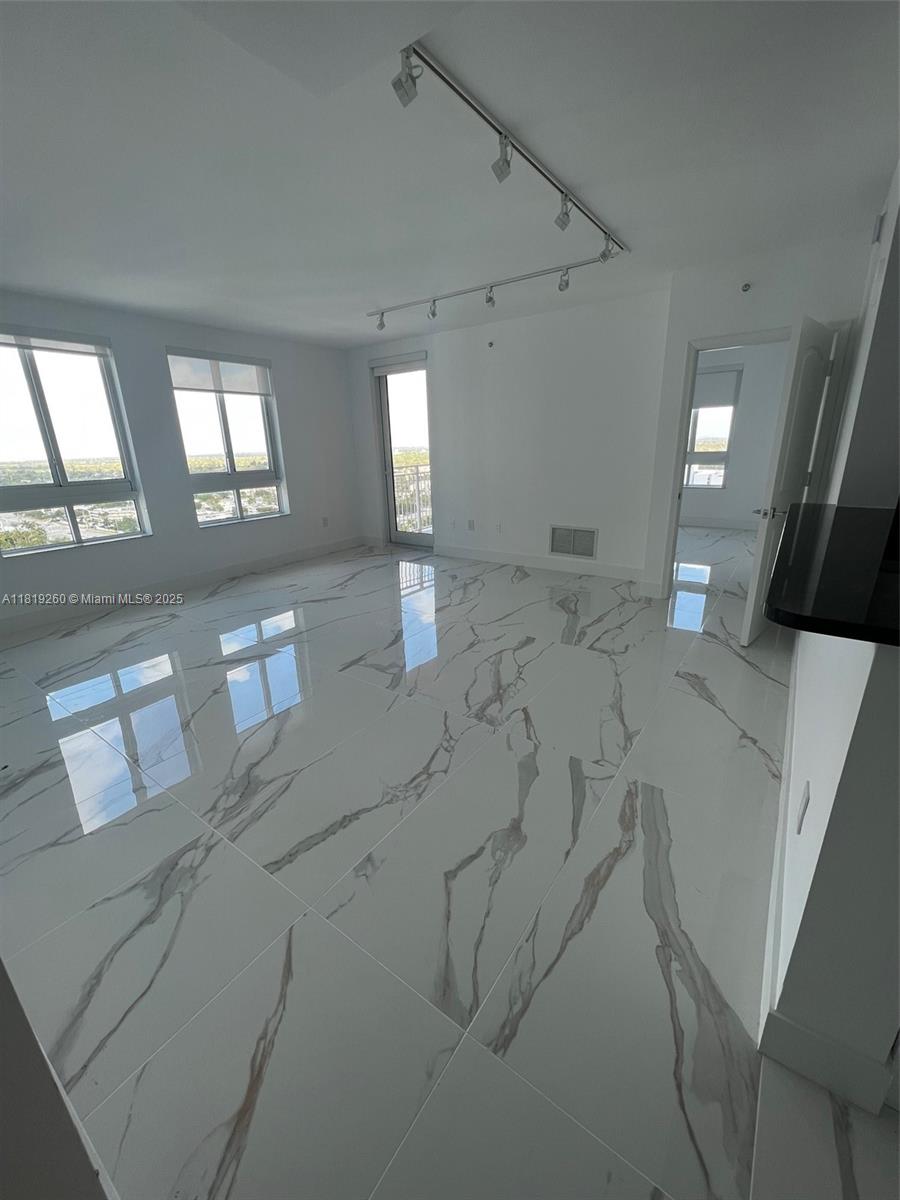
Active
$535,000
2
bds
|
2
ba
|
1,155
sqft
|
built
2007
7350 SW 89th St, Miami, FL 33156
$-2,229
Cash flow
-21.7%
Cash-on-Cash Return
1.3%
Cap rate
0.7%
Rent to Value Ratio

Active
$599,000
4
bds
|
3
ba
|
2,290
sqft
|
built
2005
11373 SW 137th Pl, Miami, FL 33186
$-1,815
Cash flow
-15.8%
Cash-on-Cash Return
2.6%
Cap rate
0.6%
Rent to Value Ratio
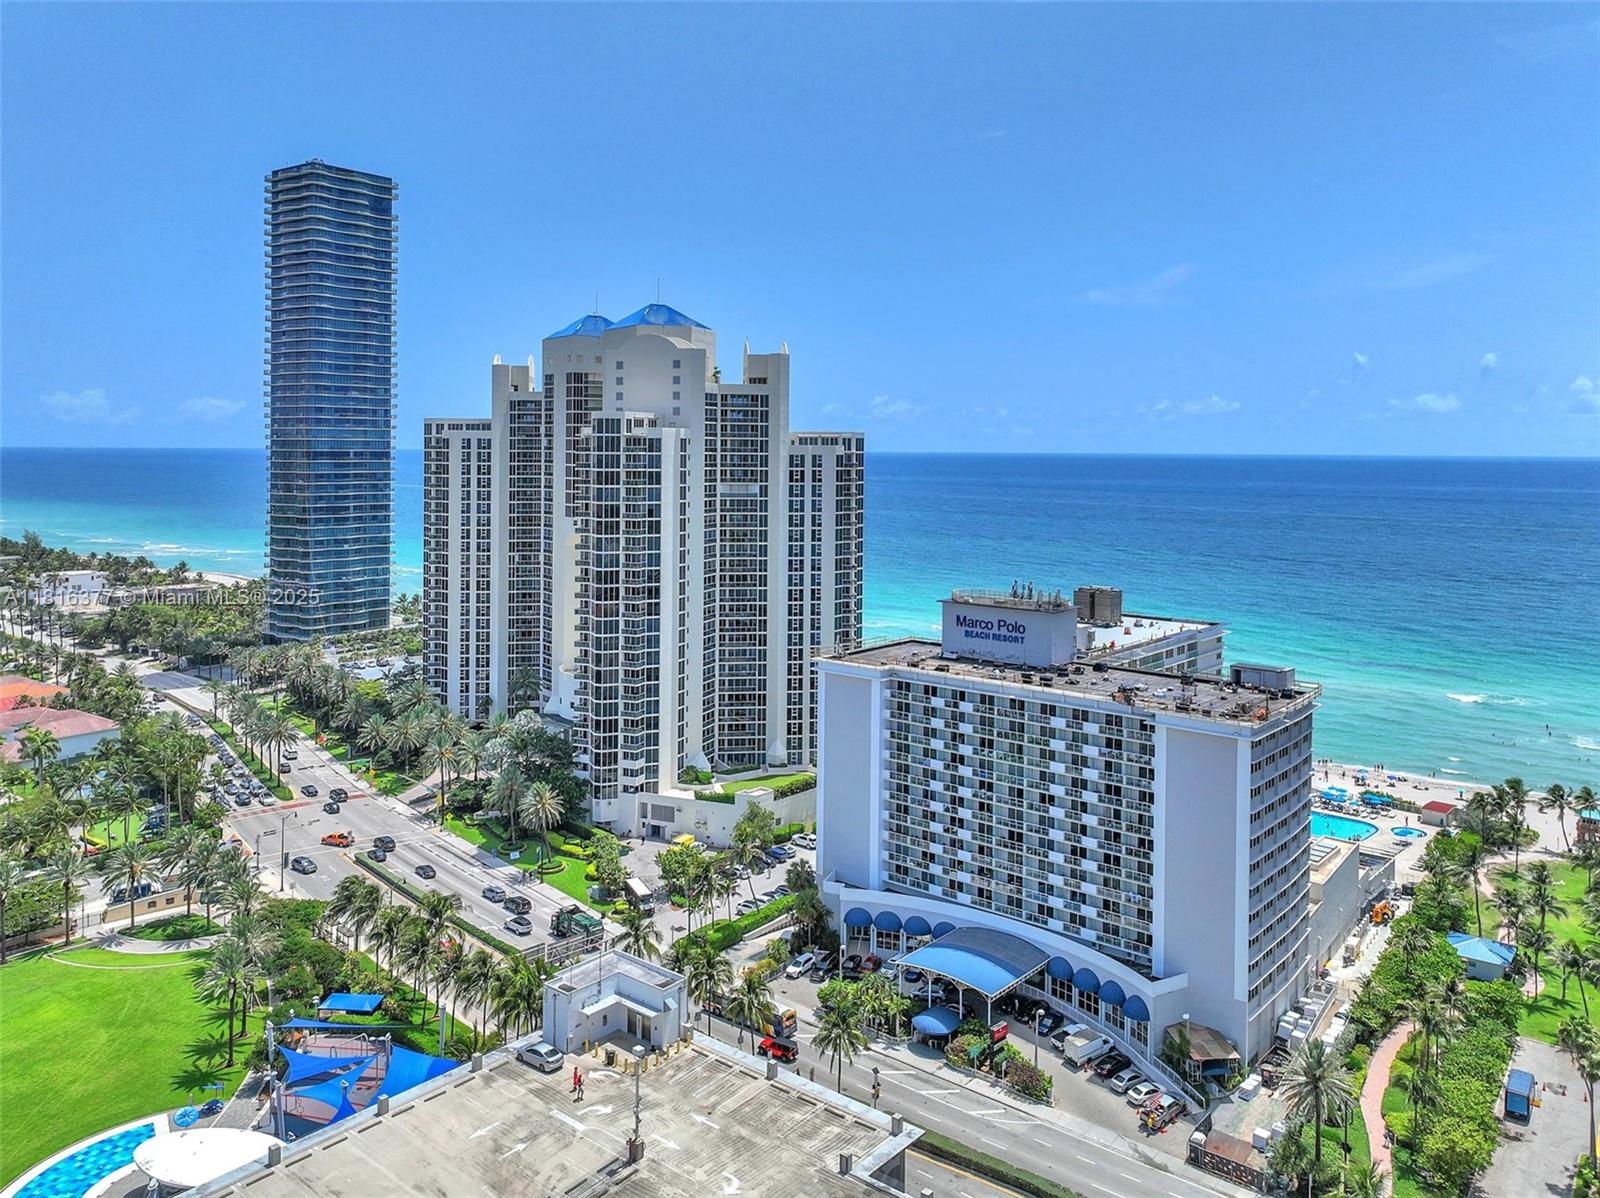
Active
$124,500
bds
|
1
ba
|
370
sqft
|
built
1966
19201 Collins Ave, Sunny Isles Beach, FL 33160
$-845
Cash flow
-35.4%
Cash-on-Cash Return
-1.9%
Cap rate
1.6%
Rent to Value Ratio
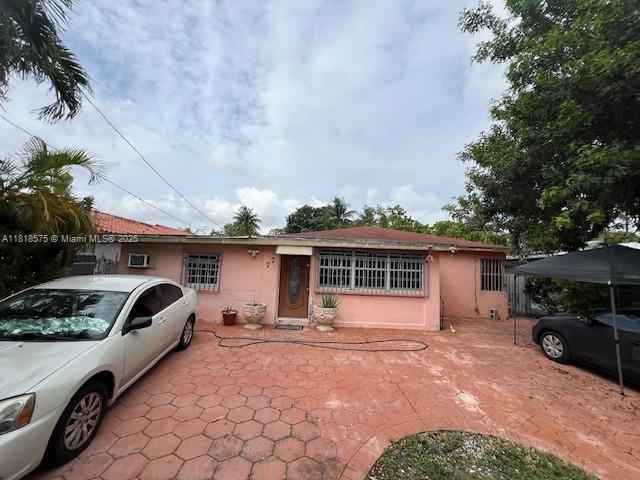
Active
$1,100,000
7
bds
|
0
ba
|
3,031
sqft
|
built
1952
77 Northwest Blvd, Miami, FL 33126
$-4,541
Cash flow
-21.5%
Cash-on-Cash Return
1.3%
Cap rate
0.2%
Rent to Value Ratio
Active
$595,000
3
bds
|
2
ba
|
1,386
sqft
|
built
1991
9835 SW 117th Ct, Miami, FL 33186
$-1,315
Cash flow
-11.5%
Cash-on-Cash Return
3.6%
Cap rate
0.6%
Rent to Value Ratio

Active
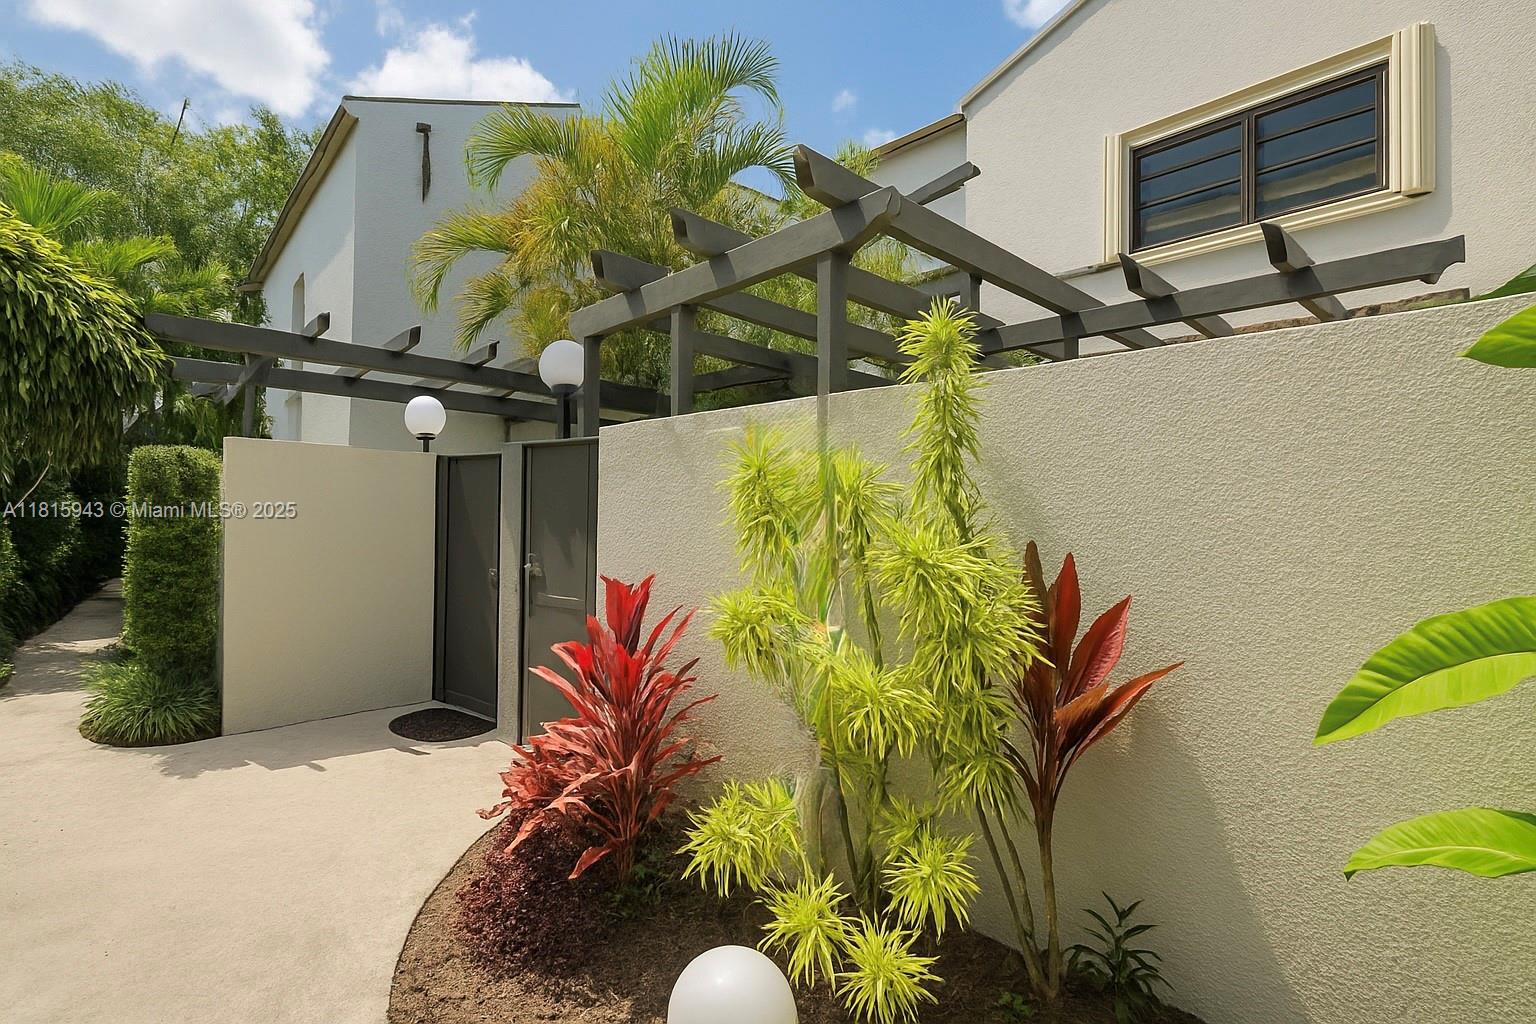
$299,000
1
bds
|
1
ba
|
514
sqft
|
built
1966
3245 Virginia St, Miami, FL 33133
$-852
Cash flow
-14.9%
Cash-on-Cash Return
2.9%
Cap rate
0.7%
Rent to Value Ratio
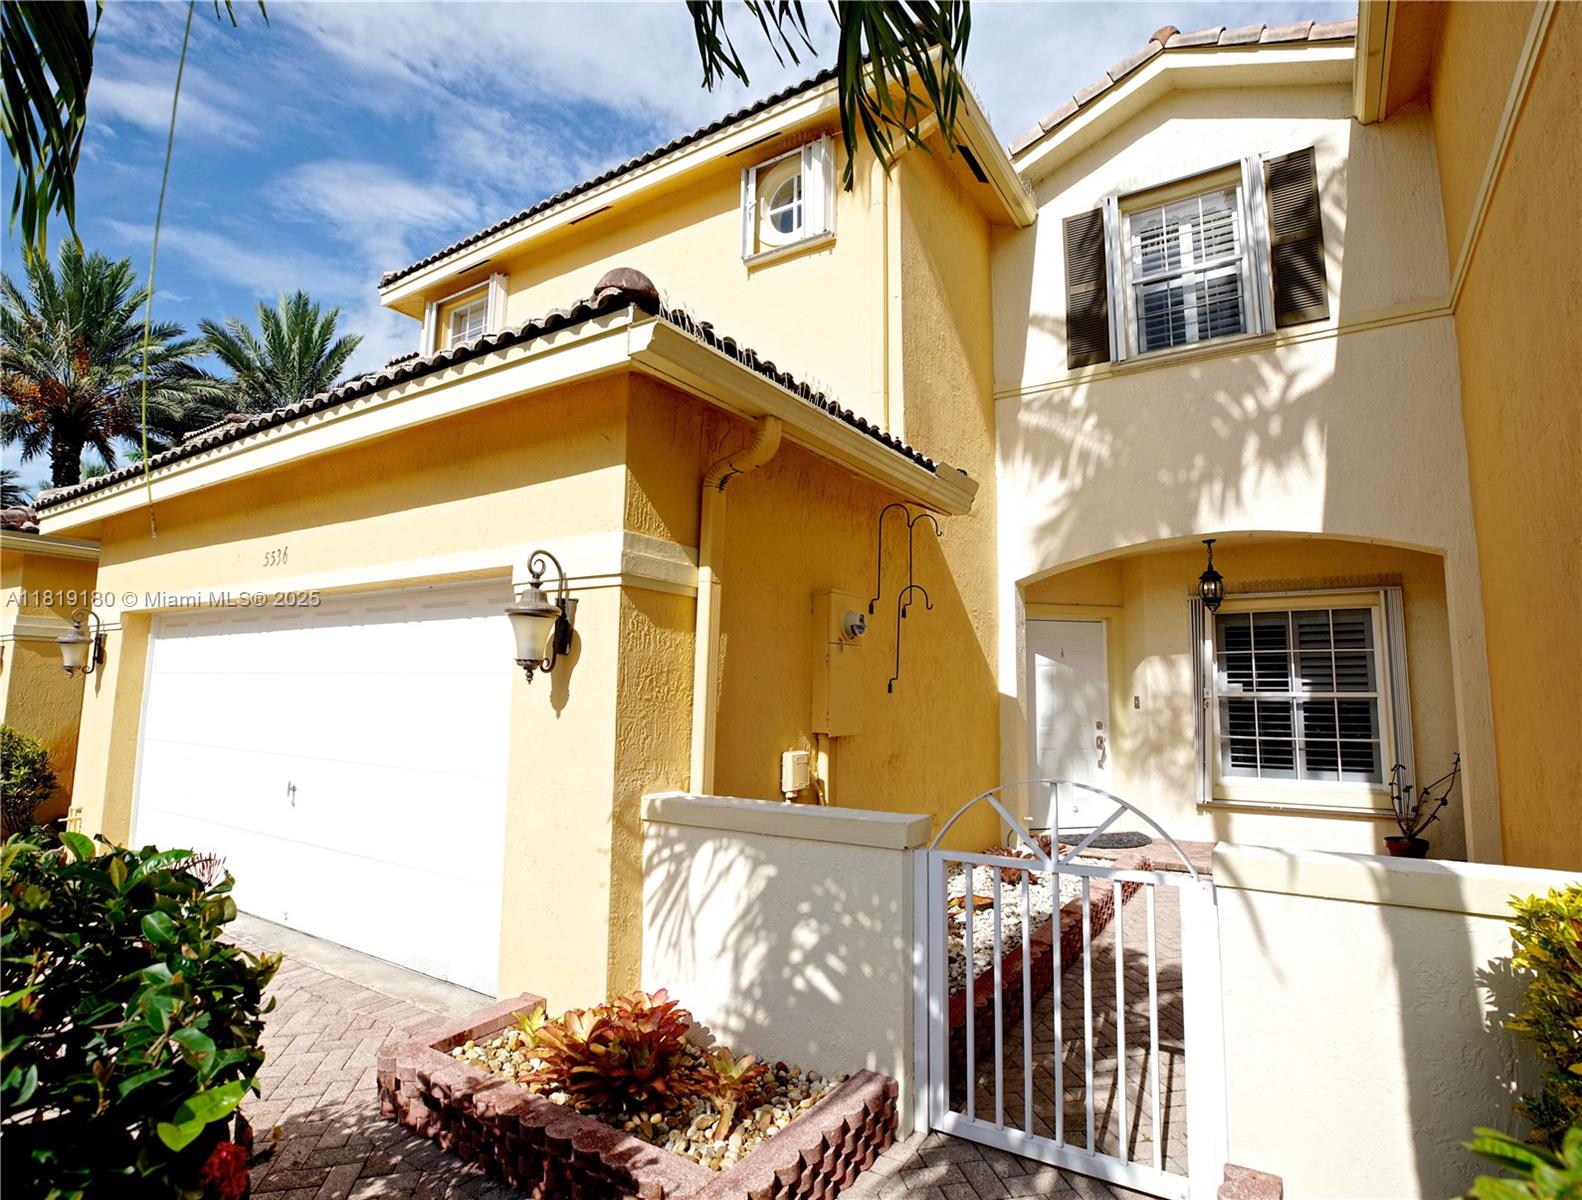
Active
$715,000
3
bds
|
3
ba
|
2,226
sqft
|
built
2002
5536 NW 113th Pl, Doral, FL 33178
$-1,965
Cash flow
-14.3%
Cash-on-Cash Return
3.0%
Cap rate
0.6%
Rent to Value Ratio

Active
$700,000
3
bds
|
2
ba
|
1,801
sqft
|
built
1992
15640 SW 98th St, Miami, FL 33196
$-1,457
Cash flow
-10.9%
Cash-on-Cash Return
3.8%
Cap rate
0.5%
Rent to Value Ratio

Active
$750,000
3
bds
|
2
ba
|
1,558
sqft
|
built
1954
4121 SW 99th Ave, Miami, FL 33165
$-2,261
Cash flow
-15.7%
Cash-on-Cash Return
2.7%
Cap rate
0.5%
Rent to Value Ratio

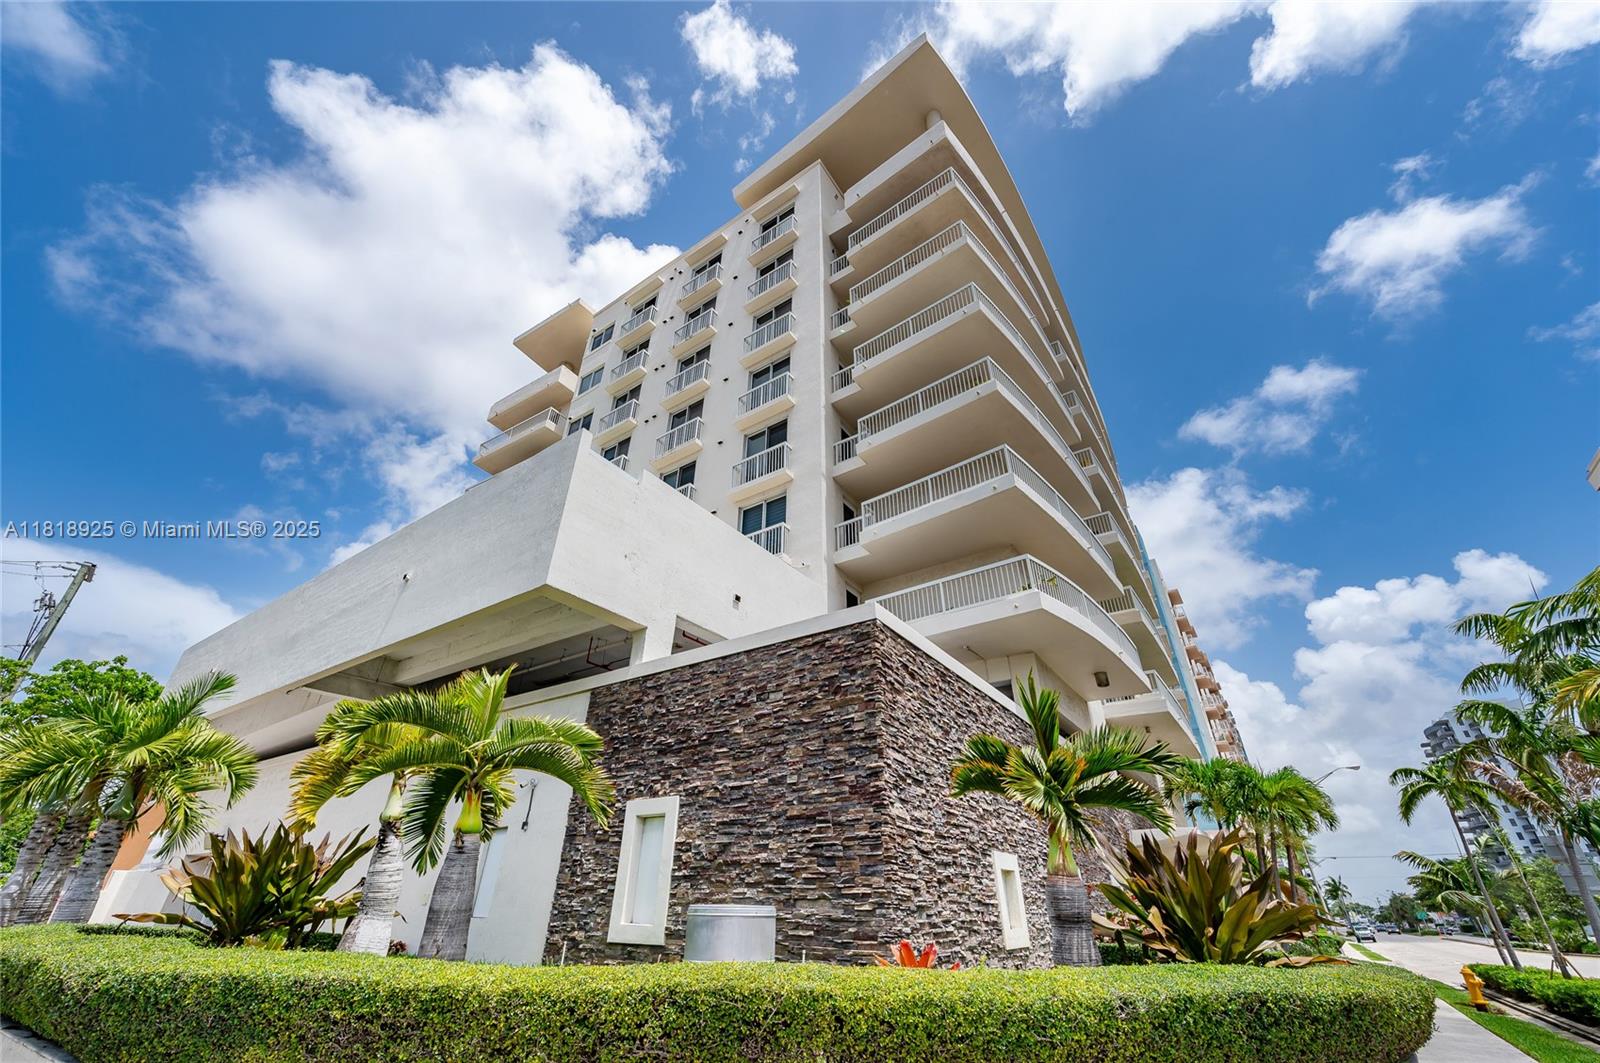
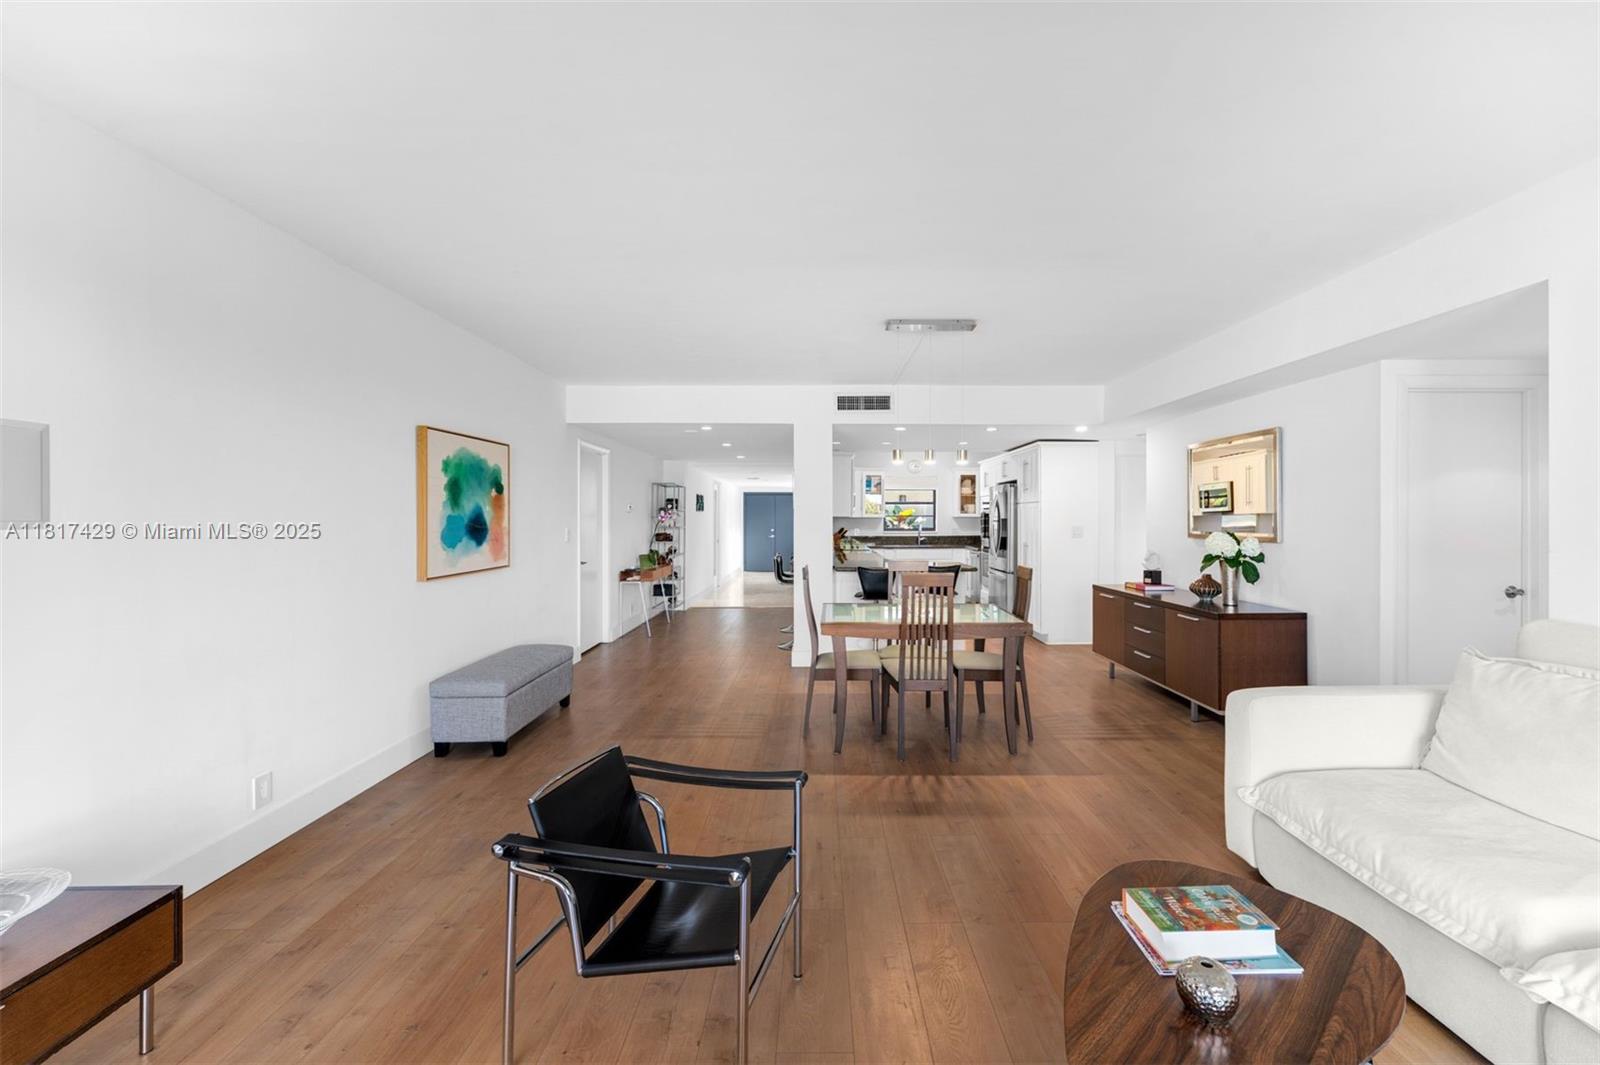
Active
$599,000
2
bds
|
2
ba
|
1,007
sqft
|
built
2006
480 NE 30th St, Miami, FL 33137
$-2,149
Cash flow
-18.7%
Cash-on-Cash Return
2.0%
Cap rate
0.7%
Rent to Value Ratio
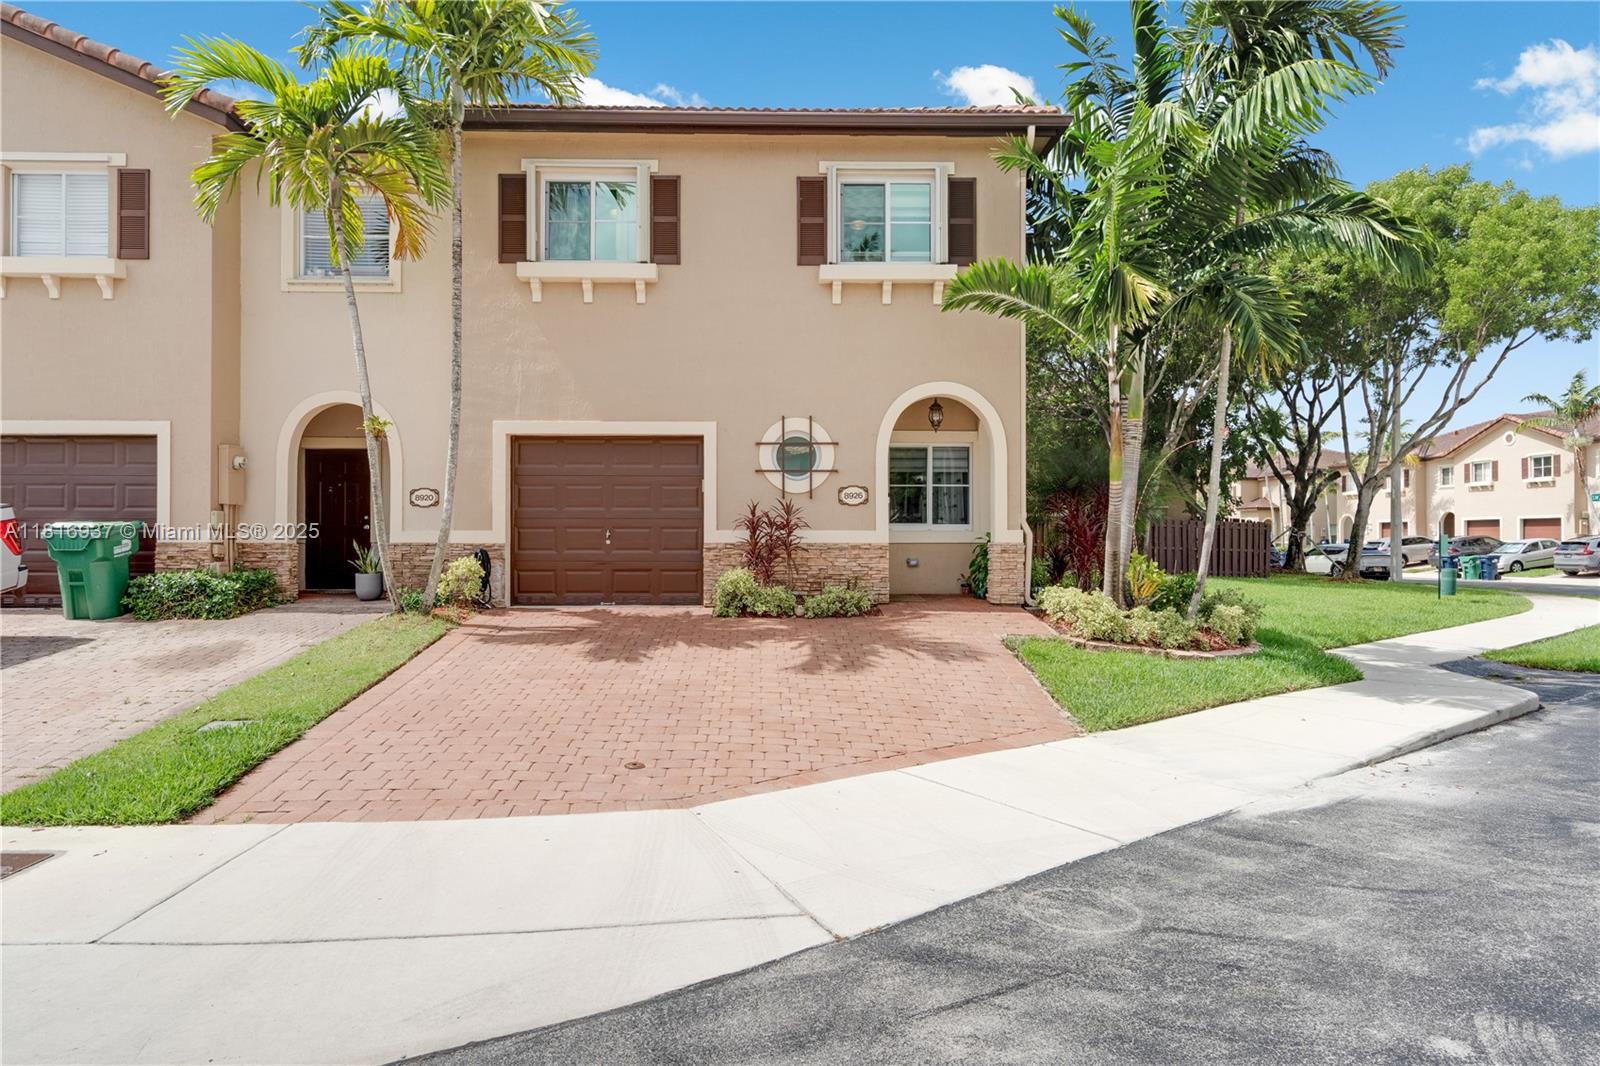
Active
$535,000
3
bds
|
3
ba
|
1,812
sqft
|
built
2006
8926 SW 220th St, Cutler Bay, FL 33190
$-1,365
Cash flow
-13.3%
Cash-on-Cash Return
3.2%
Cap rate
0.5%
Rent to Value Ratio
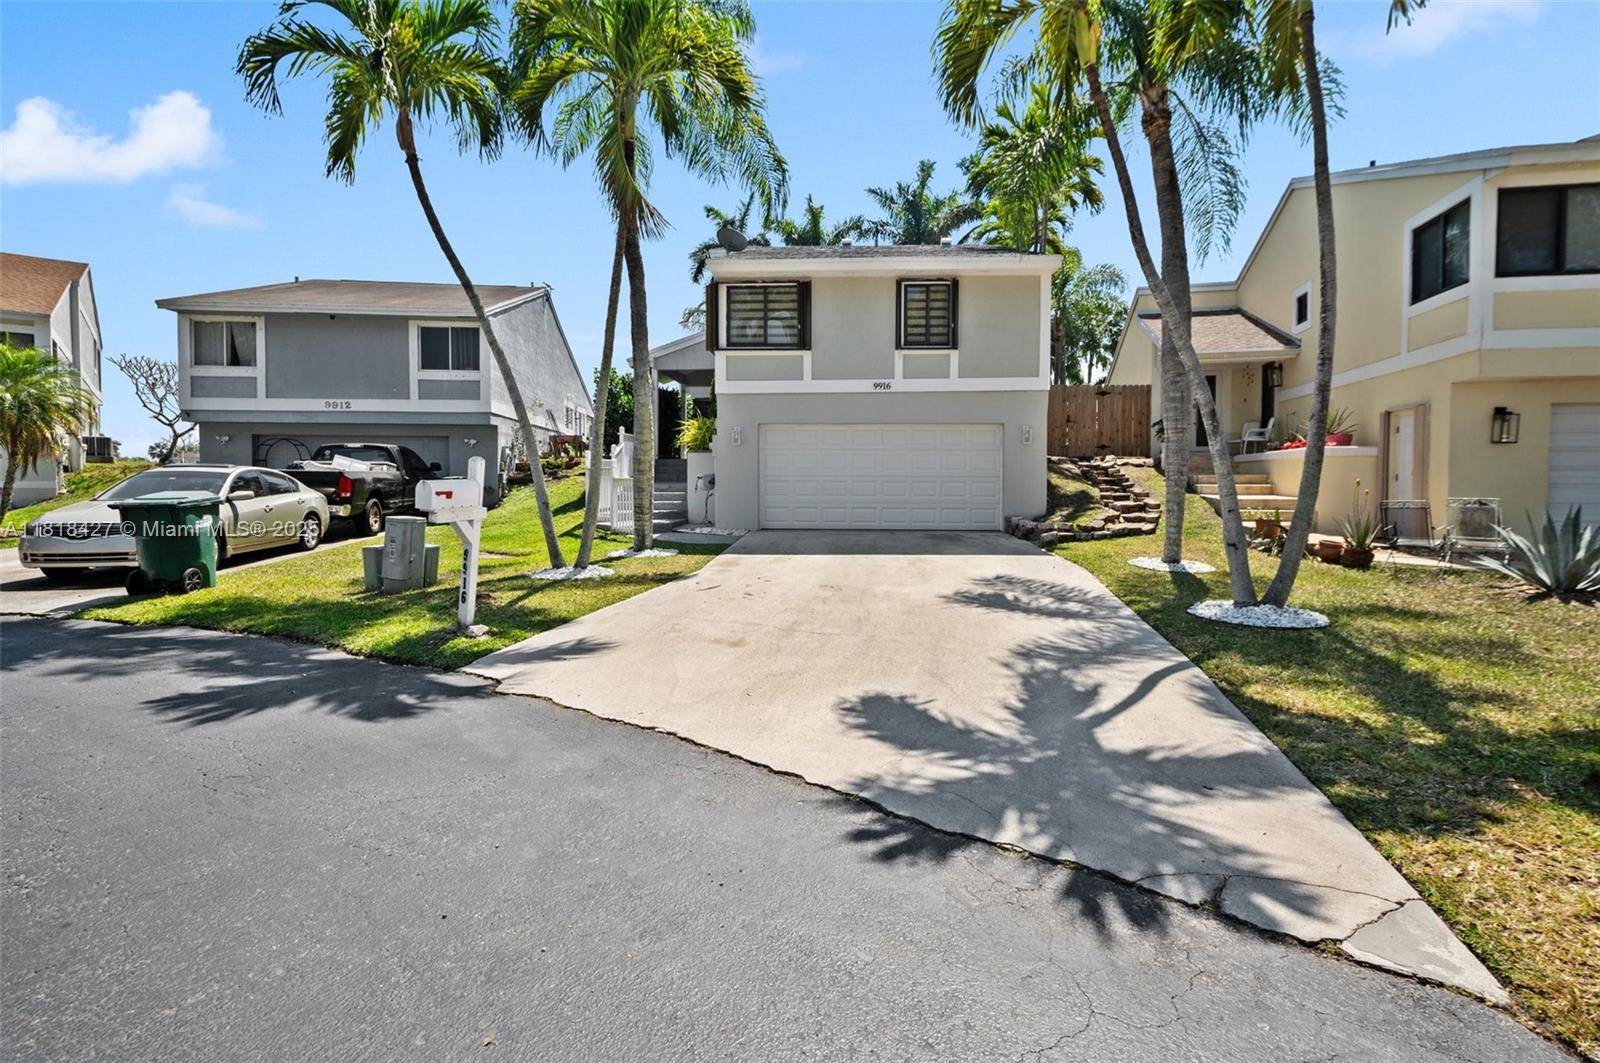
Active
$680,000
4
bds
|
3
ba
|
1,808
sqft
|
built
1985
9916 SW 218th Ter, Cutler Bay, FL 33190
$-2,118
Cash flow
-16.3%
Cash-on-Cash Return
2.5%
Cap rate
0.5%
Rent to Value Ratio
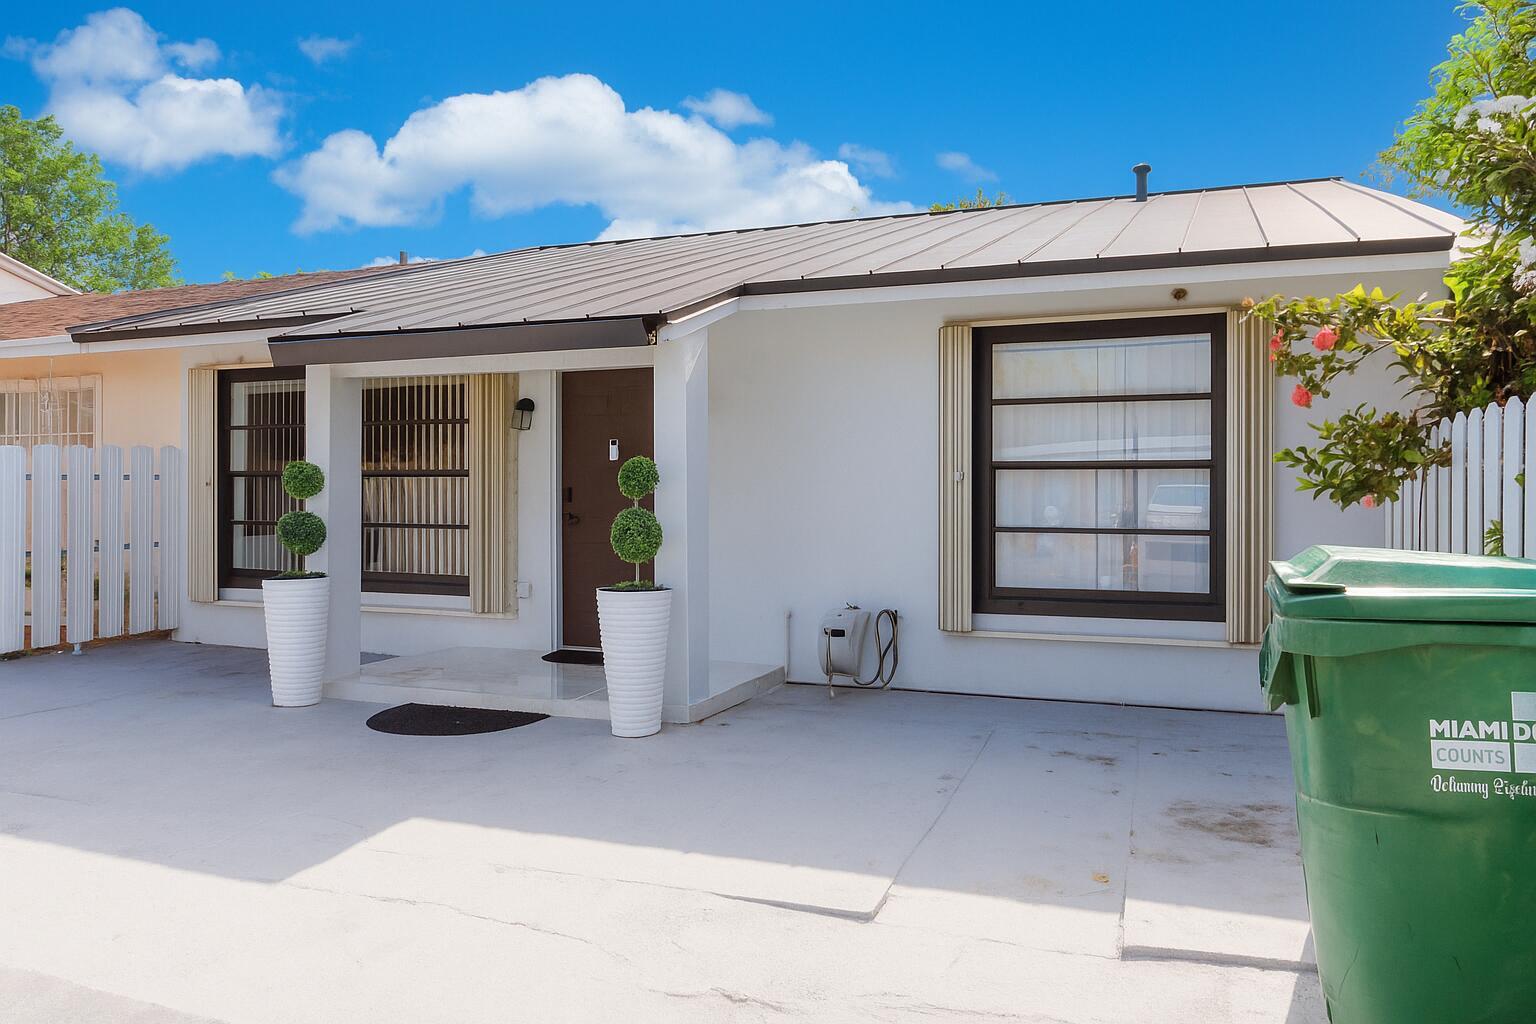
Active under contract
$419,900
3
bds
|
2
ba
|
1,160
sqft
|
built
1981
4416 NW 185th St, Miami Gardens, FL 33055
$-926
Cash flow
-11.5%
Cash-on-Cash Return
3.6%
Cap rate
0.7%
Rent to Value Ratio
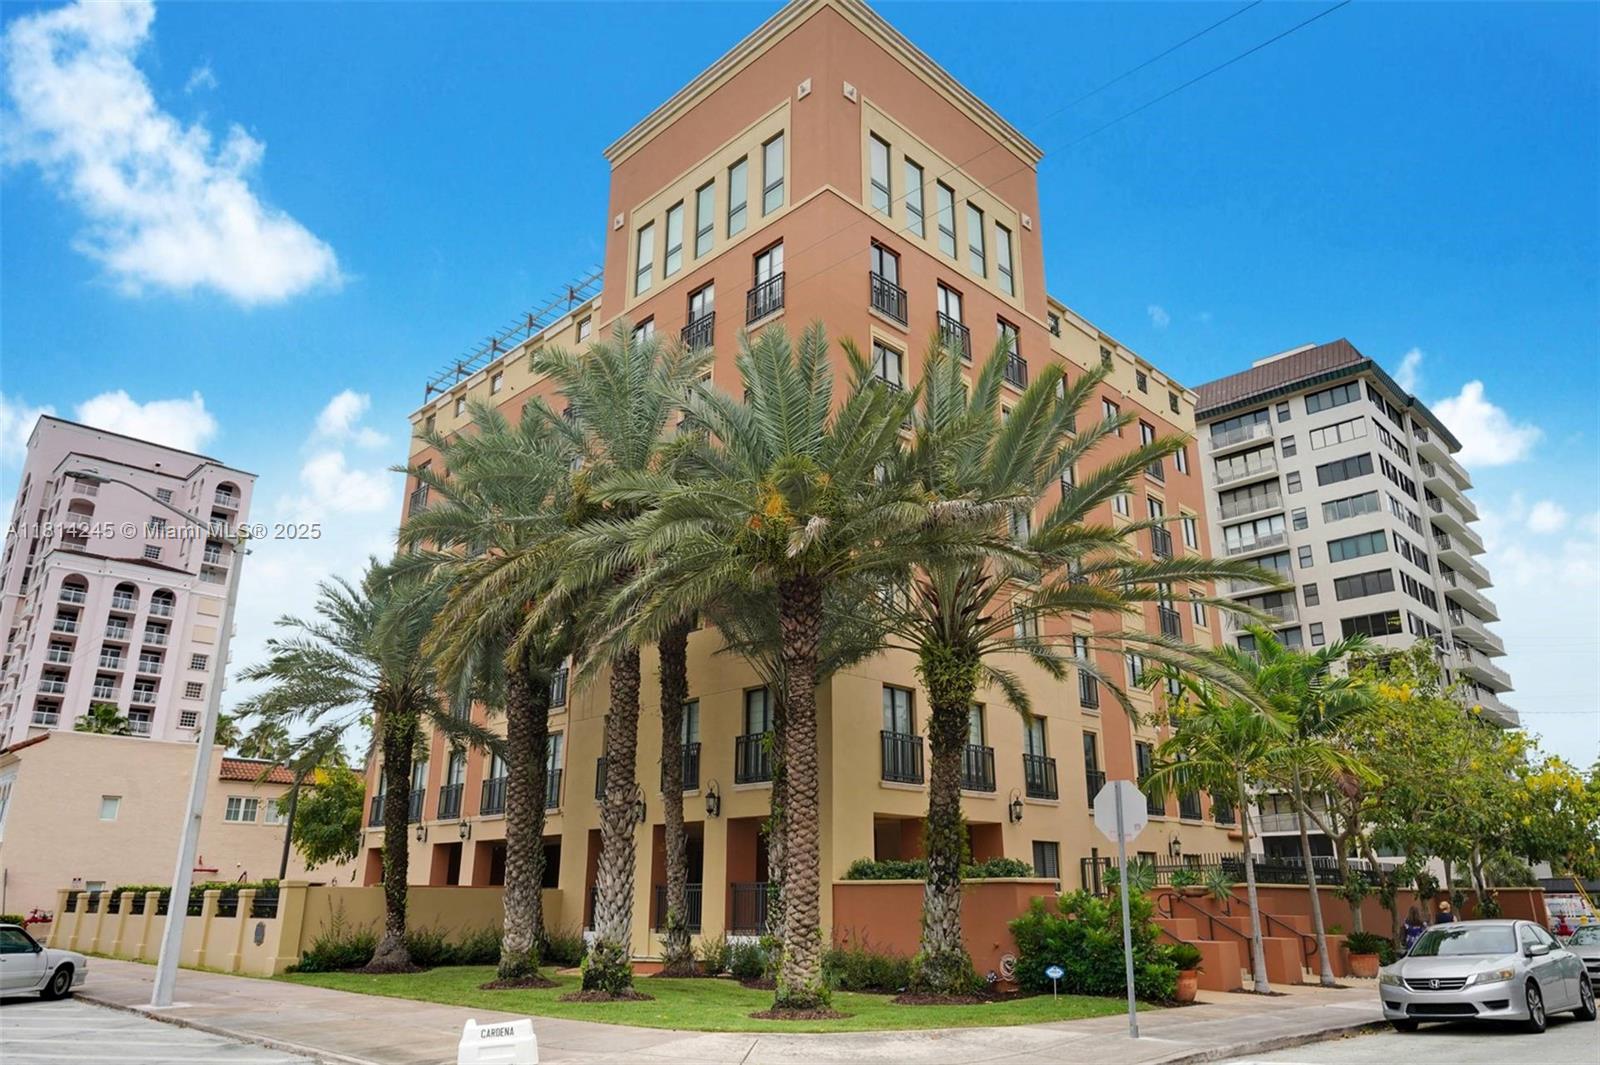
Active
$312,500
1
bds
|
2
ba
|
760
sqft
|
built
2005
2400 SW 27th Ave, Miami, FL 33145
$-846
Cash flow
-14.1%
Cash-on-Cash Return
3.0%
Cap rate
0.8%
Rent to Value Ratio
Active
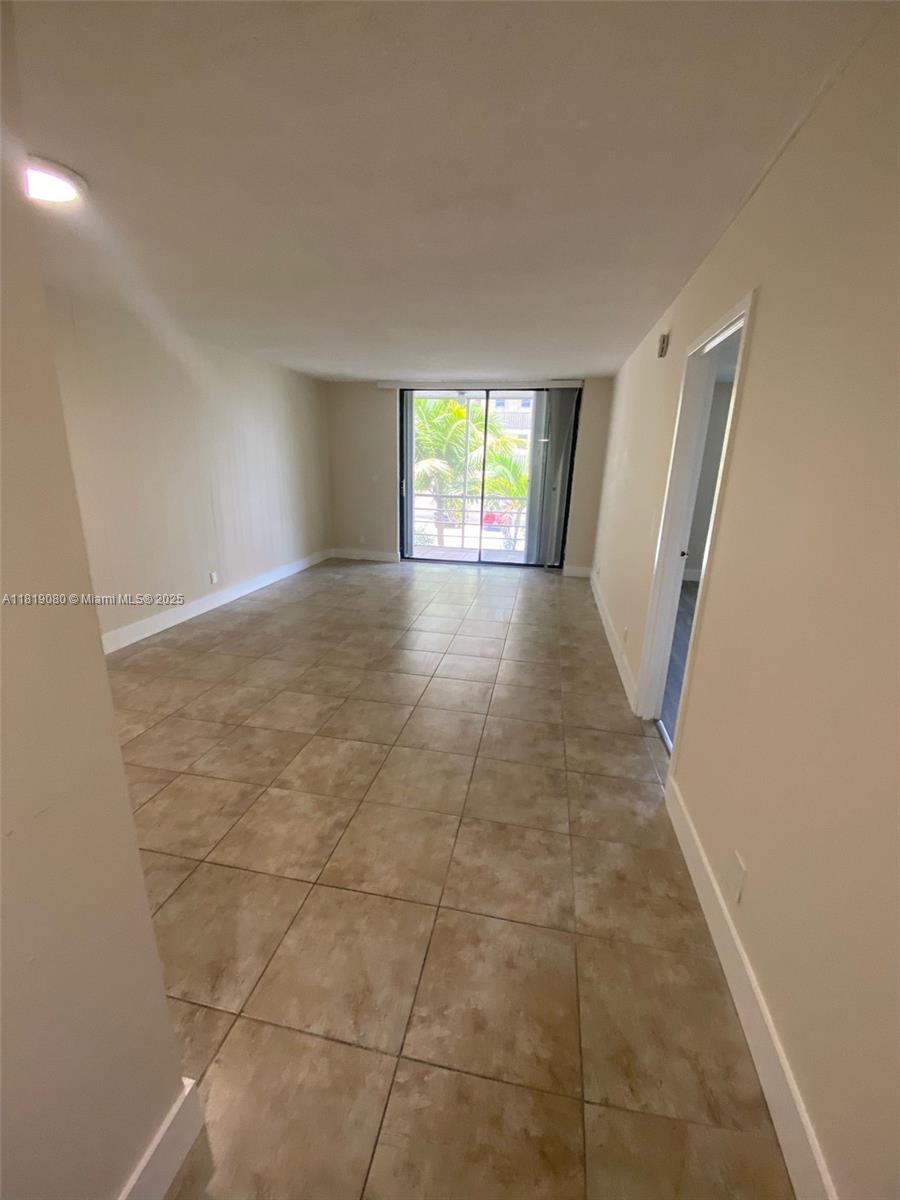
$243,000
2
bds
|
1
ba
|
870
sqft
|
built
1988
18785 NW 62nd Ave, Hialeah, FL 33015
$-234
Cash flow
-5.0%
Cash-on-Cash Return
5.1%
Cap rate
0.9%
Rent to Value Ratio
Active
$1,300,000
3
bds
|
2
ba
|
1,715
sqft
|
built
1981
141 Crandon Blvd, Key Biscayne, FL 33149
$-2,871
Cash flow
-11.5%
Cash-on-Cash Return
3.6%
Cap rate
0.5%
Rent to Value Ratio
Active
$280,000
2
bds
|
2
ba
|
900
sqft
|
built
1970
10903 SW 88th St, Miami, FL 33176
$-582
Cash flow
-10.8%
Cash-on-Cash Return
3.8%
Cap rate
0.8%
Rent to Value Ratio
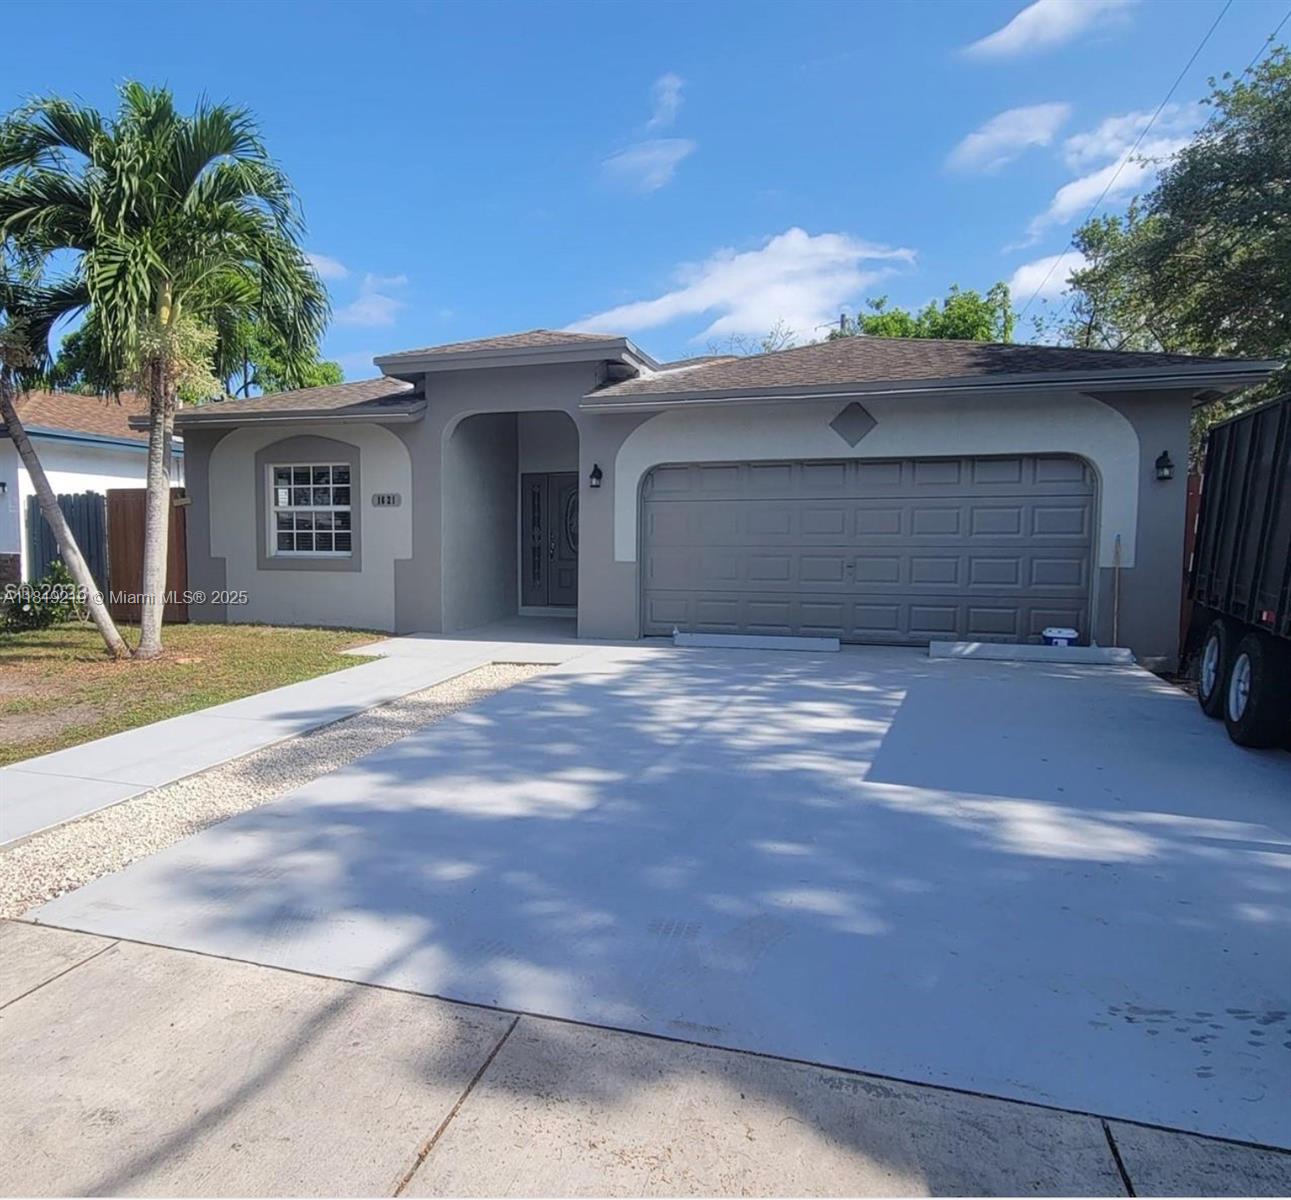
Active
$550,000
3
bds
|
2
ba
|
1,454
sqft
|
built
2007
1621 NW 118th St, Miami, FL 33167
$-1,216
Cash flow
-11.5%
Cash-on-Cash Return
3.6%
Cap rate
0.6%
Rent to Value Ratio
Active
$1,250,000
5
bds
|
3
ba
|
2,569
sqft
|
built
1997
11244 NW 58th Ter, Doral, FL 33178
$-5,174
Cash flow
-21.6%
Cash-on-Cash Return
1.3%
Cap rate
0.3%
Rent to Value Ratio
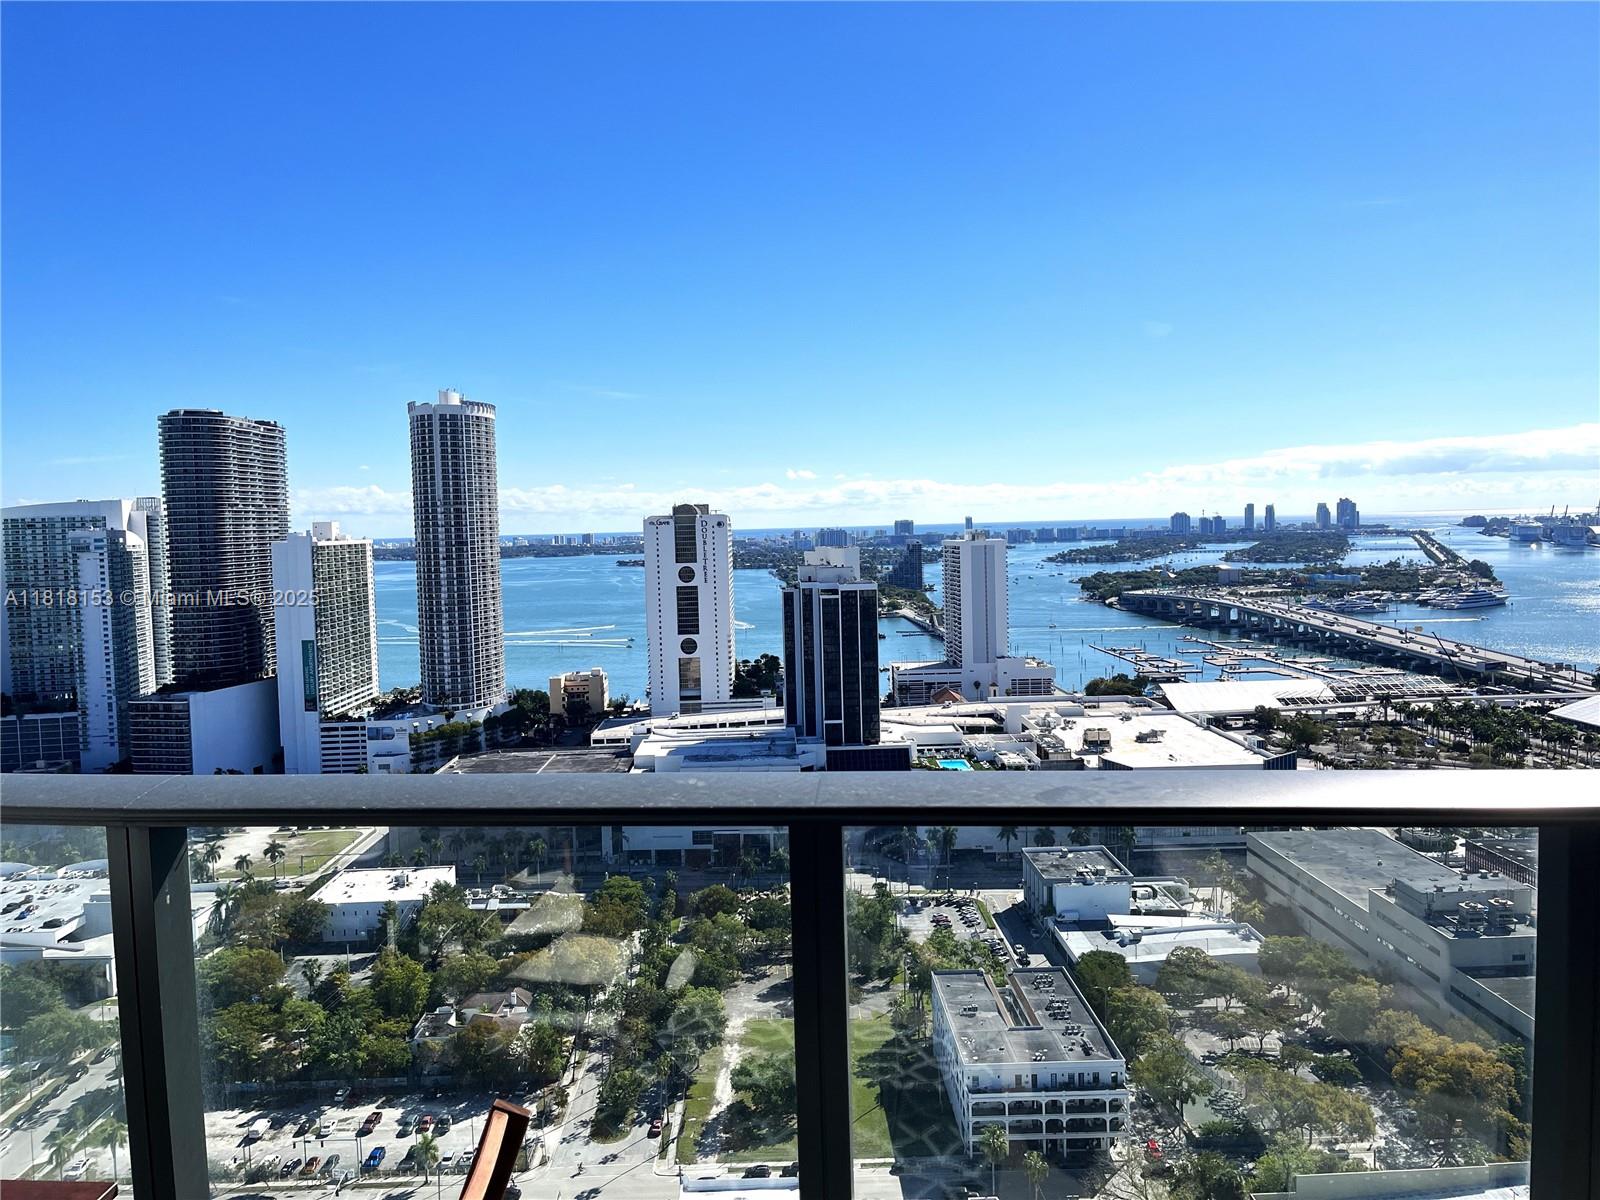
Active
$640,000
1
bds
|
1
ba
|
816
sqft
|
built
2008
475 Brickell Ave, Miami, FL 33131
$-2,292
Cash flow
-18.7%
Cash-on-Cash Return
2.0%
Cap rate
0.6%
Rent to Value Ratio
Active
$295,000
bds
|
1
ba
|
566
sqft
|
built
1966
2899 Collins Ave, Miami Beach, FL 33140
$-911
Cash flow
-16.1%
Cash-on-Cash Return
2.6%
Cap rate
0.7%
Rent to Value Ratio
Active
$220,000
1
bds
|
2
ba
|
772
sqft
|
built
1973
2935 NE 163rd St, North Miami Beach, FL 33160
$-772
Cash flow
-18.3%
Cash-on-Cash Return
2.1%
Cap rate
0.7%
Rent to Value Ratio
Active
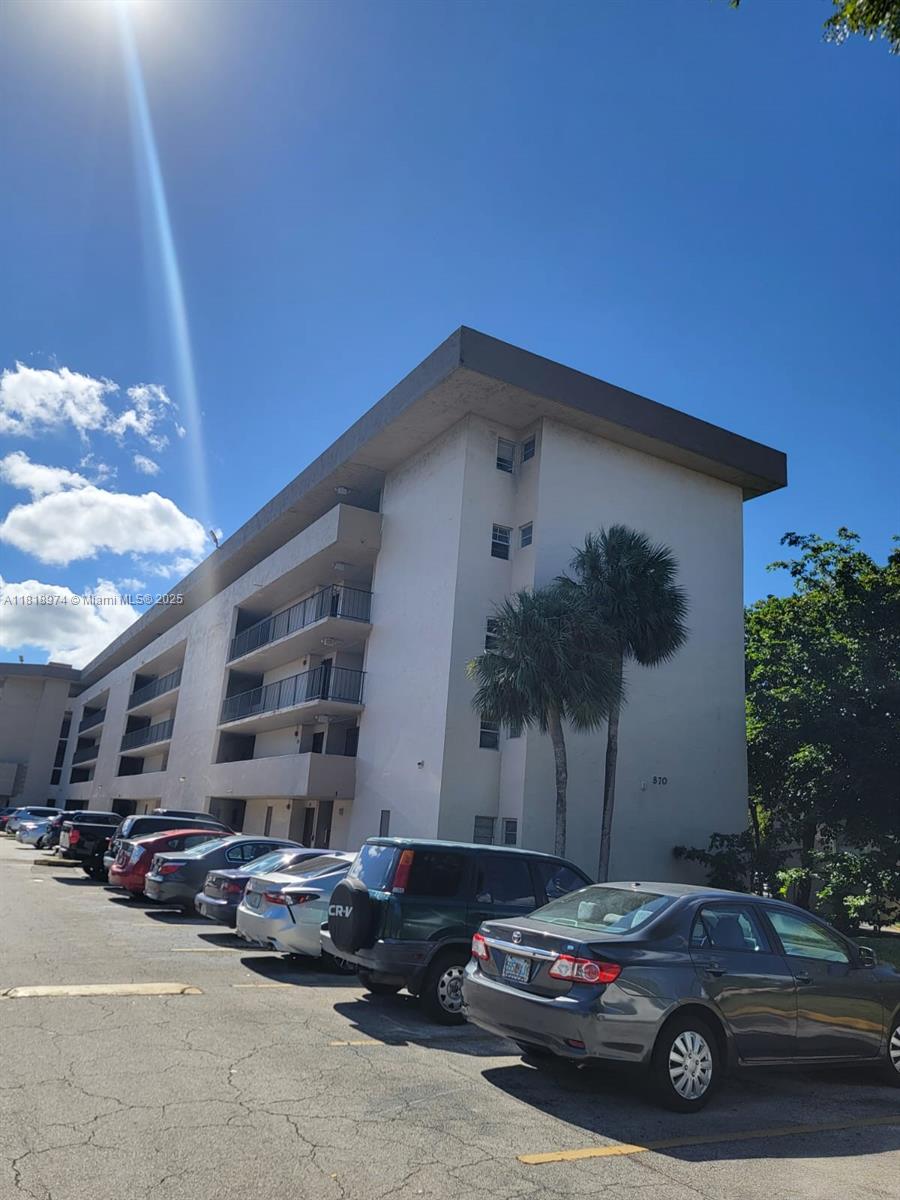
$285,000
2
bds
|
2
ba
|
1,036
sqft
|
built
1972
870 NW 87th Ave, Miami, FL 33172
$-721
Cash flow
-13.2%
Cash-on-Cash Return
3.2%
Cap rate
0.8%
Rent to Value Ratio
Active under contract
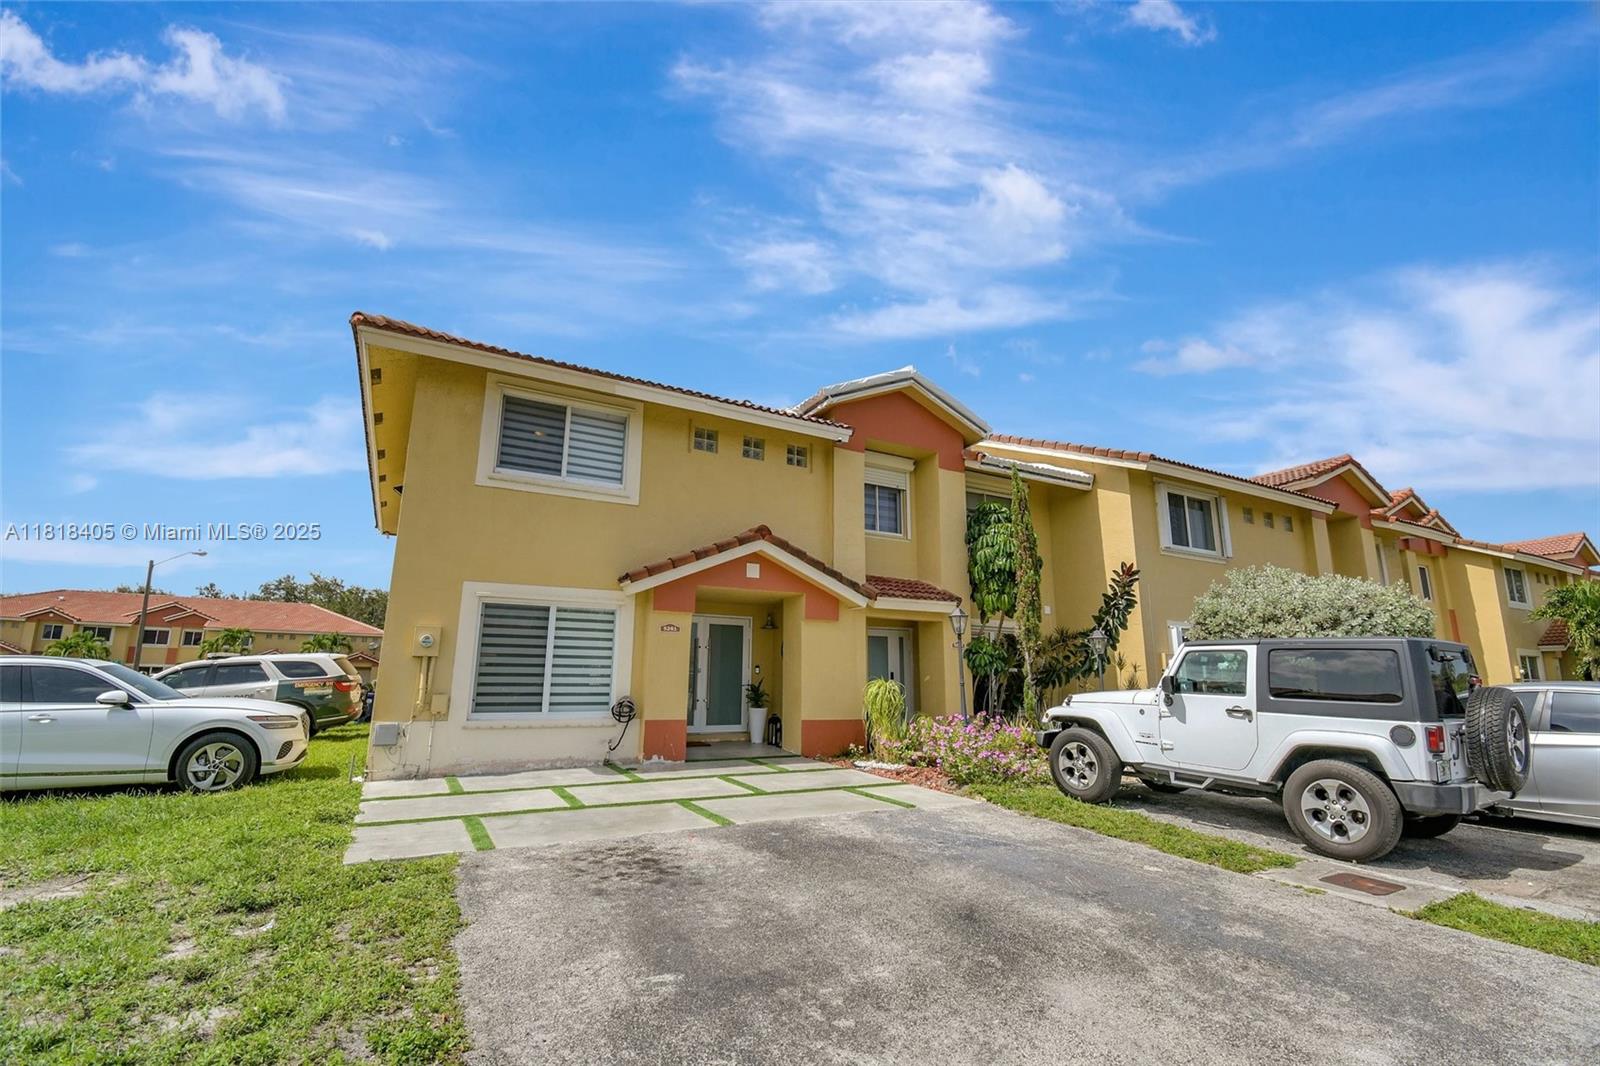
$460,000
3
bds
|
3
ba
|
1,502
sqft
|
built
1994
5261 NW 190th St, Miami Gardens, FL 33055
$-663
Cash flow
-7.5%
Cash-on-Cash Return
4.6%
Cap rate
0.7%
Rent to Value Ratio
Active
$425,000
3
bds
|
2
ba
|
1,518
sqft
|
built
1930
2125 NW 43rd St, Miami, FL 33142
$-392
Cash flow
-4.8%
Cash-on-Cash Return
5.2%
Cap rate
0.7%
Rent to Value Ratio
Active
$450,000
2
bds
|
2
ba
|
1,160
sqft
|
built
1972
6801 Indian Creek Dr, Miami Beach, FL 33141
$-1,529
Cash flow
-17.7%
Cash-on-Cash Return
2.2%
Cap rate
0.6%
Rent to Value Ratio
Active
$550,000
5
bds
|
3
ba
|
2,568
sqft
|
built
2018
150 NE 23rd Ter, Homestead, FL 33033
$-1,288
Cash flow
-12.2%
Cash-on-Cash Return
3.5%
Cap rate
0.7%
Rent to Value Ratio
Active
$575,000
4
bds
|
2
ba
|
1,634
sqft
|
built
2004
27832 SW 130th Ct, Homestead, FL 33032
$-1,321
Cash flow
-12.0%
Cash-on-Cash Return
3.5%
Cap rate
0.6%
Rent to Value Ratio
Active
$789,000
4
bds
|
3
ba
|
3,060
sqft
|
built
1978
11537 SW 34th Ln, Miami, FL 33165
$-1,731
Cash flow
-11.4%
Cash-on-Cash Return
3.7%
Cap rate
0.5%
Rent to Value Ratio
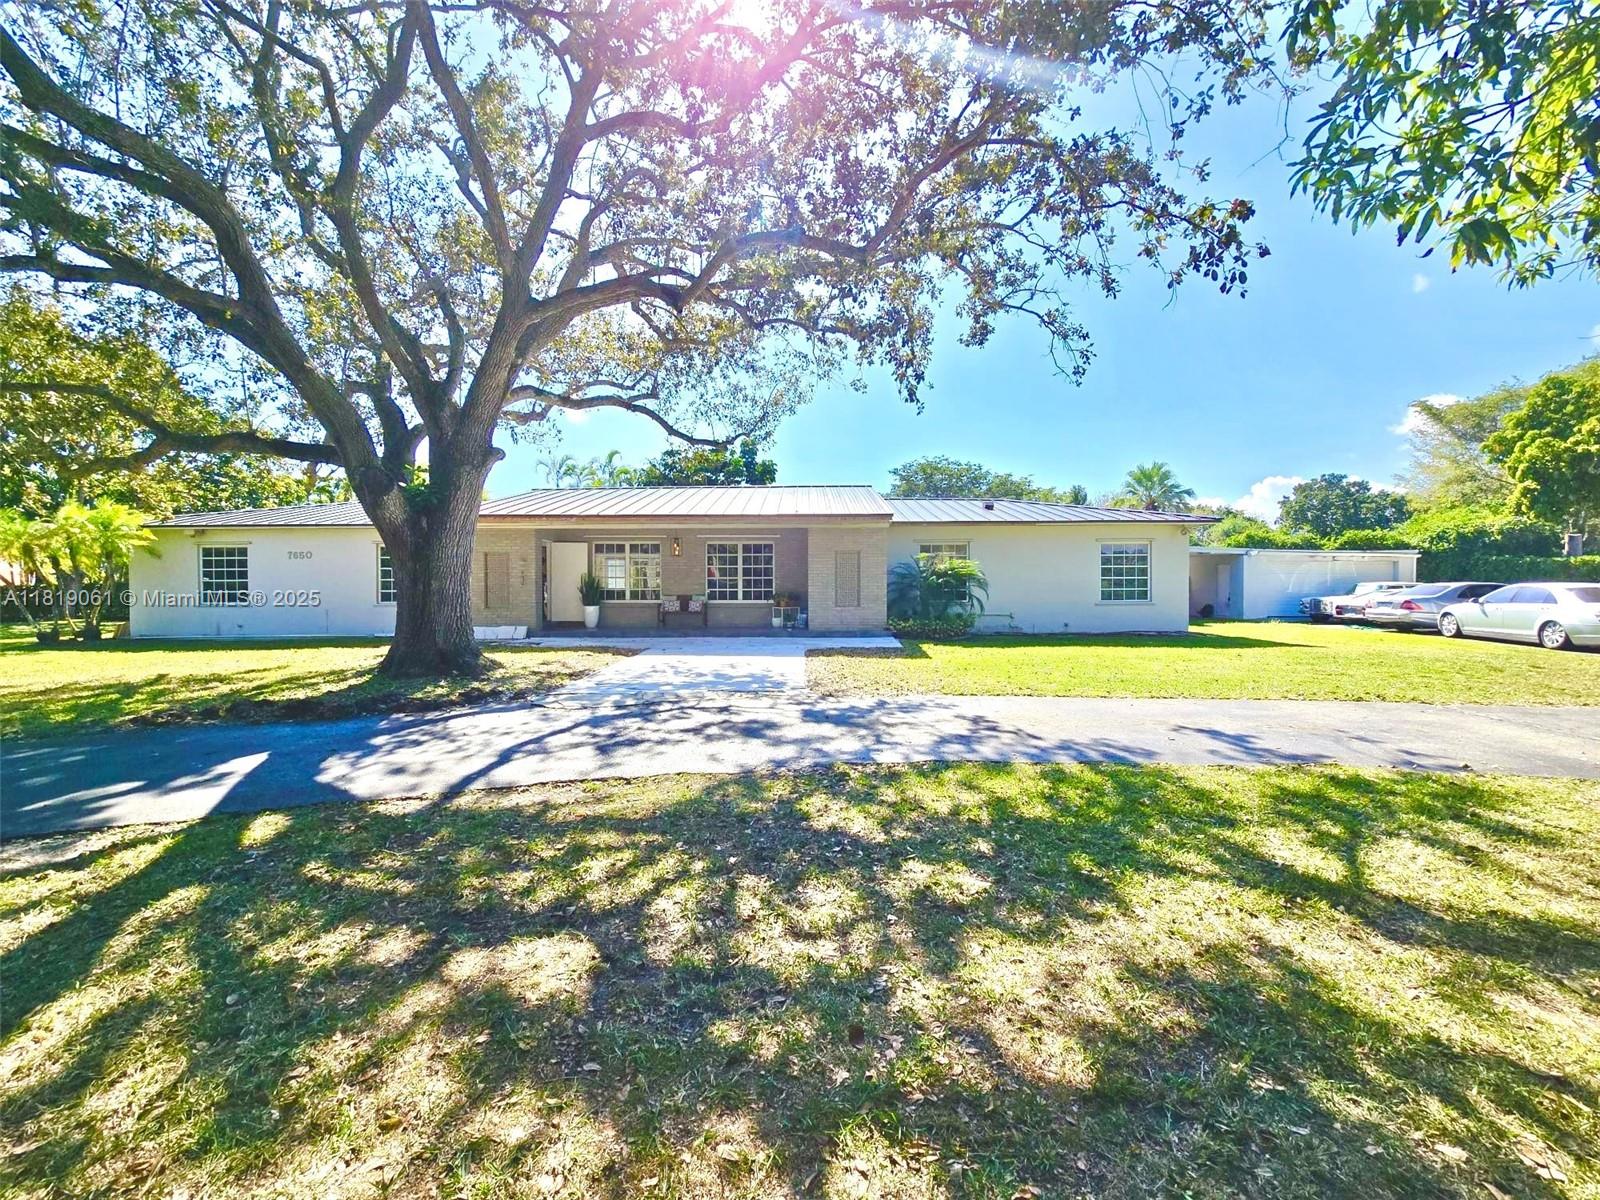
Active
$1,899,000
4
bds
|
3
ba
|
3,368
sqft
|
built
1958
7650 SW 78th Ct, Miami, FL 33143
$-3,906
Cash flow
-10.7%
Cash-on-Cash Return
3.8%
Cap rate
0.5%
Rent to Value Ratio
Pending
$615,000
3
bds
|
2
ba
|
1,905
sqft
|
built
1959
19731 Belview Dr, Cutler Bay, FL 33157
$-1,219
Cash flow
-10.3%
Cash-on-Cash Return
3.9%
Cap rate
0.5%
Rent to Value Ratio
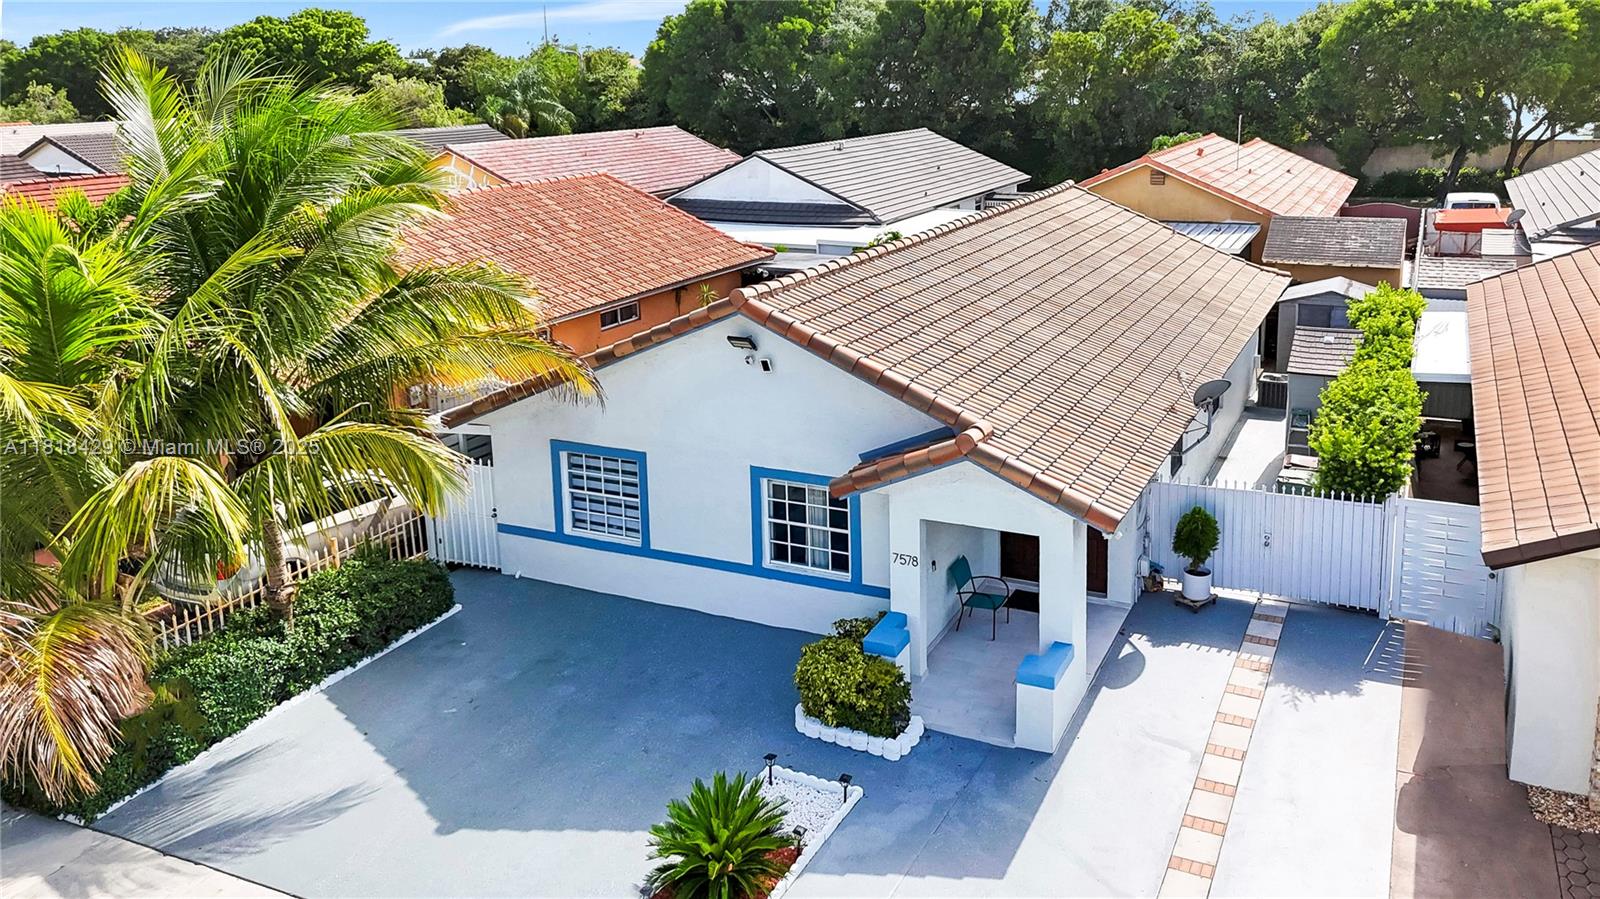
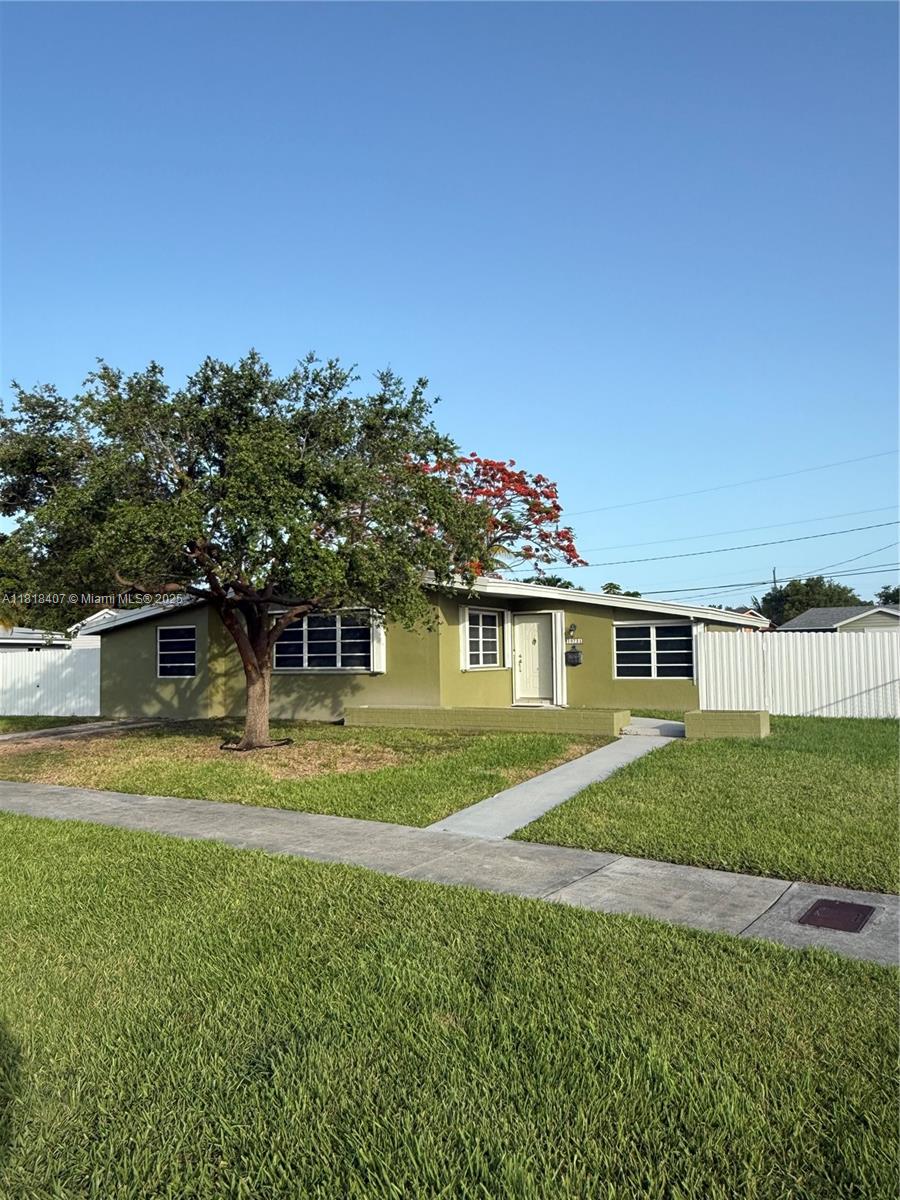
Active
$599,000
3
bds
|
2
ba
|
1,400
sqft
|
built
1990
7578 W 30th Ln, Hialeah, FL 33018
$-1,090
Cash flow
-9.5%
Cash-on-Cash Return
4.1%
Cap rate
0.5%
Rent to Value Ratio
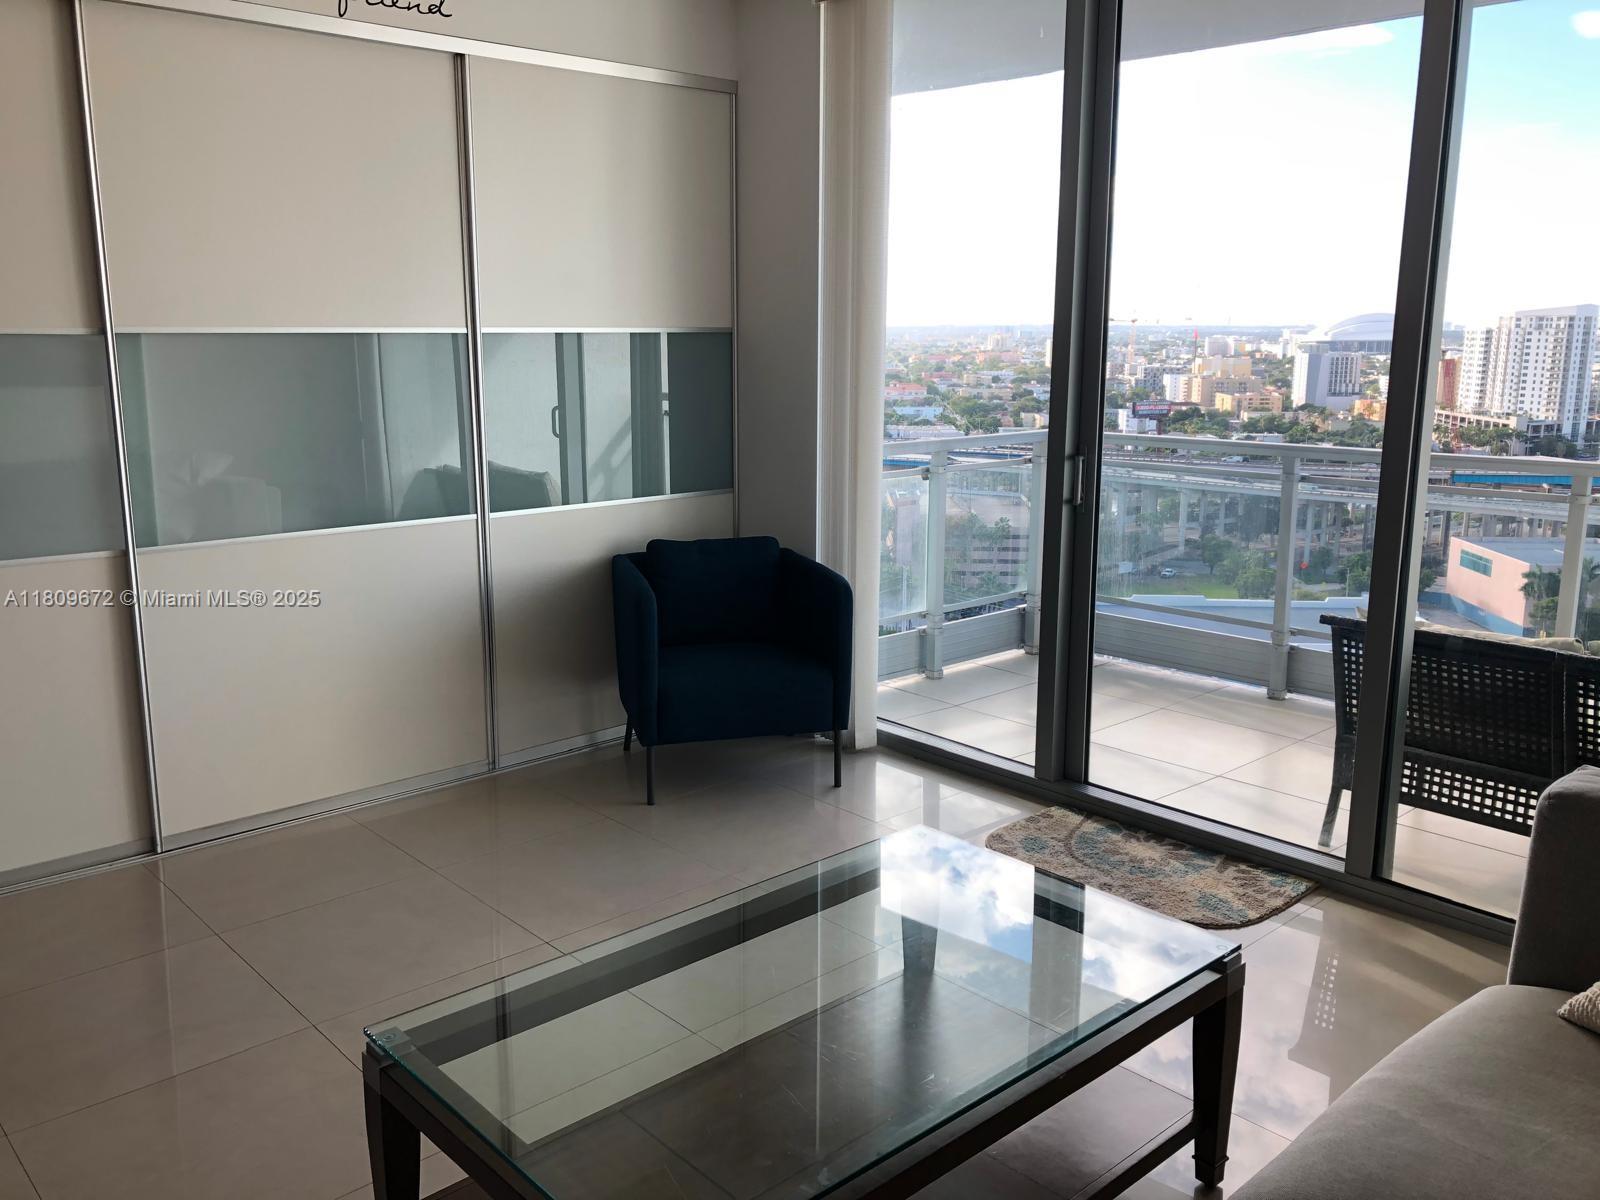
Active
$420,000
1
bds
|
1
ba
|
747
sqft
|
built
2008
90 SW 3rd St, Miami, FL 33130
$-1,571
Cash flow
-19.5%
Cash-on-Cash Return
1.8%
Cap rate
0.7%
Rent to Value Ratio
Active
$585,000
3
bds
|
3
ba
|
1,349
sqft
|
built
1979
4700 SW 67th Ave, Miami, FL 33155
$-1,935
Cash flow
-17.3%
Cash-on-Cash Return
2.3%
Cap rate
0.5%
Rent to Value Ratio
Active
$899,000
2
bds
|
2
ba
|
1,300
sqft
|
built
2004
711 Biltmore Way, Coral Gables, FL 33134
$-3,545
Cash flow
-20.6%
Cash-on-Cash Return
1.6%
Cap rate
0.5%
Rent to Value Ratio
Active
$385,000
0
bds
|
1
ba
|
580
sqft
|
built
2018
1600 NE 1st Ave, Miami, FL 33132
$-571
Cash flow
-7.7%
Cash-on-Cash Return
4.5%
Cap rate
0.8%
Rent to Value Ratio
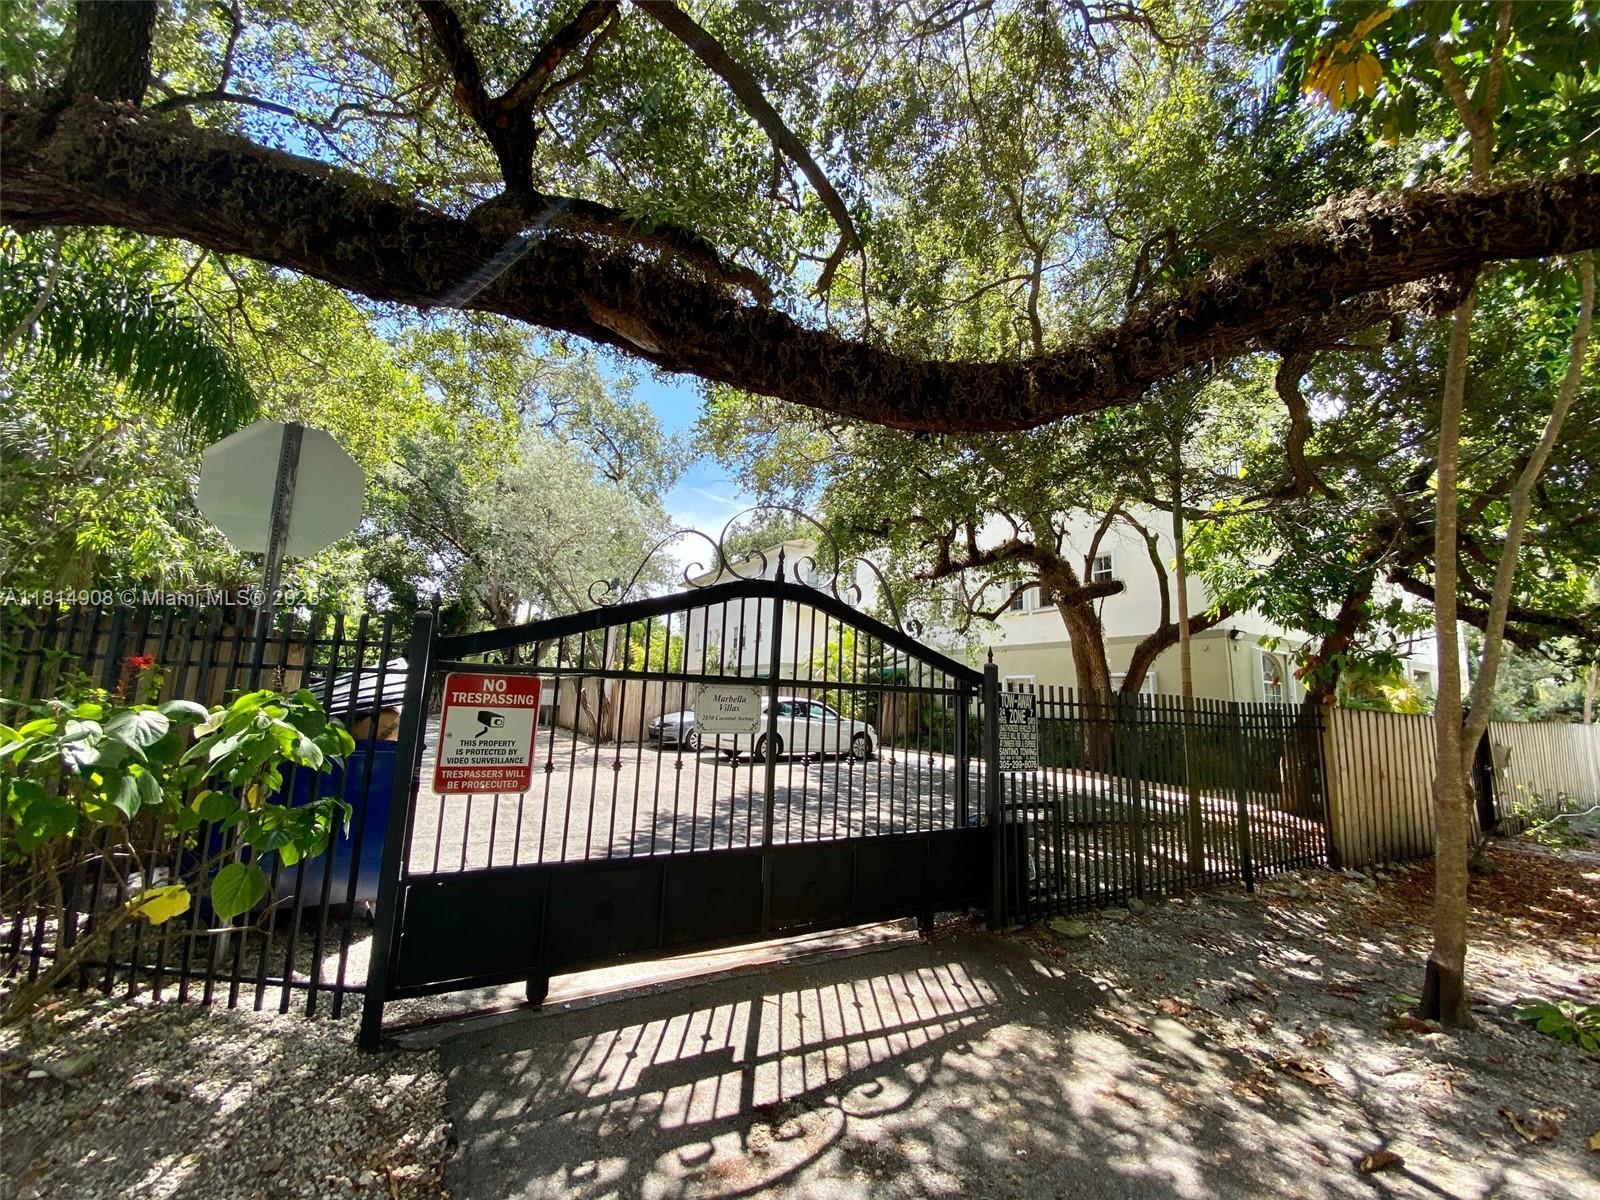
Active
$393,955
1
bds
|
1
ba
|
580
sqft
|
built
1998
2850 Coconut Ave, Miami, FL 33133
$-1,204
Cash flow
-15.9%
Cash-on-Cash Return
2.6%
Cap rate
0.6%
Rent to Value Ratio
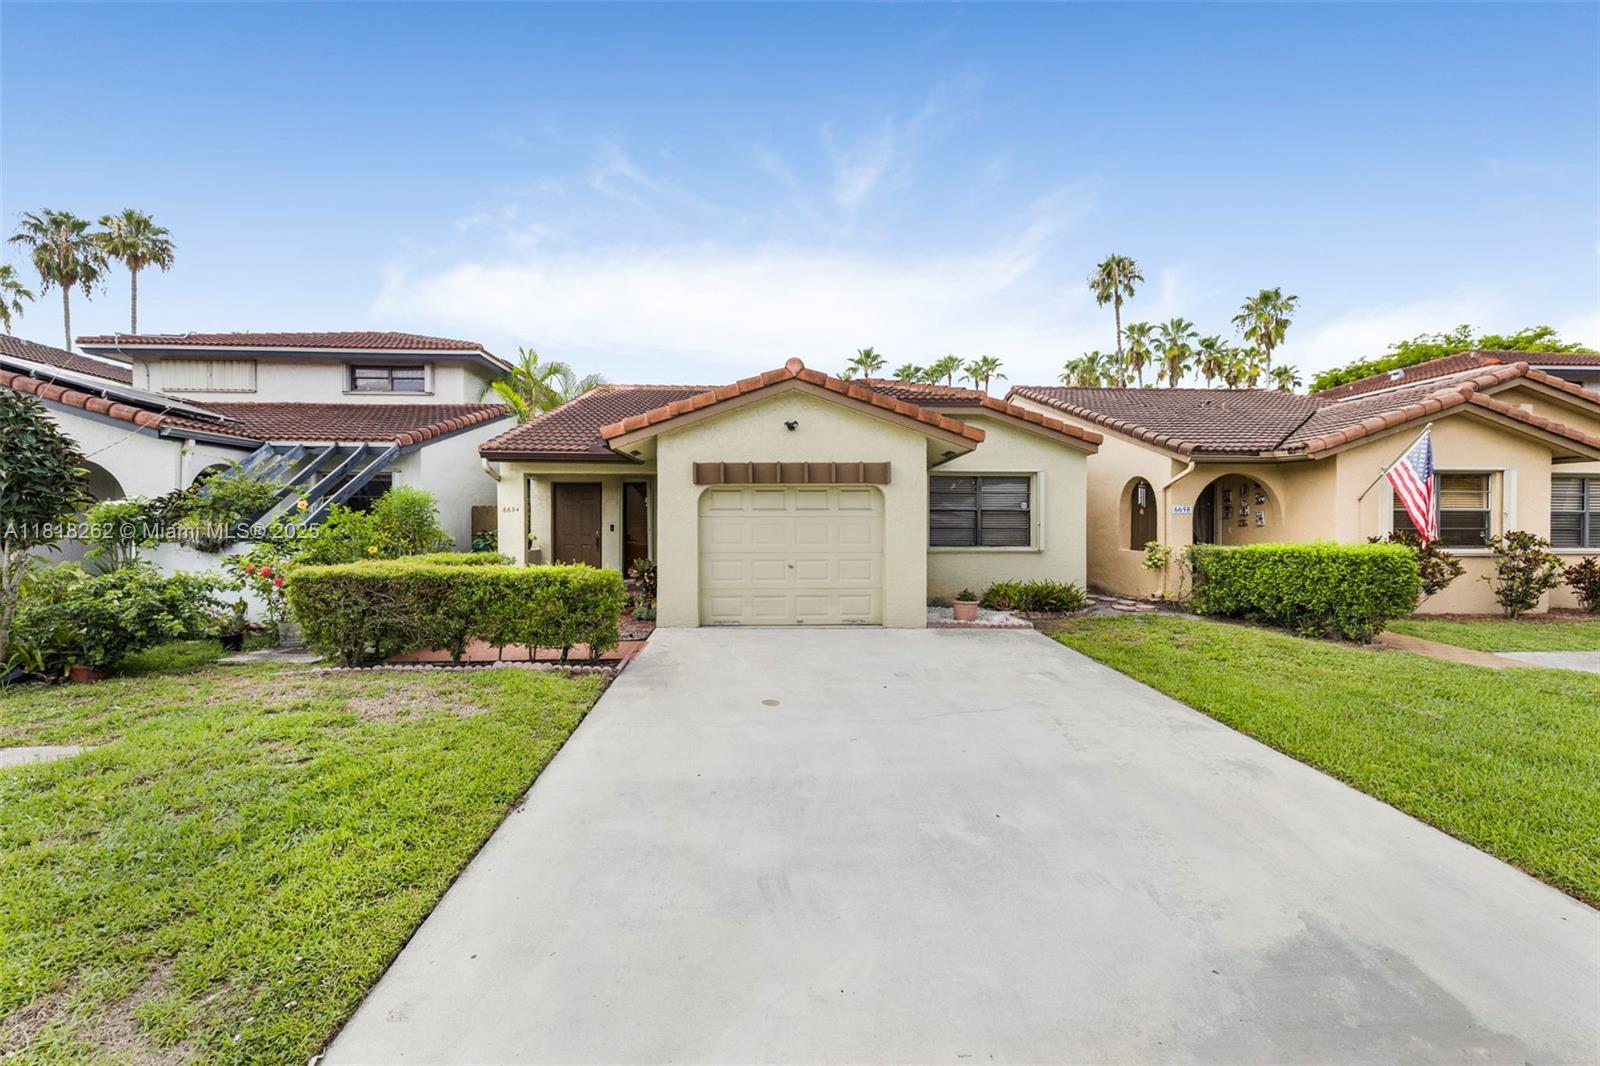
Active
$515,000
3
bds
|
2
ba
|
1,612
sqft
|
built
1989
6654 NW 173rd Ln, Hialeah, FL 33015
$-976
Cash flow
-9.9%
Cash-on-Cash Return
4.0%
Cap rate
0.6%
Rent to Value Ratio
Pending
$199,000
1
bds
|
1
ba
|
679
sqft
|
built
1987
7100 NW 179th St, Hialeah, FL 33015
$-440
Cash flow
-11.5%
Cash-on-Cash Return
3.6%
Cap rate
0.9%
Rent to Value Ratio