Miami Dade County Investment Properties for Sale
Browse homes for sale and investment properties in Miami Dade County. Refine your search by price, property type, or more.
Best cash flowing properties in Miami Dade County
Active
$295,000
3
bds
|
2
ba
|
1,255
sqft
|
built
1991
6115 NW 186th St, Hialeah, FL 33015
$-96
Cash flow
-1.7%
Cash-on-Cash Return
5.8%
Cap rate
0.9%
Rent to Value Ratio
Active
$325,000
2
bds
|
2
ba
|
1,044
sqft
|
built
1986
1782 W 42nd St, Hialeah, FL 33012
$-255
Cash flow
-4.1%
Cash-on-Cash Return
5.2%
Cap rate
0.8%
Rent to Value Ratio
10,000 out of 16,844 properties for sale in Miami Dade County
Limited Results Shown
Create a free account, or log in to reveal all property listings and enjoy the complete experience.
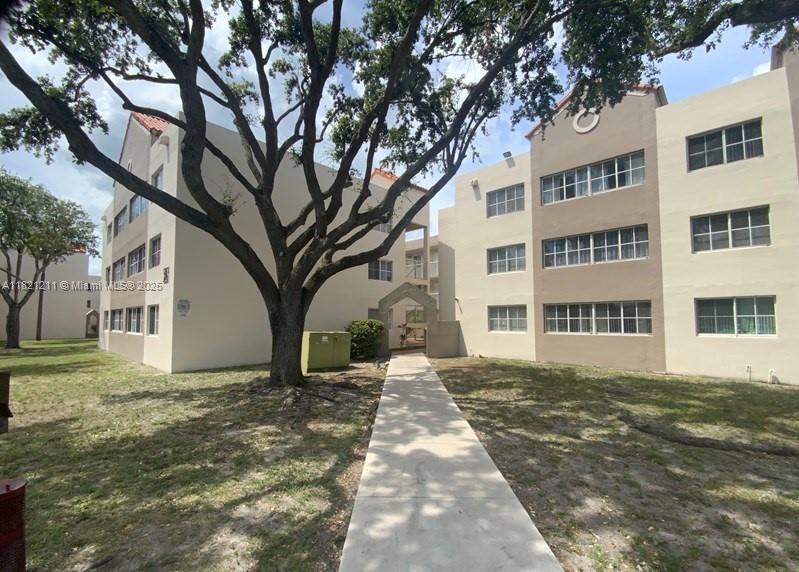
Active
$543,000
3
bds
|
2
ba
|
2,105
sqft
|
built
2004
2965 NE 42nd Ave, Homestead, FL 33033
$-1,495
Cash flow
-14.4%
Cash-on-Cash Return
2.8%
Cap rate
0.6%
Rent to Value Ratio
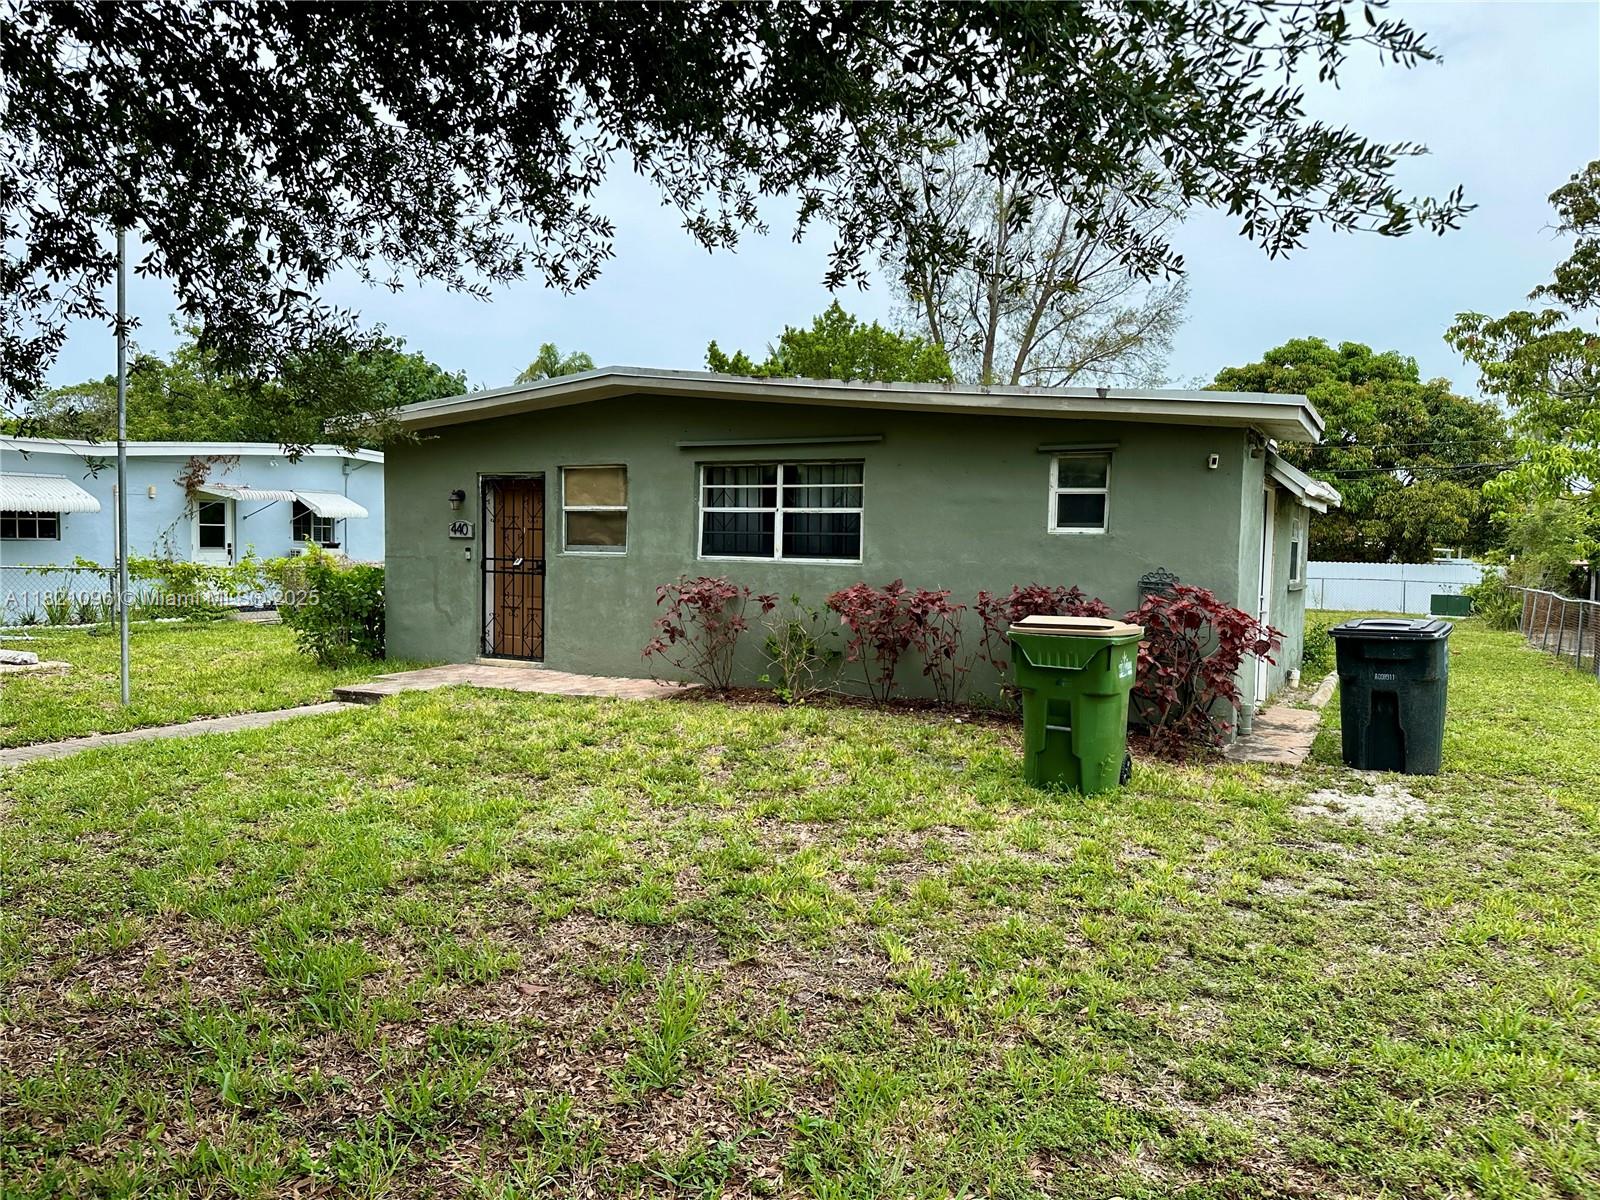
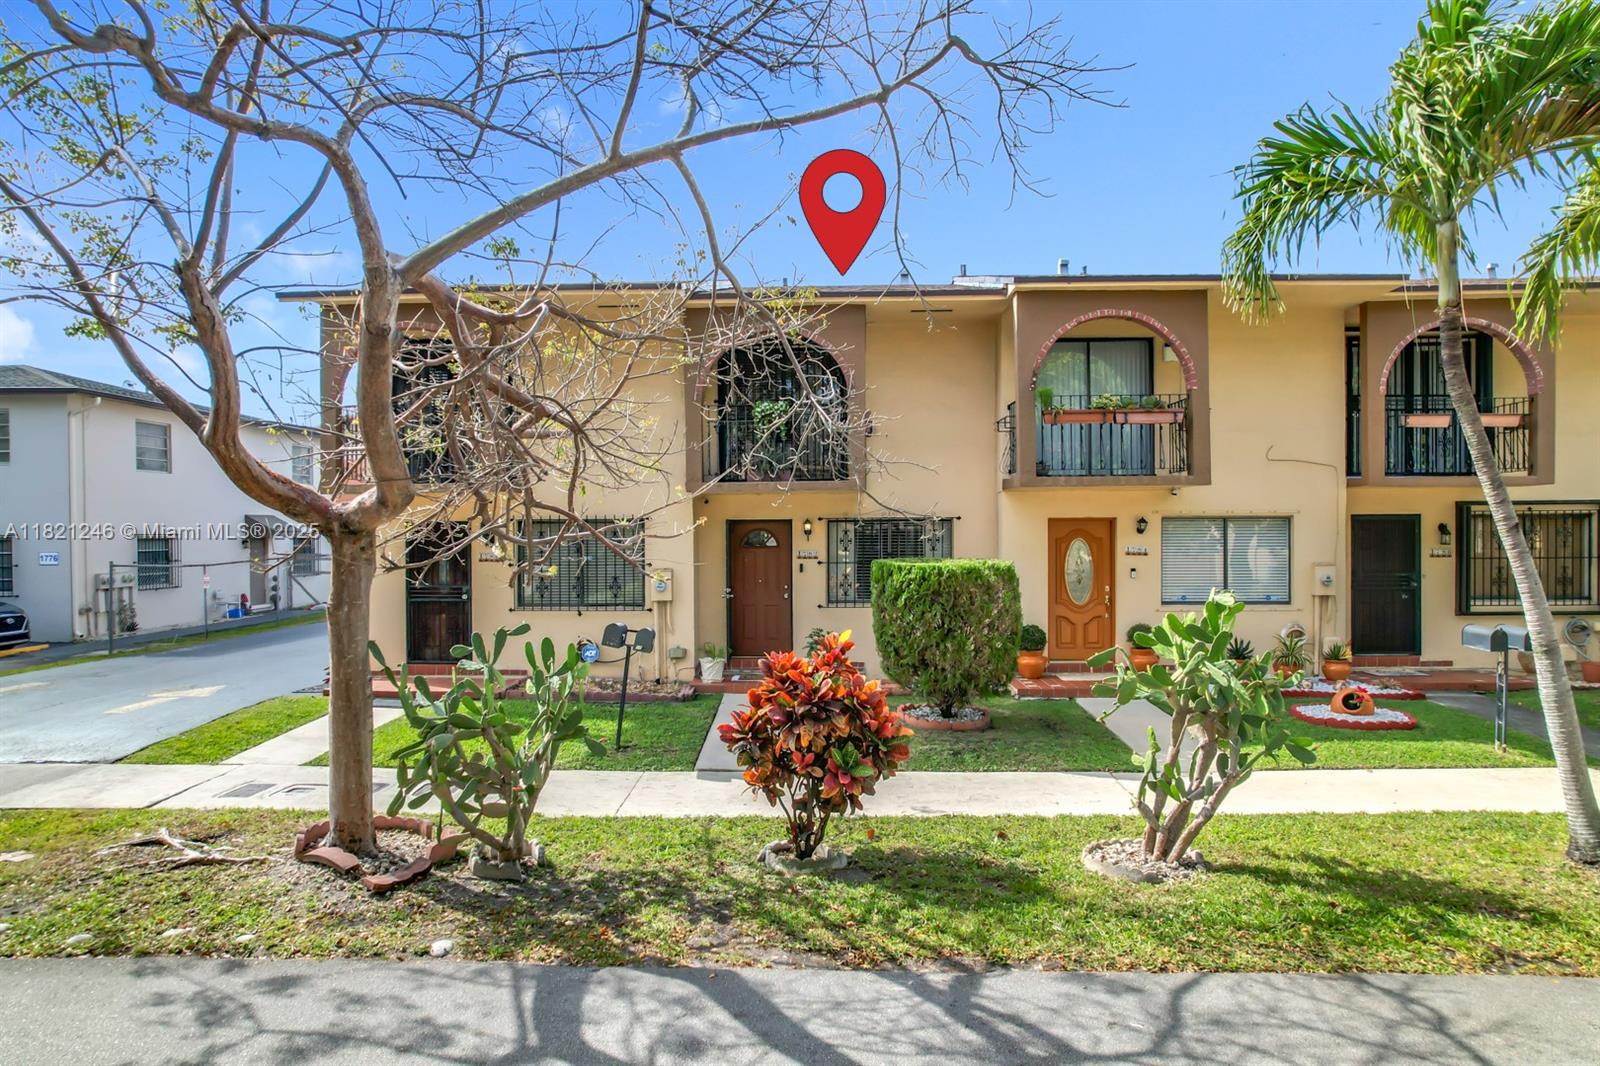
Active
$385,000
2
bds
|
1
ba
|
890
sqft
|
built
1950
440 NW 134th St, North Miami, FL 33168
$-844
Cash flow
-11.4%
Cash-on-Cash Return
3.5%
Cap rate
0.6%
Rent to Value Ratio
Active
$400,000
3
bds
|
2
ba
|
2,195
sqft
|
built
1978
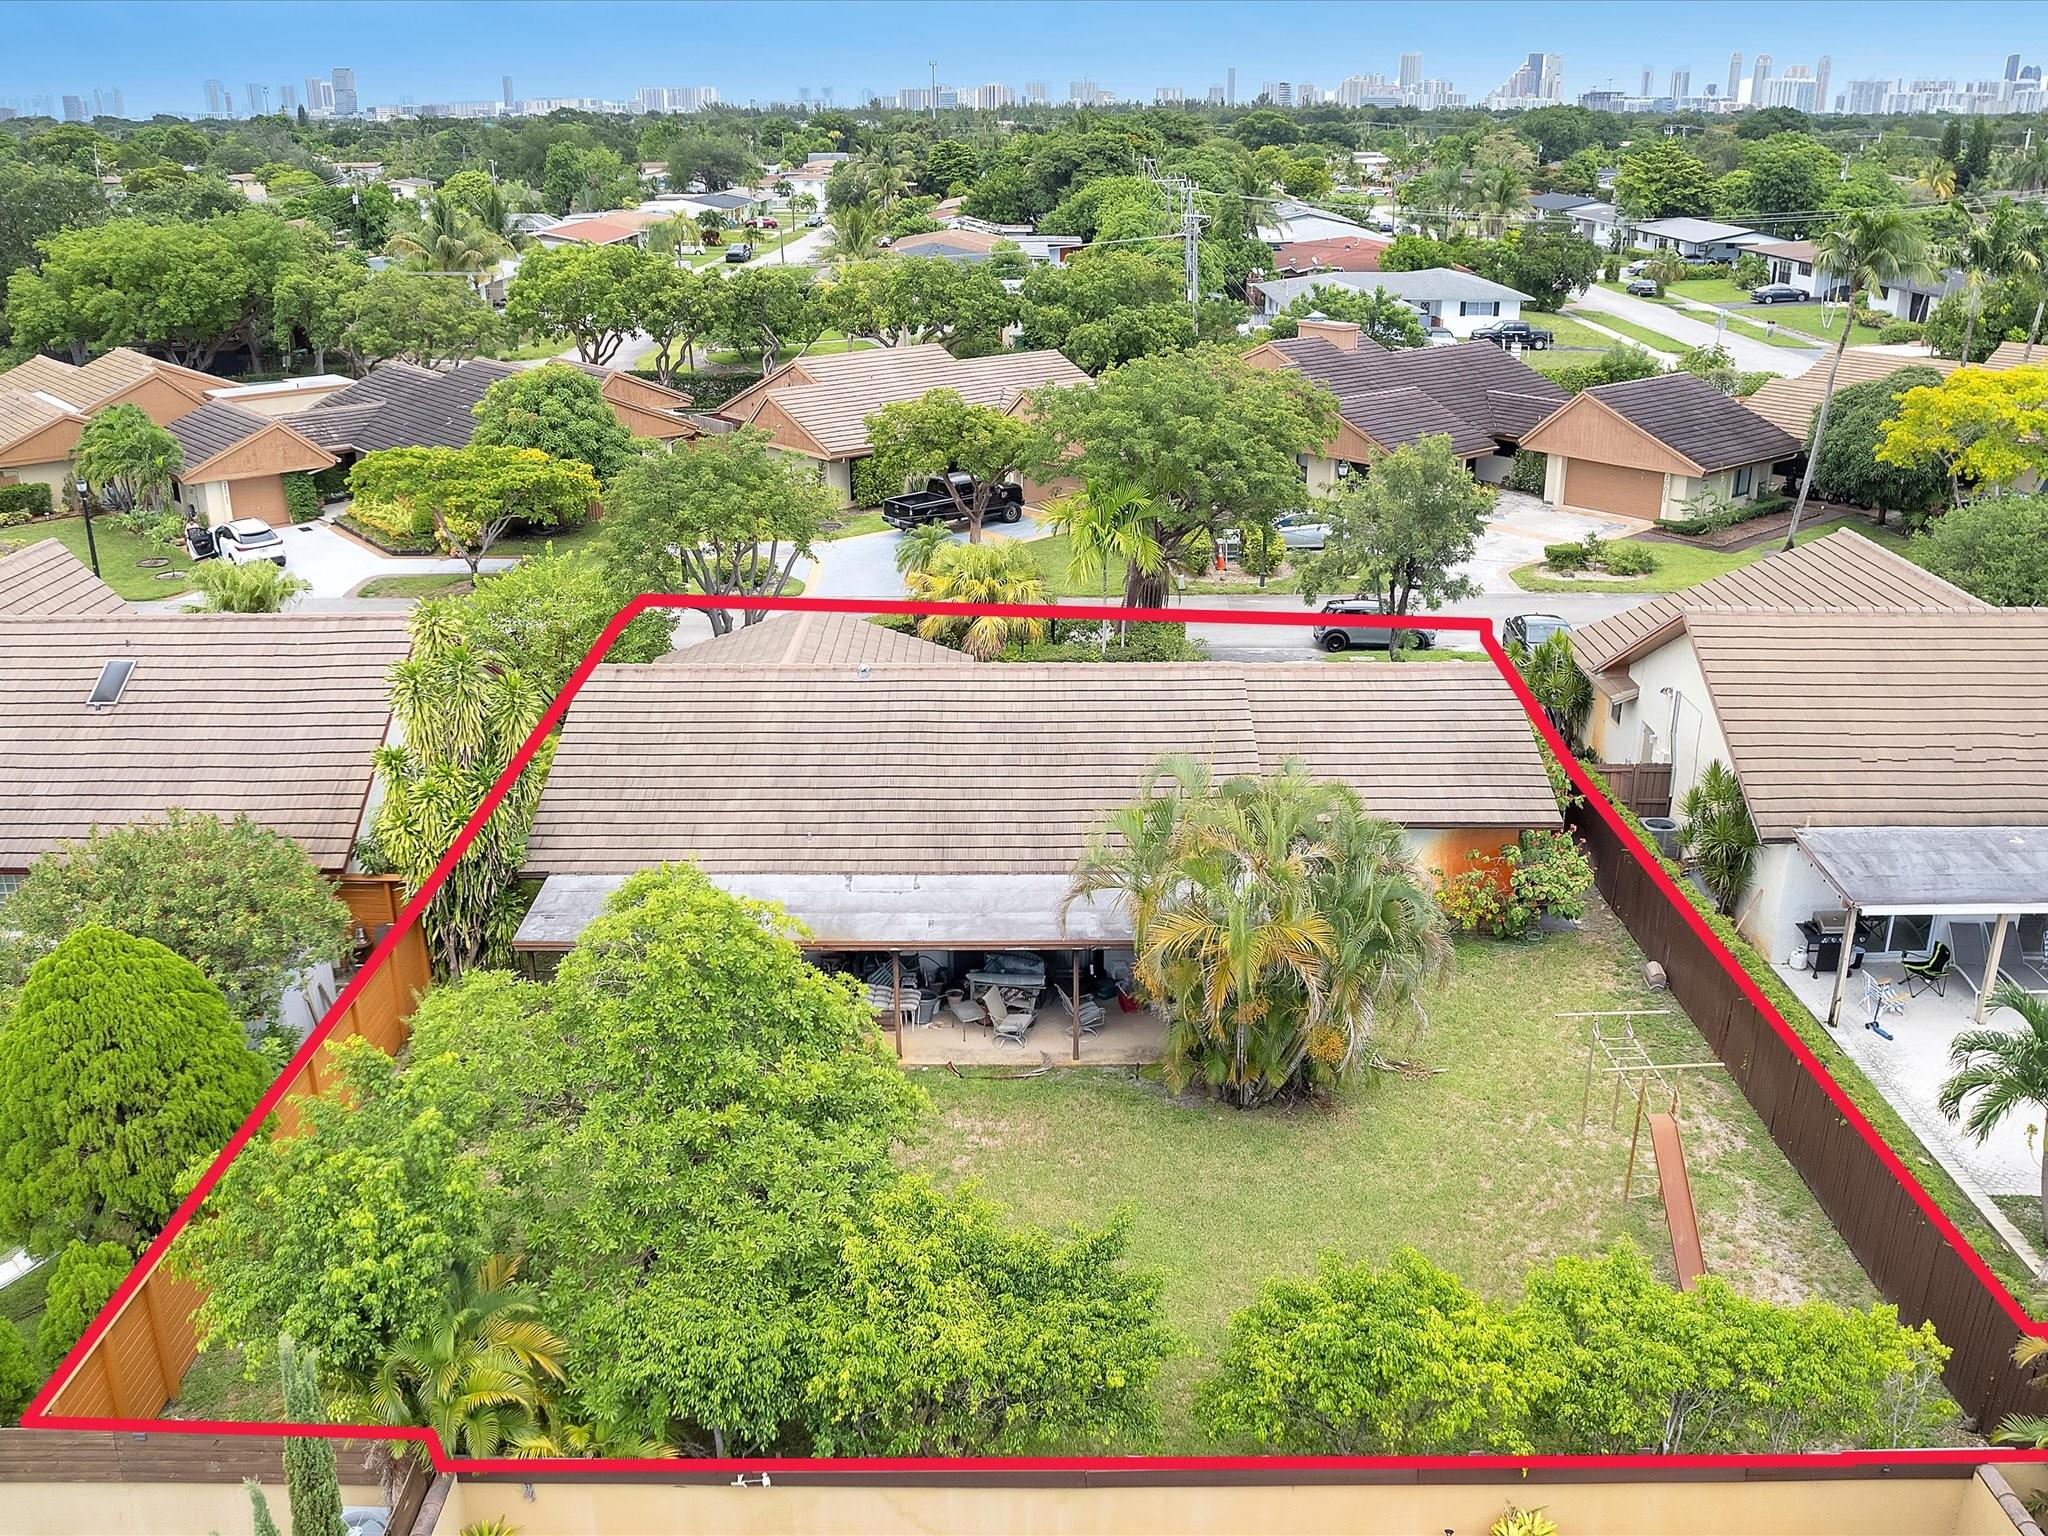
20100 NE 10th Place Way, Miami, FL 33179
$-806
Cash flow
-10.5%
Cash-on-Cash Return
3.7%
Cap rate
0.8%
Rent to Value Ratio

Active
$1,699,000
4
bds
|
3
ba
|
2,890
sqft
|
built
1962
8375 SW 89th St, Miami, FL 33156
$-4,383
Cash flow
-13.5%
Cash-on-Cash Return
3.1%
Cap rate
0.4%
Rent to Value Ratio
Active
$880,000
5
bds
|
4
ba
|
3,349
sqft
|
built
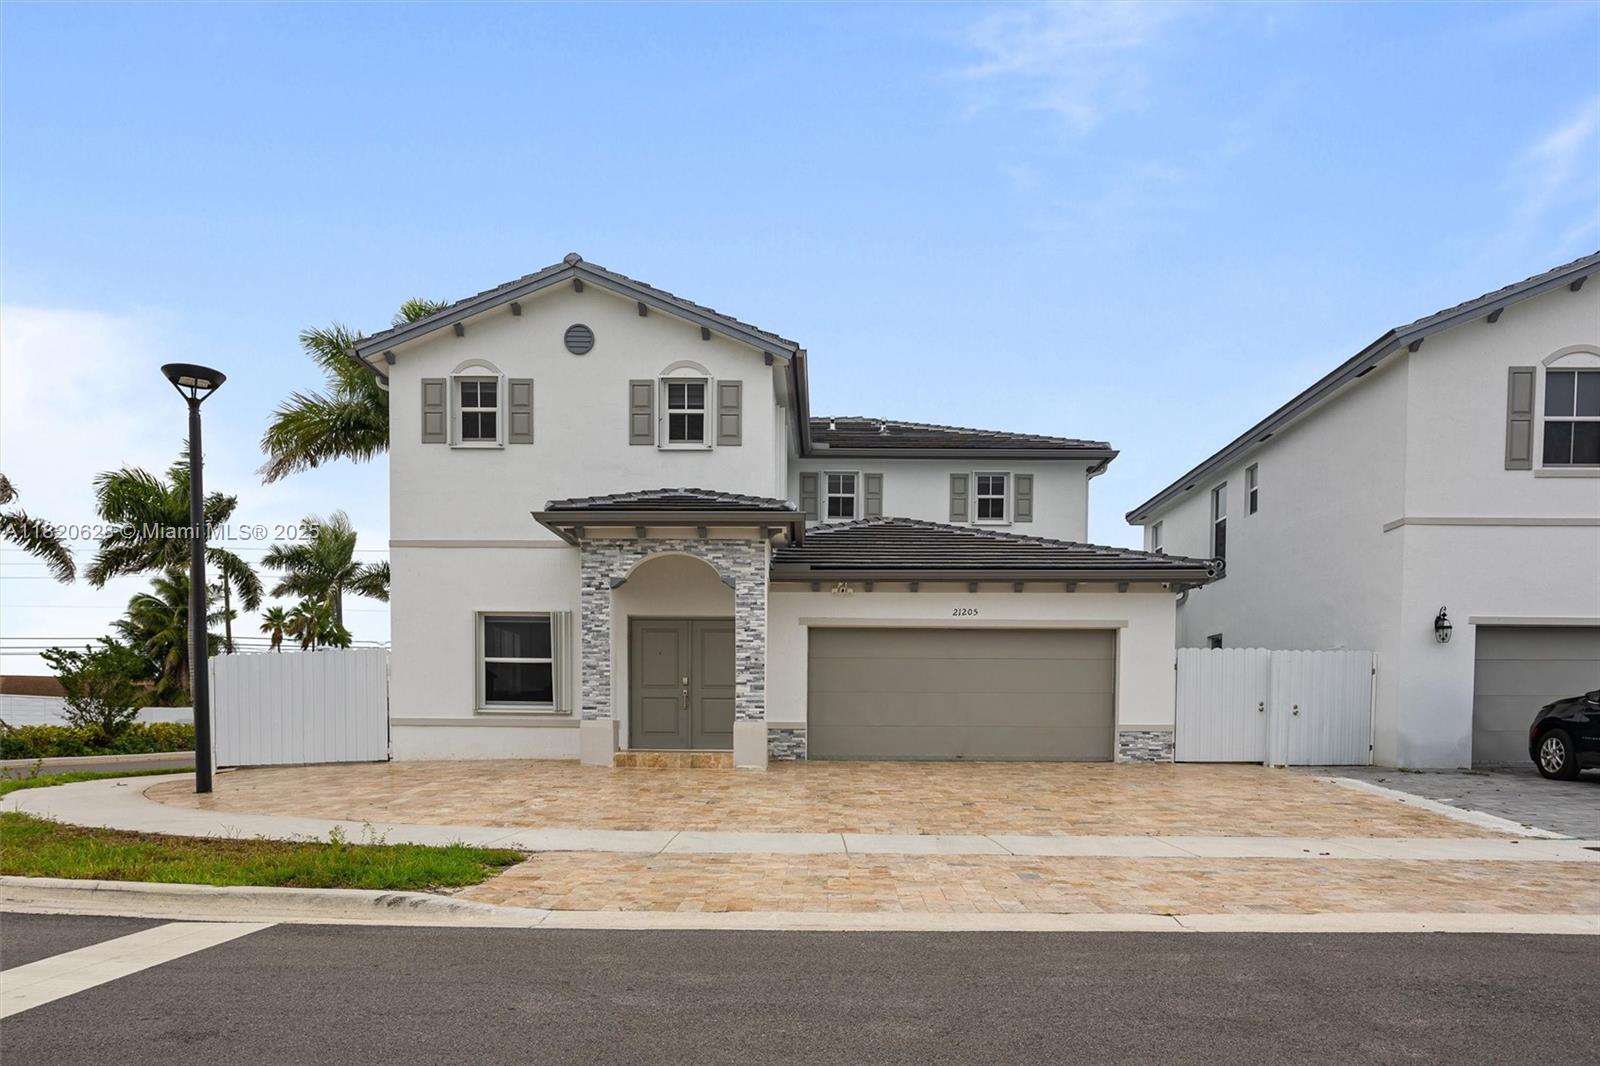
2023
21205 SW 127th Ct, Miami, FL 33177
$-2,549
Cash flow
-15.1%
Cash-on-Cash Return
2.7%
Cap rate
0.5%
Rent to Value Ratio

Active
$795,000
2
bds
|
2
ba
|
912
sqft
|
built
2017
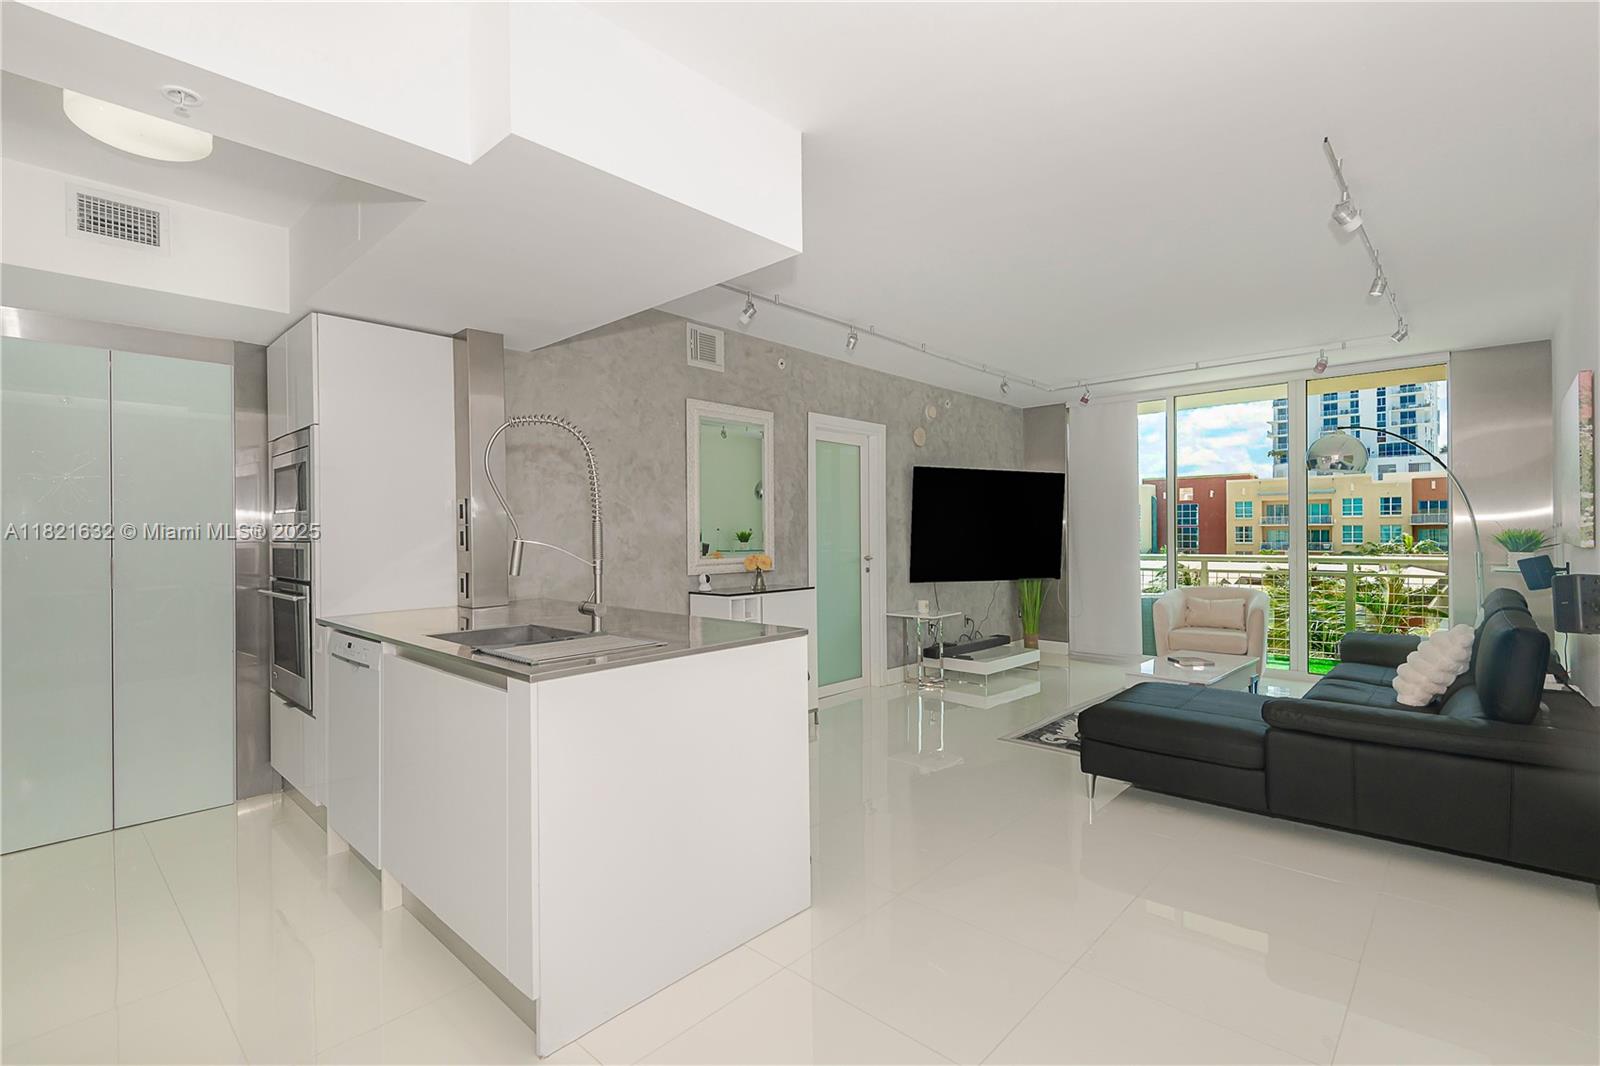
2900 NE 7th Ave, Miami, FL 33137
$-2,813
Cash flow
-18.5%
Cash-on-Cash Return
1.9%
Cap rate
0.6%
Rent to Value Ratio
Active
$583,000
4
bds
|
2
ba
|
2,094
sqft
|
built
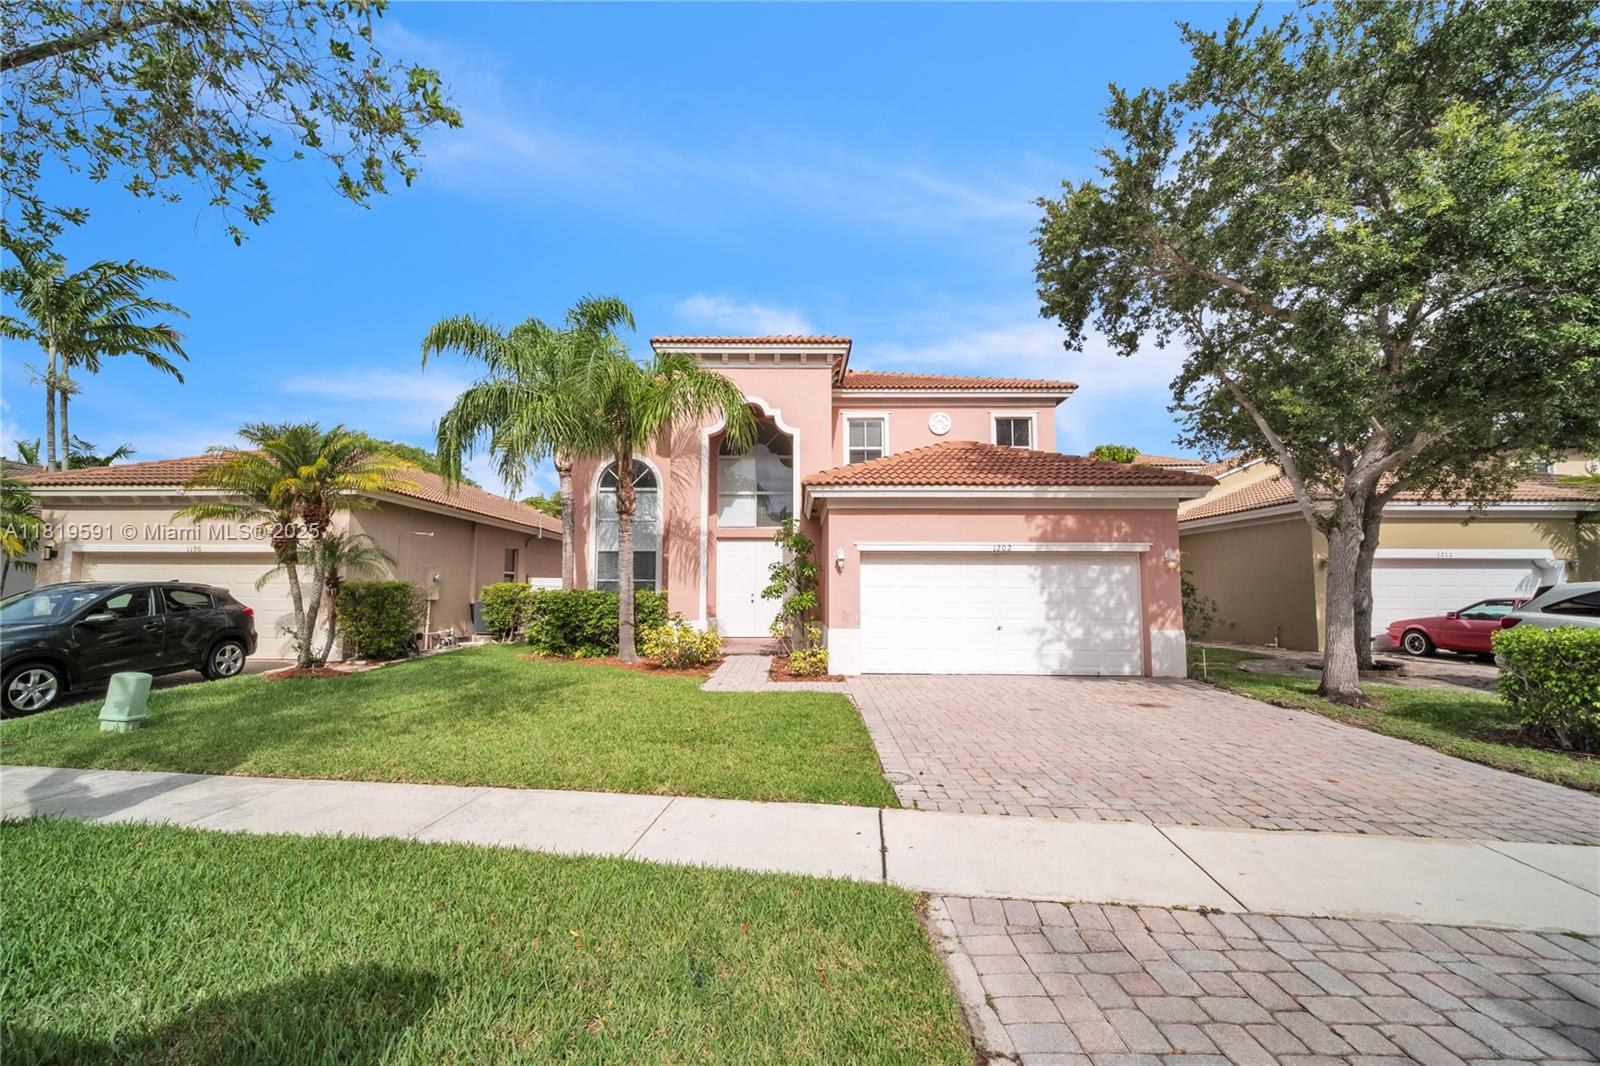
2005
1202 NE 37th Pl, Homestead, FL 33033
$-1,845
Cash flow
-16.5%
Cash-on-Cash Return
2.3%
Cap rate
0.5%
Rent to Value Ratio

Active
$349,000
1
bds
|
2
ba
|
868
sqft
|
built
1975
1800 Collins Ave, Miami Beach, FL 33139
$-1,207
Cash flow
-18.0%
Cash-on-Cash Return
2.0%
Cap rate
0.7%
Rent to Value Ratio
Active
$485,000
2
bds
|
2
ba
|
1,525
sqft
|
built
1971
19390 Collins Ave, Sunny Isles Beach, FL 33160
$-1,545
Cash flow
-16.6%
Cash-on-Cash Return
2.3%
Cap rate
0.6%
Rent to Value Ratio
Active
$585,000
2
bds
|
2
ba
|
1,073
sqft
|
built
2016
5300 NW 85th Ave, Doral, FL 33166
$-2,346
Cash flow
-20.9%
Cash-on-Cash Return
1.3%
Cap rate
0.7%
Rent to Value Ratio
Active
$470,000
3
bds
|
2
ba
|
1,812
sqft
|
built
2006
22006 SW 89th Ct, Cutler Bay, FL 33190
$-891
Cash flow
-9.9%
Cash-on-Cash Return
3.9%
Cap rate
0.7%
Rent to Value Ratio
Active
$380,000
3
bds
|
3
ba
|
1,165
sqft
|
built
1980
6315 SW 138th Ct, Miami, FL 33183
$-1,186
Cash flow
-16.3%
Cash-on-Cash Return
2.4%
Cap rate
0.7%
Rent to Value Ratio

Active
$425,000
3
bds
|
2
ba
|
1,973
sqft
|
built
1954
19800 NW Miami Ct, Miami, FL 33169
$-627
Cash flow
-7.7%
Cash-on-Cash Return
4.4%
Cap rate
0.8%
Rent to Value Ratio
Active
$740,000
4
bds
|
2
ba
|
1,597
sqft
|
built
1995
13774 SW 181st Ter, Miami, FL 33177
$-1,710
Cash flow
-12.1%
Cash-on-Cash Return
3.4%
Cap rate
0.5%
Rent to Value Ratio
Active
$1,249,000
2
bds
|
2
ba
|
1,390
sqft
|
built
2009
495 Brickell Ave, Miami, FL 33131
$-4,550
Cash flow
-19.0%
Cash-on-Cash Return
1.8%
Cap rate
0.6%
Rent to Value Ratio
Active
$350,000
1
bds
|
1
ba
|
738
sqft
|
built
1963
7904 West Dr, North Bay Village, FL 33141
$-876
Cash flow
-13.1%
Cash-on-Cash Return
3.1%
Cap rate
0.7%
Rent to Value Ratio
Active
$599,000
2
bds
|
2
ba
|
1,357
sqft
|
built
1975
100 Bayview Dr, Sunny Isles Beach, FL 33160
$-2,699
Cash flow
-23.5%
Cash-on-Cash Return
0.7%
Cap rate
0.6%
Rent to Value Ratio
Active
$589,000
2
bds
|
2
ba
|
1,061
sqft
|
built
1987
7601 E Treasure Dr, North Bay Village, FL 33141
$-1,614
Cash flow
-14.3%
Cash-on-Cash Return
2.9%
Cap rate
0.7%
Rent to Value Ratio

Active
$699,999
4
bds
|
3
ba
|
2,600
sqft
|
built
2002
21343 SW 88th Ct, Cutler Bay, FL 33189
$-1,357
Cash flow
-10.1%
Cash-on-Cash Return
3.8%
Cap rate
0.6%
Rent to Value Ratio
Active
$617,000
2
bds
|
2
ba
|
1,107
sqft
|
built
2004
2000 N Bayshore Dr, Miami, FL 33137
$-1,952
Cash flow
-16.5%
Cash-on-Cash Return
2.4%
Cap rate
0.6%
Rent to Value Ratio

Active
$3,690,000
3
bds
|
5
ba
|
2,572
sqft
|
built
2005
5959 Collins Ave, Miami Beach, FL 33140
$-19,768
Cash flow
-28.0%
Cash-on-Cash Return
-0.3%
Cap rate
0.2%
Rent to Value Ratio

Active
$2,850,000
4
bds
|
3
ba
|
2,415
sqft
|
built
1949
5211 Granada Blvd, Coral Gables, FL 33146
$-10,361
Cash flow
-19.0%
Cash-on-Cash Return
1.8%
Cap rate
0.3%
Rent to Value Ratio
Active
$2,225,000
4
bds
|
3
ba
|
2,277
sqft
|
built
1946
4531 SW 15th St, Miami, FL 33134
$-7,651
Cash flow
-17.9%
Cash-on-Cash Return
2.0%
Cap rate
0.4%
Rent to Value Ratio
Active
$2,125,000
4
bds
|
3
ba
|
2,634
sqft
|
built
1969
7980 SW 108th St, Miami, FL 33156
$-6,754
Cash flow
-16.6%
Cash-on-Cash Return
2.3%
Cap rate
0.3%
Rent to Value Ratio
Active
$325,000
2
bds
|
2
ba
|
1,044
sqft
|
built
1986
1782 W 42nd St, Hialeah, FL 33012
$-255
Cash flow
-4.1%
Cash-on-Cash Return
5.2%
Cap rate
0.8%
Rent to Value Ratio
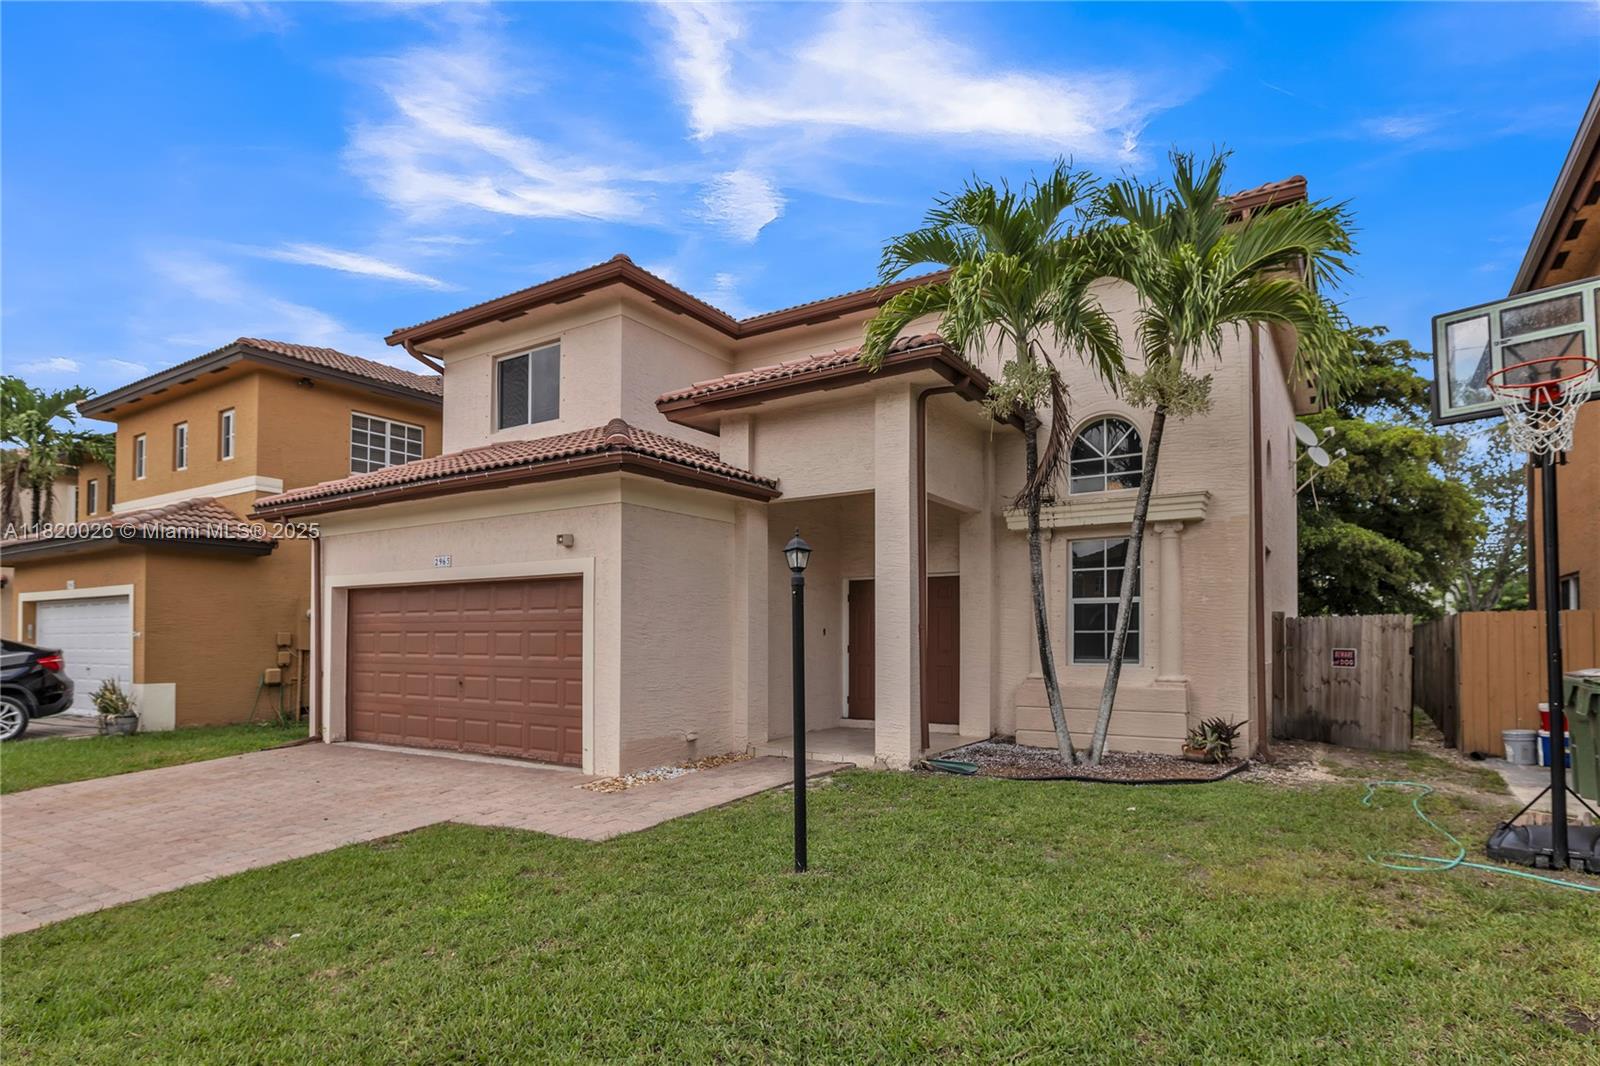
Active
$650,000
4
bds
|
3
ba
|
2,250
sqft
|
built
2014
13631 SW 272nd Ter, Homestead, FL 33032
$-1,426
Cash flow
-11.4%
Cash-on-Cash Return
3.5%
Cap rate
0.6%
Rent to Value Ratio
Active
$360,000
1
bds
|
1
ba
|
530
sqft
|
built
1925
1542 Drexel Ave, Miami Beach, FL 33139
$-1,212
Cash flow
-17.6%
Cash-on-Cash Return
2.1%
Cap rate
0.6%
Rent to Value Ratio
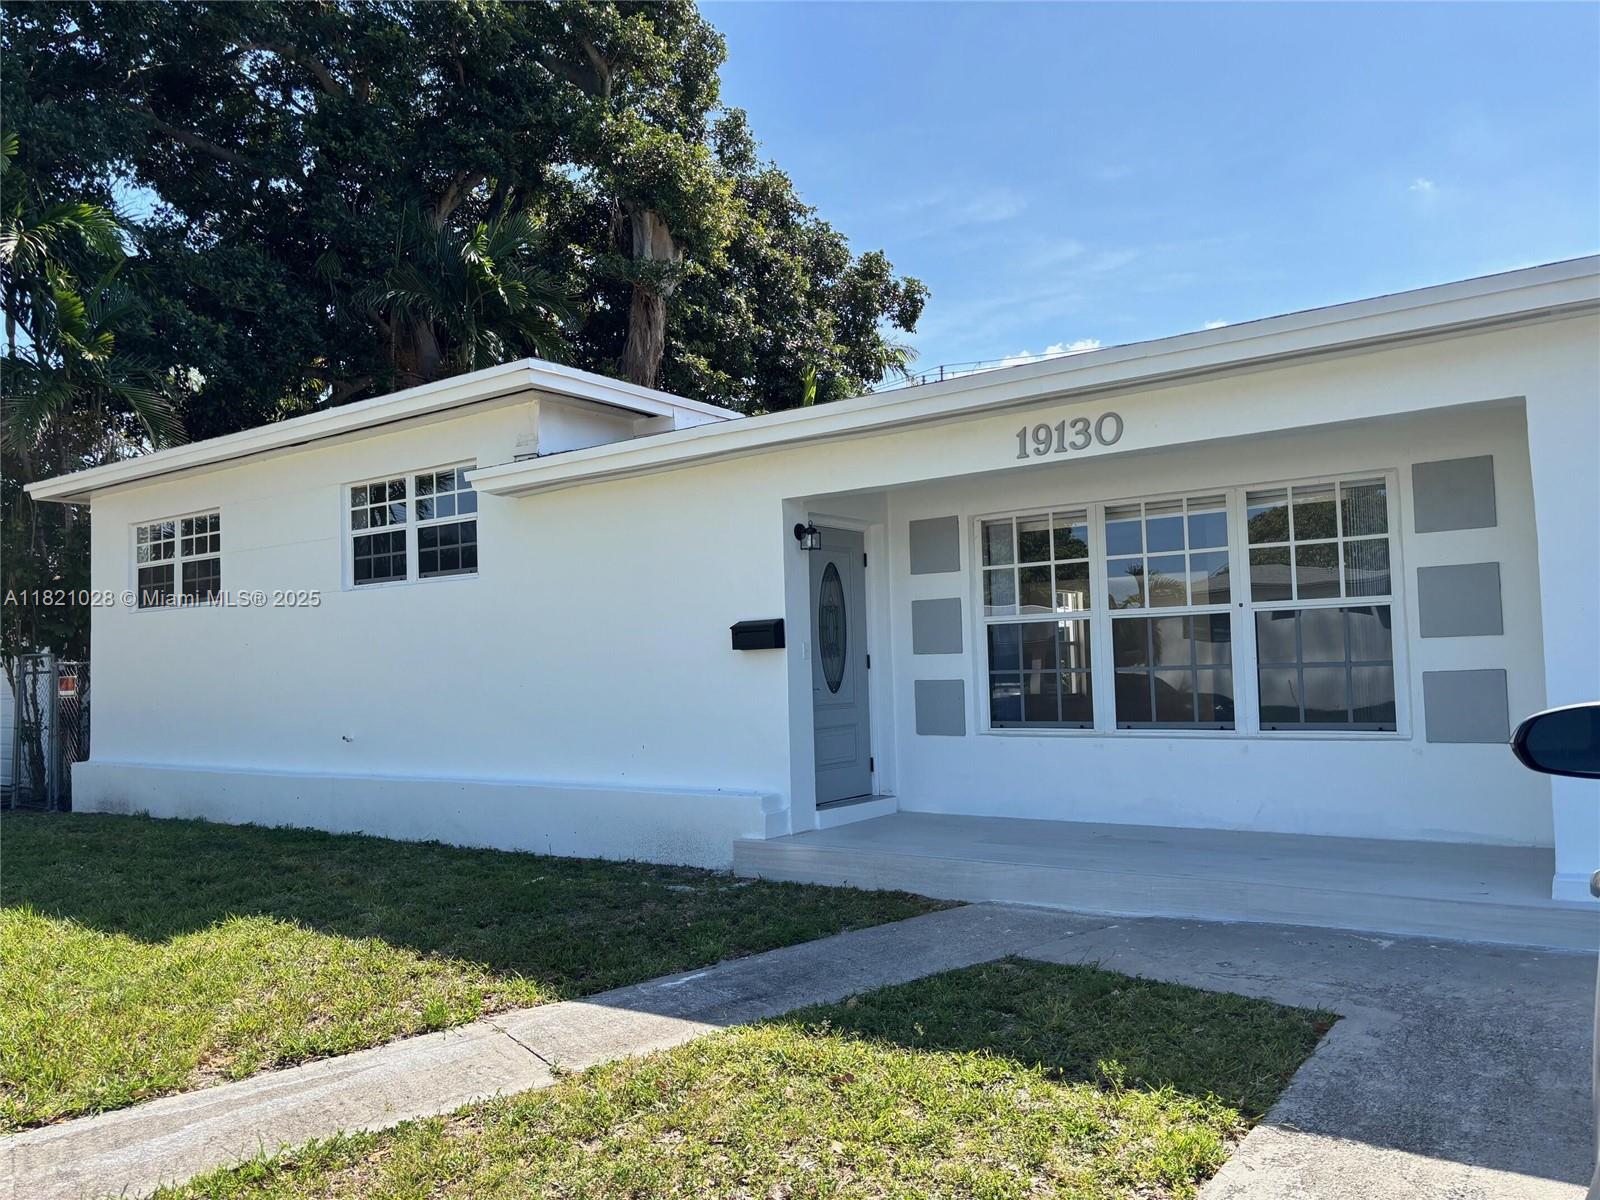
Active
$570,000
3
bds
|
2
ba
|
2,545
sqft
|
built
1954
19130 NW 10th Pl, Miami Gardens, FL 33169
$-1,396
Cash flow
-12.8%
Cash-on-Cash Return
3.2%
Cap rate
0.5%
Rent to Value Ratio

Active
$360,000
1
bds
|
2
ba
|
842
sqft
|
built
2008
7275 SW 90th Way, Miami, FL 33156
$-1,147
Cash flow
-16.6%
Cash-on-Cash Return
2.3%
Cap rate
0.7%
Rent to Value Ratio

Active
$799,999
6
bds
|
5
ba
|
2,373
sqft
|
built
1950
2941 NW 96th St, Miami, FL 33147
$-2,507
Cash flow
-16.4%
Cash-on-Cash Return
2.4%
Cap rate
0.4%
Rent to Value Ratio
Active
$869,000
3
bds
|
3
ba
|
2,981
sqft
|
built
2001
16313 SW 66th St, Miami, FL 33193
$-2,392
Cash flow
-14.4%
Cash-on-Cash Return
2.8%
Cap rate
0.5%
Rent to Value Ratio
Active
$800,000
2
bds
|
2
ba
|
1,168
sqft
|
built
2015
600 NE 27th St, Miami, FL 33137
$-2,621
Cash flow
-17.1%
Cash-on-Cash Return
2.2%
Cap rate
0.6%
Rent to Value Ratio
Active
$295,000
3
bds
|
2
ba
|
1,255
sqft
|
built
1991
6115 NW 186th St, Hialeah, FL 33015
$-96
Cash flow
-1.7%
Cash-on-Cash Return
5.8%
Cap rate
0.9%
Rent to Value Ratio

Active
$8,990,000
3
bds
|
4
ba
|
3,421
sqft
|
built
1940
6165 Pine Tree Dr, Miami Beach, FL 33140
$-43,117
Cash flow
-25.0%
Cash-on-Cash Return
0.4%
Cap rate
0.1%
Rent to Value Ratio
Active
$169,900
0
bds
|
1
ba
|
406
sqft
|
built
1958
7720 Harding Ave, Miami Beach, FL 33141
$-544
Cash flow
-16.7%
Cash-on-Cash Return
2.3%
Cap rate
0.9%
Rent to Value Ratio
Active
$330,000
2
bds
|
2
ba
|
850
sqft
|
built
1986
15495 Miami Lakeway N, Miami Lakes, FL 33014
$-757
Cash flow
-12.0%
Cash-on-Cash Return
3.4%
Cap rate
0.8%
Rent to Value Ratio
Active
$1,060,000
4
bds
|
4
ba
|
2,923
sqft
|
built
1999
5343 NW 111th Ct, Doral, FL 33178
$-2,566
Cash flow
-12.6%
Cash-on-Cash Return
3.2%
Cap rate
0.5%
Rent to Value Ratio
Active
$280,000
1
bds
|
1
ba
|
520
sqft
|
built
1925
1200 Euclid Ave, Miami Beach, FL 33139
$-751
Cash flow
-14.0%
Cash-on-Cash Return
2.9%
Cap rate
0.8%
Rent to Value Ratio
Active
$410,000
2
bds
|
3
ba
|
1,330
sqft
|
built
1980
7074 SW 114th Pl, Miami, FL 33173
$-1,403
Cash flow
-17.9%
Cash-on-Cash Return
2.0%
Cap rate
0.7%
Rent to Value Ratio

Active
$975,000
3
bds
|
3
ba
|
1,898
sqft
|
built
1989
20939 NE 37th Ct, Aventura, FL 33180
$-2,471
Cash flow
-13.2%
Cash-on-Cash Return
3.1%
Cap rate
0.6%
Rent to Value Ratio