Miami Dade County Investment Properties for Sale
Browse homes for sale and investment properties in Miami Dade County. Refine your search by price, property type, or more.
Best cash flowing properties in Miami Dade County
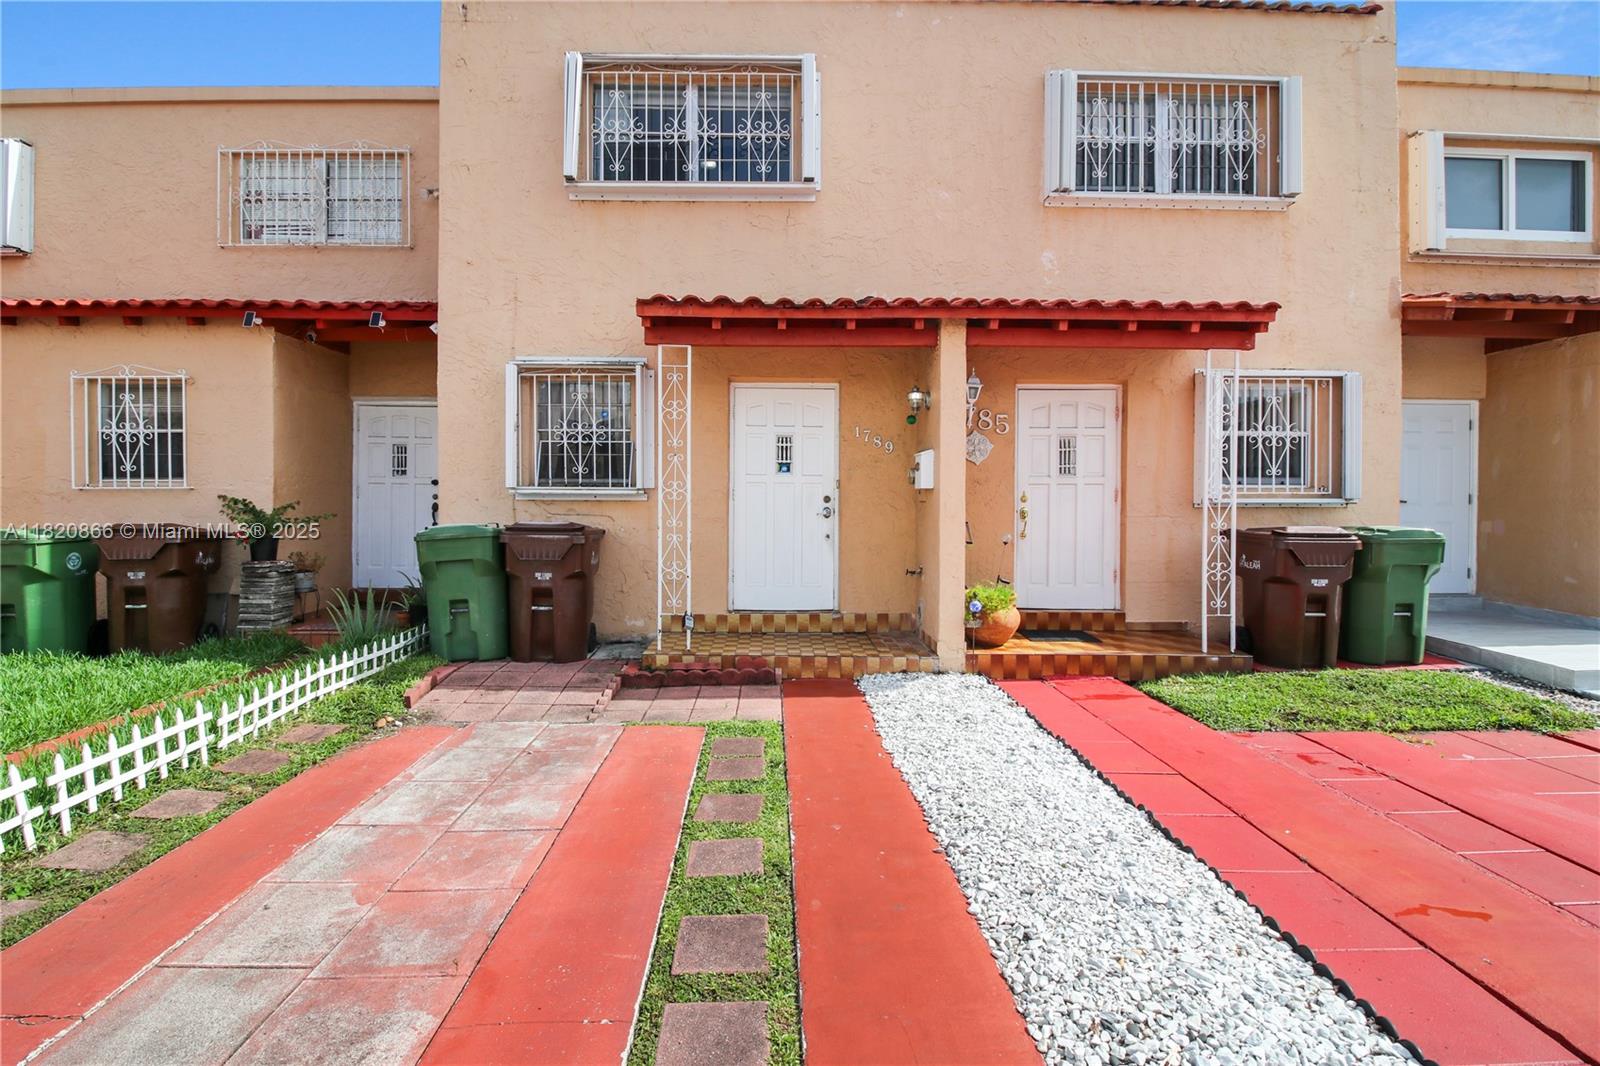
Active under contract
$260,000
2
bds
|
2
ba
|
1,000
sqft
|
built
1978
1789 W 57th St, Hialeah, FL 33012
$-282
Cash flow
-5.7%
Cash-on-Cash Return
5.0%
Cap rate
0.9%
Rent to Value Ratio
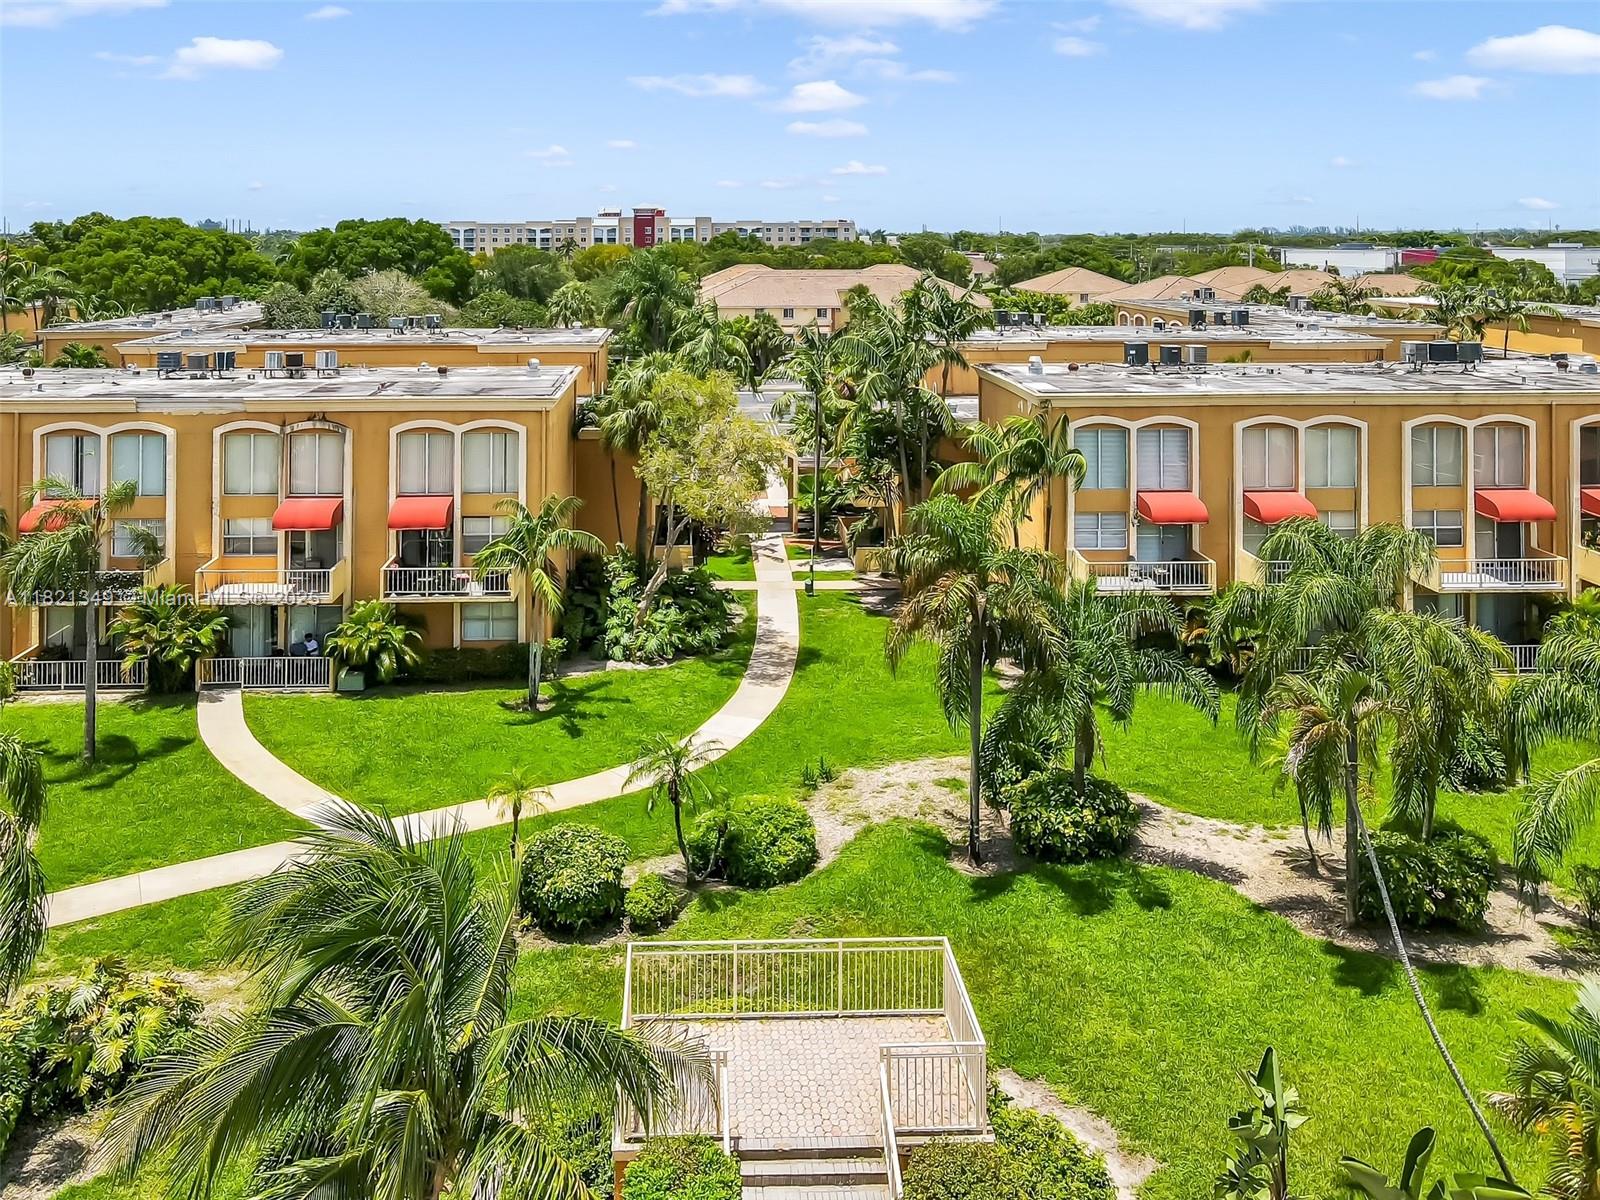
Active
$219,000
2
bds
|
2
ba
|
1,210
sqft
|
built
1970
17901 NW 68th Ave, Hialeah, FL 33015
$-403
Cash flow
-9.6%
Cash-on-Cash Return
4.1%
Cap rate
1.1%
Rent to Value Ratio
10,000 out of 16,818 properties for sale in Miami Dade County
Limited Results Shown
Create a free account, or log in to reveal all property listings and enjoy the complete experience.
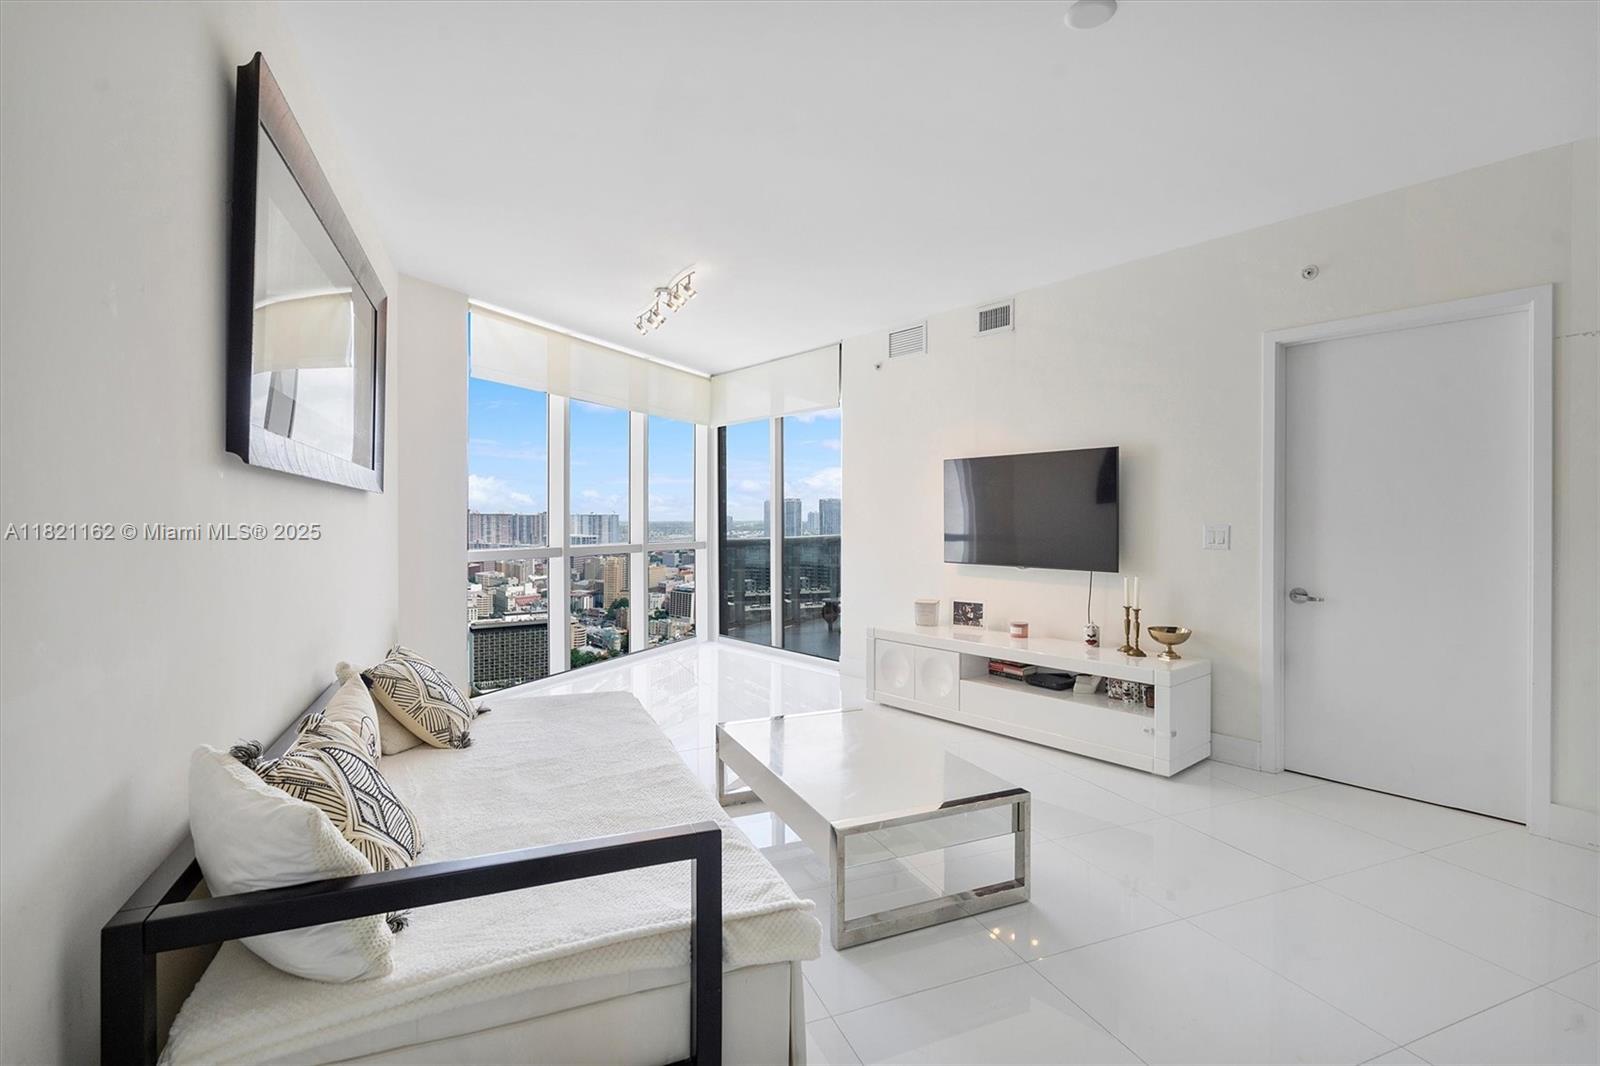
Active
$845,000
1
bds
|
2
ba
|
881
sqft
|
built
2008
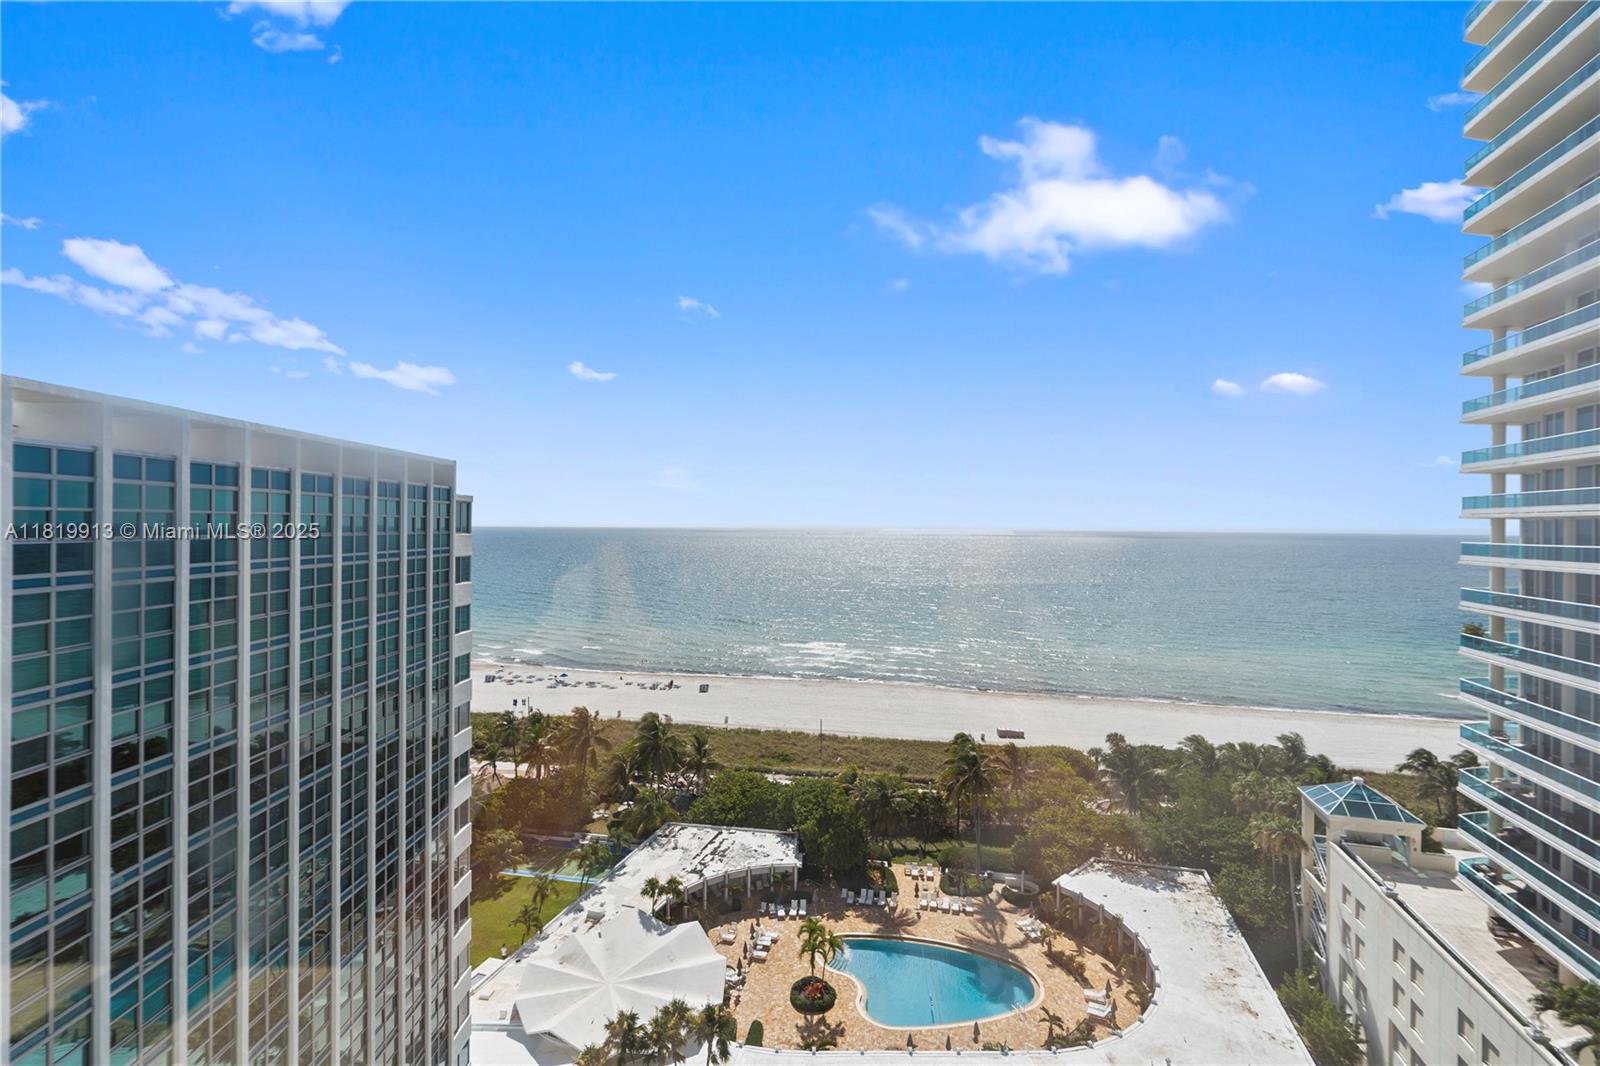
18201 Collins Ave, Sunny Isles Beach, FL 33160
$-3,531
Cash flow
-21.8%
Cash-on-Cash Return
1.3%
Cap rate
0.5%
Rent to Value Ratio
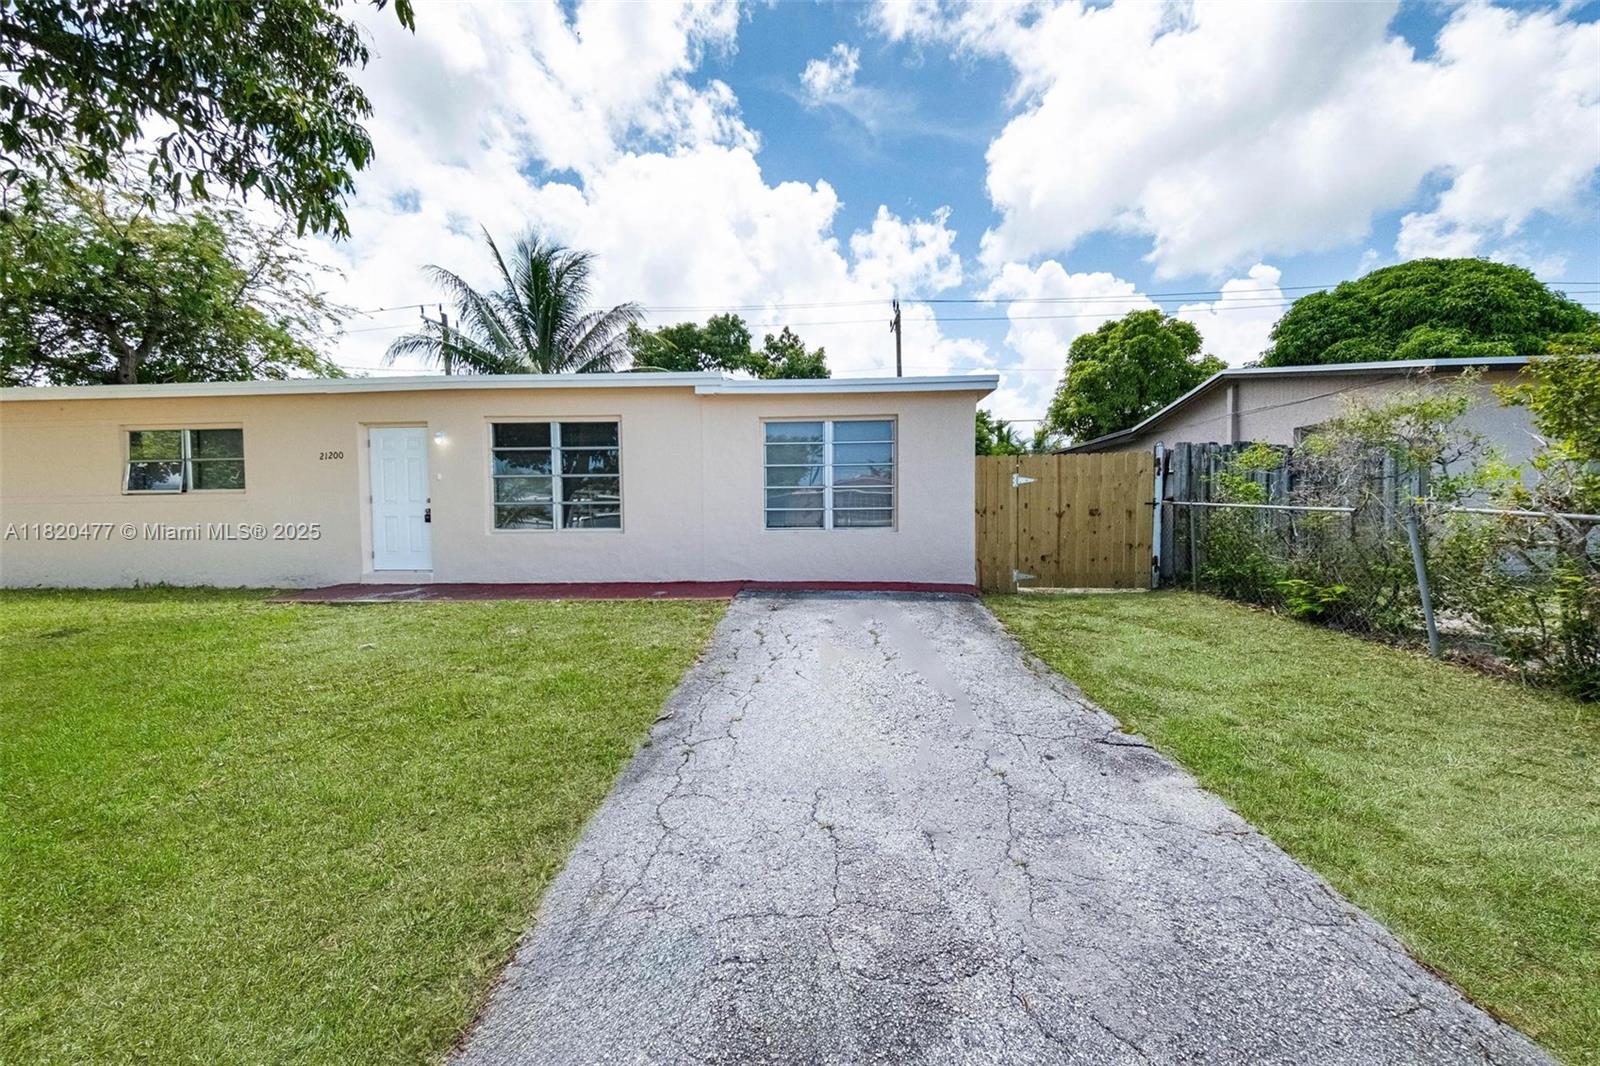
Active
$555,000
3
bds
|
2
ba
|
1,288
sqft
|
built
1956
21200 NE 12th Ct, Miami, FL 33179
$-1,131
Cash flow
-10.6%
Cash-on-Cash Return
3.8%
Cap rate
0.6%
Rent to Value Ratio
Active
$189,900
1
bds
|
1
ba
|
605
sqft
|
built
1972
801 NW 47th Ave, Miami, FL 33126
$-409
Cash flow
-11.2%
Cash-on-Cash Return
3.7%
Cap rate
0.9%
Rent to Value Ratio
Active
$650,000
4
bds
|
3
ba
|
1,506
sqft
|
built
2021
8363 NW 41st St, Doral, FL 33166
$-1,660
Cash flow
-13.3%
Cash-on-Cash Return
3.2%
Cap rate
0.7%
Rent to Value Ratio
Active
$2,150,000
3
bds
|
4
ba
|
1,979
sqft
|
built
2008
15901 Collins Ave, Sunny Isles Beach, FL 33160
$-9,707
Cash flow
-23.6%
Cash-on-Cash Return
0.9%
Cap rate
0.4%
Rent to Value Ratio
Active
$345,000
1
bds
|
1
ba
|
430
sqft
|
built
2016
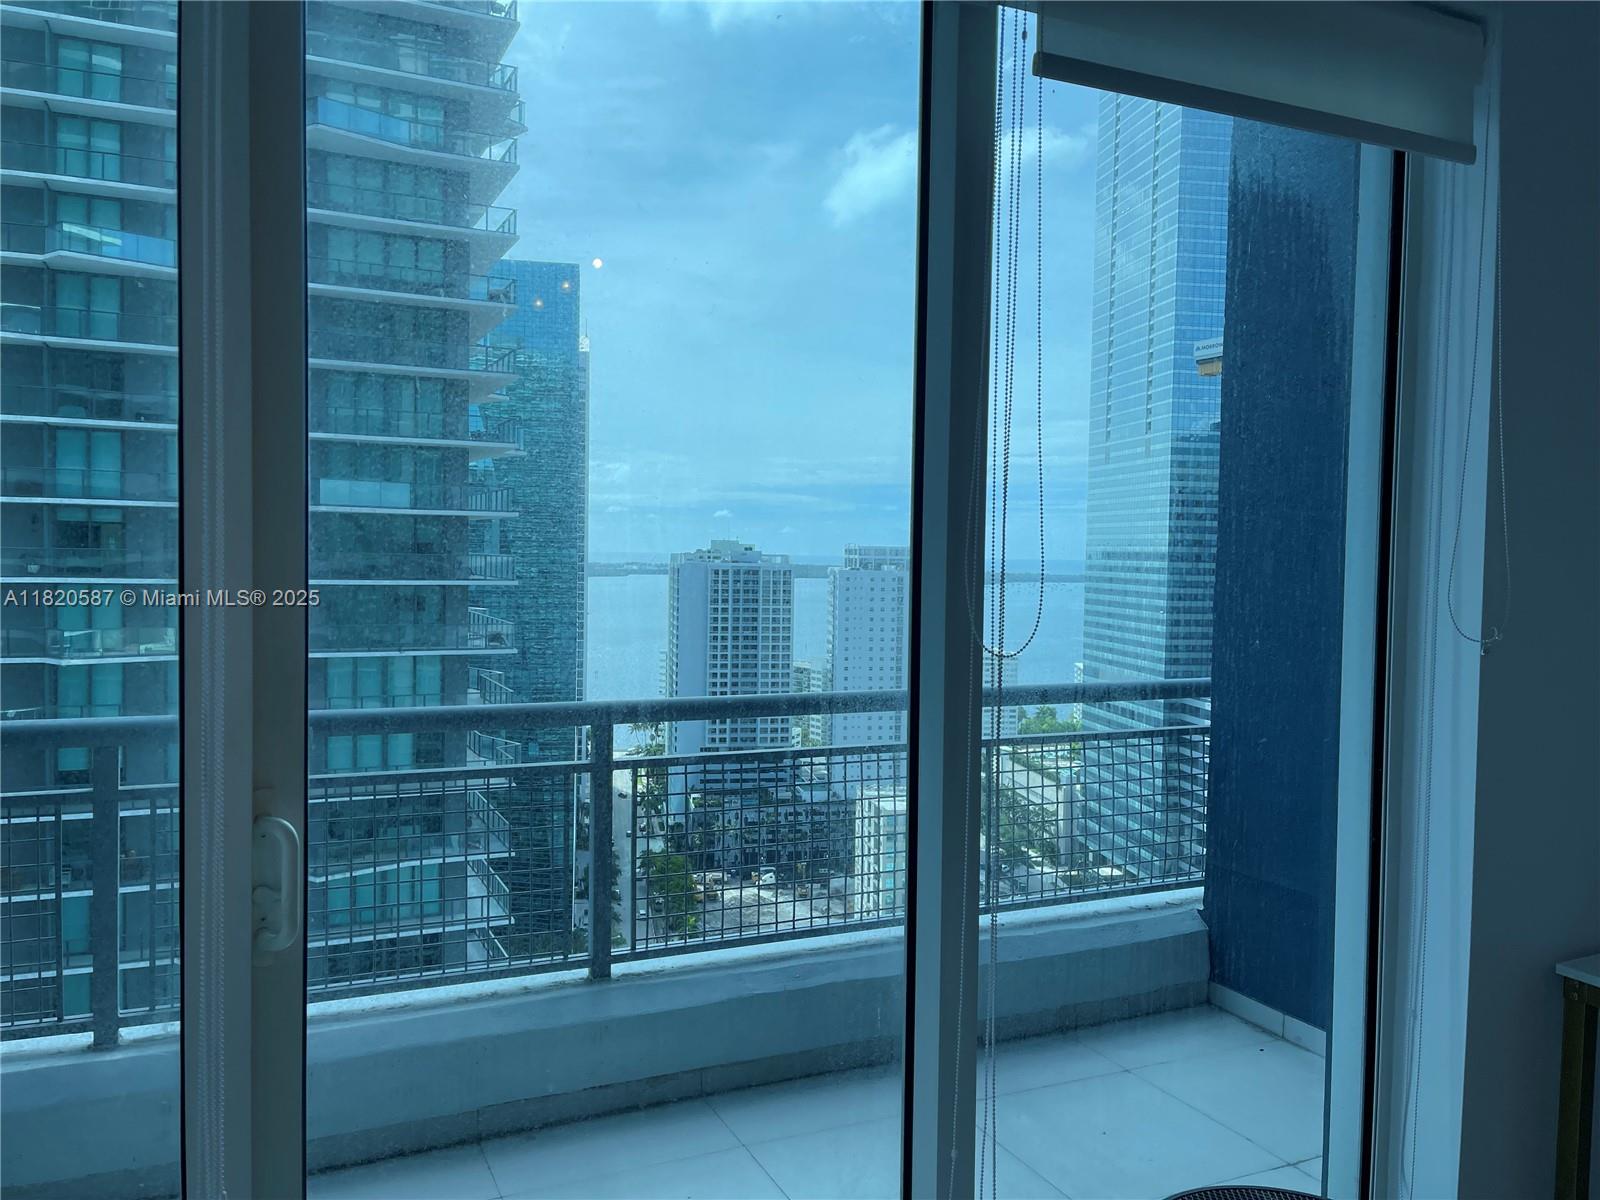
151 SE 1st St, Miami, FL 33131
$-760
Cash flow
-11.5%
Cash-on-Cash Return
3.6%
Cap rate
0.8%
Rent to Value Ratio

Active
$915,000
2
bds
|
2
ba
|
1,311
sqft
|
built
1975
575 Crandon Blvd, Key Biscayne, FL 33149
$-2,811
Cash flow
-16.0%
Cash-on-Cash Return
2.6%
Cap rate
0.6%
Rent to Value Ratio
Active
$1,000,000
3
bds
|
4
ba
|
1,104
sqft
|
built
1948
6430 SW 58th Pl, South Miami, FL 33143
$-3,455
Cash flow
-18.0%
Cash-on-Cash Return
2.1%
Cap rate
0.4%
Rent to Value Ratio
Active
$219,000
2
bds
|
2
ba
|
1,210
sqft
|
built
1970
17901 NW 68th Ave, Hialeah, FL 33015
$-403
Cash flow
-9.6%
Cash-on-Cash Return
4.1%
Cap rate
1.1%
Rent to Value Ratio

Active
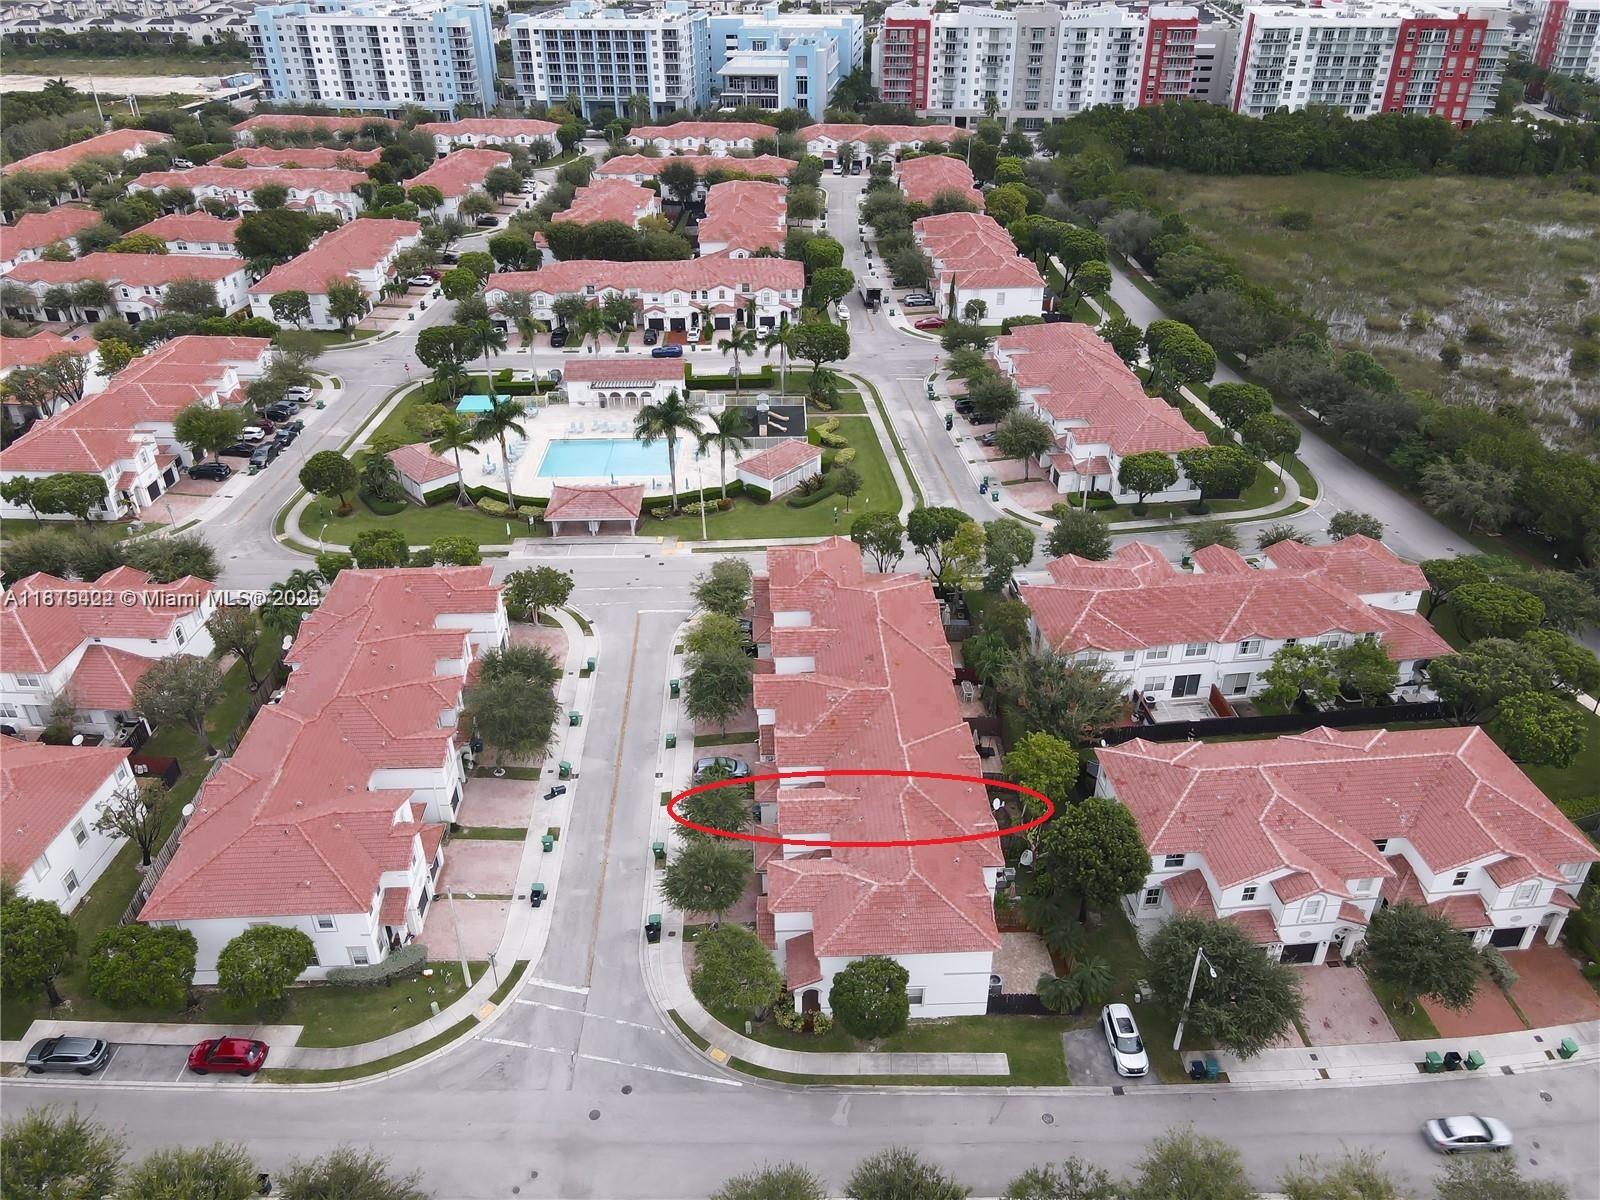
$490,000
3
bds
|
3
ba
|
0
sqft
|
built
2023
23404 SW 131st Ave, Homestead, FL 33032
$-1,390
Cash flow
-14.8%
Cash-on-Cash Return
2.9%
Cap rate
0.6%
Rent to Value Ratio
Active
$879,999
4
bds
|
3
ba
|
2,362
sqft
|
built
1971
9627 SW 18th Ter, Miami, FL 33165
$-3,533
Cash flow
-20.9%
Cash-on-Cash Return
1.5%
Cap rate
0.4%
Rent to Value Ratio
Active
$665,000
4
bds
|
3
ba
|
2,290
sqft
|
built
2005
13745 SW 113th Ln, Miami, FL 33186
$-1,770
Cash flow
-13.9%
Cash-on-Cash Return
3.1%
Cap rate
0.5%
Rent to Value Ratio

Active
$670,000
4
bds
|
2
ba
|
1,800
sqft
|
built
2020
31671 SW 190th Ct, Homestead, FL 33030
$-1,819
Cash flow
-14.2%
Cash-on-Cash Return
3.0%
Cap rate
0.5%
Rent to Value Ratio
Active
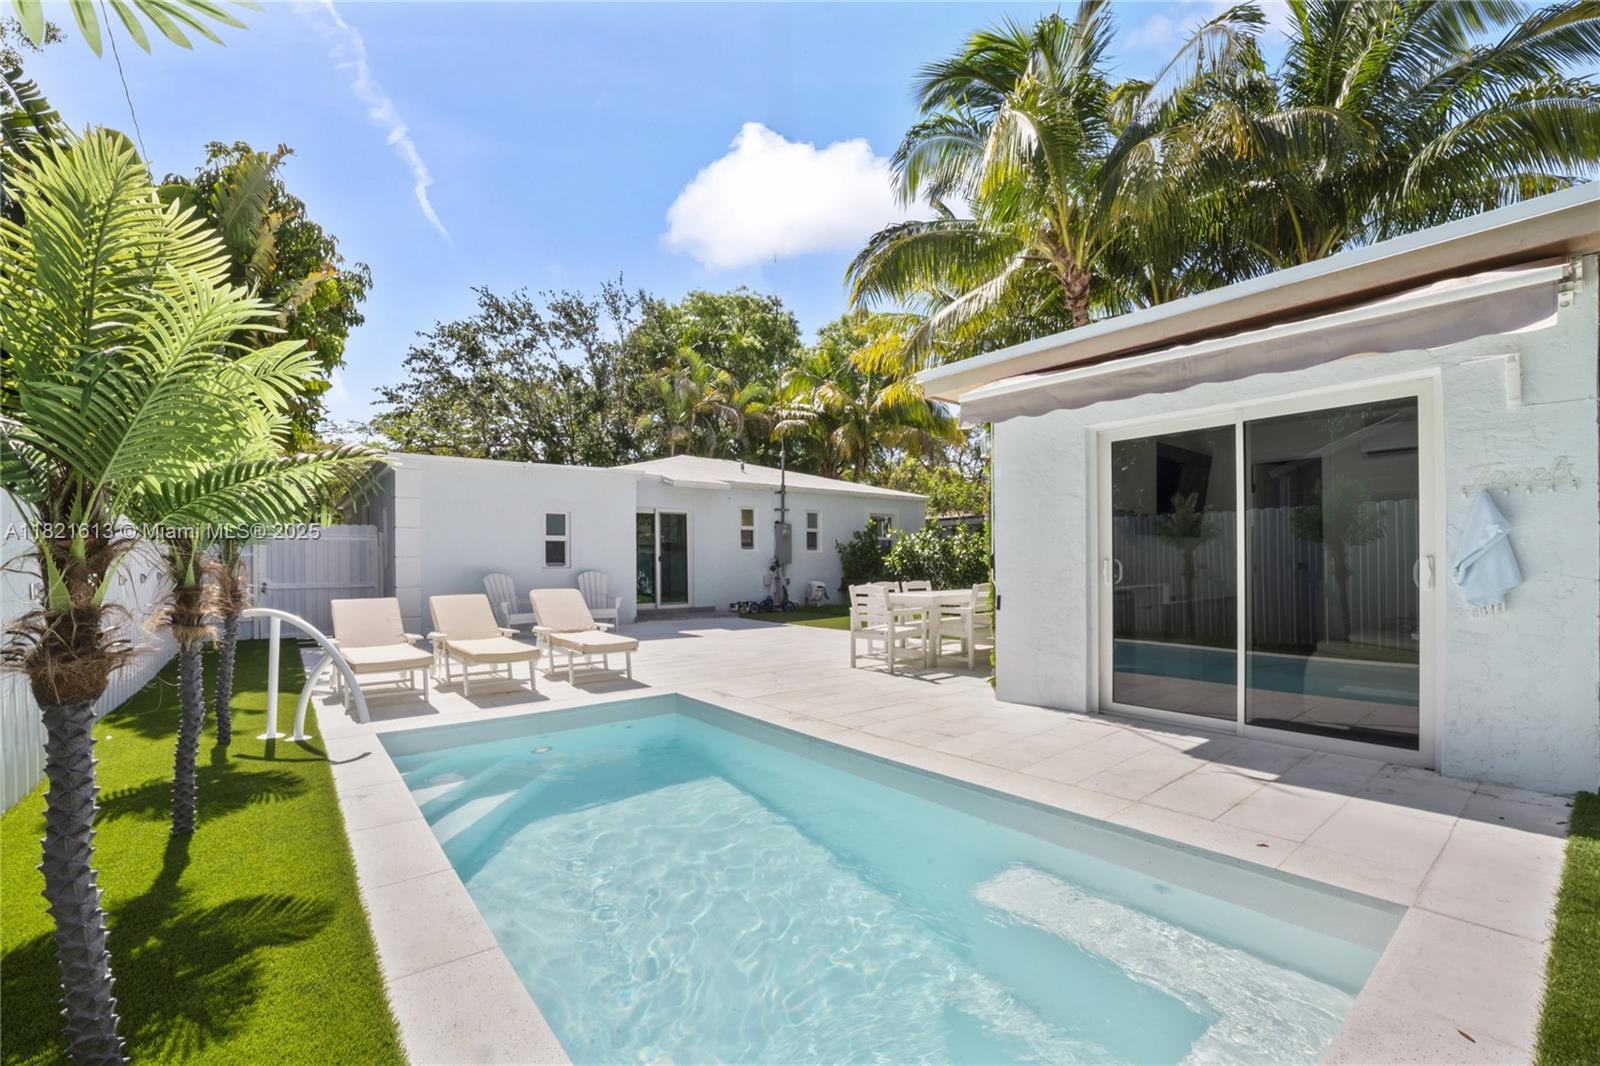
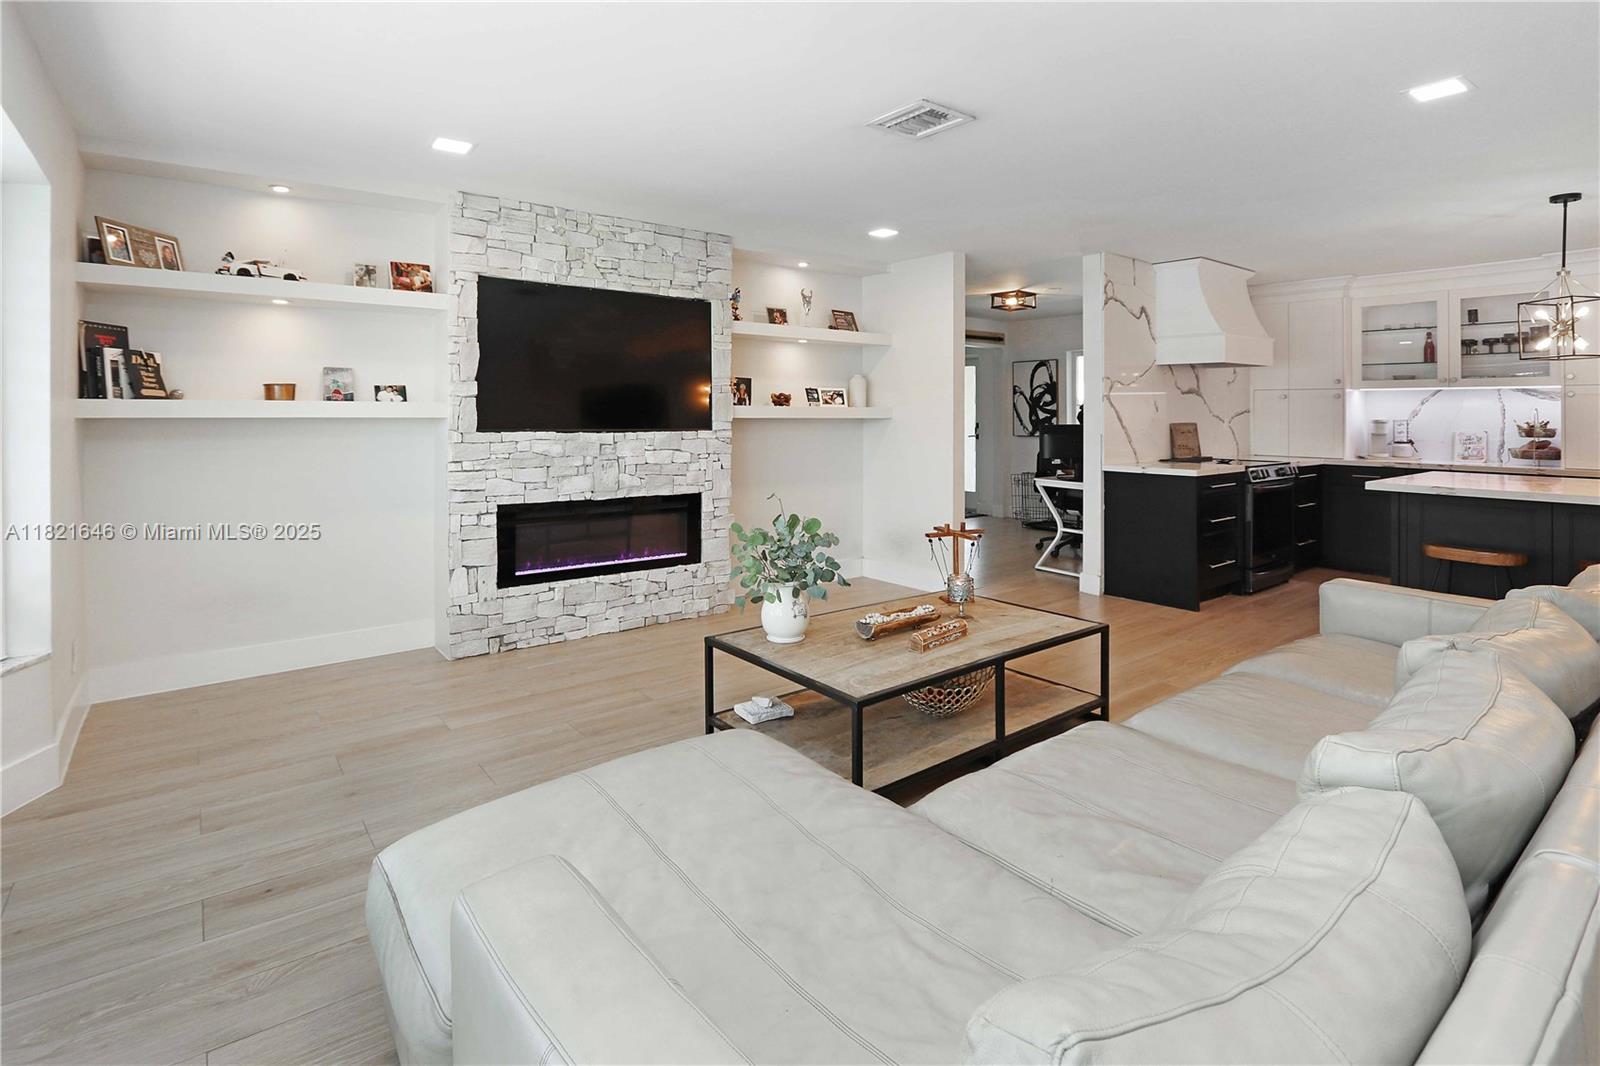
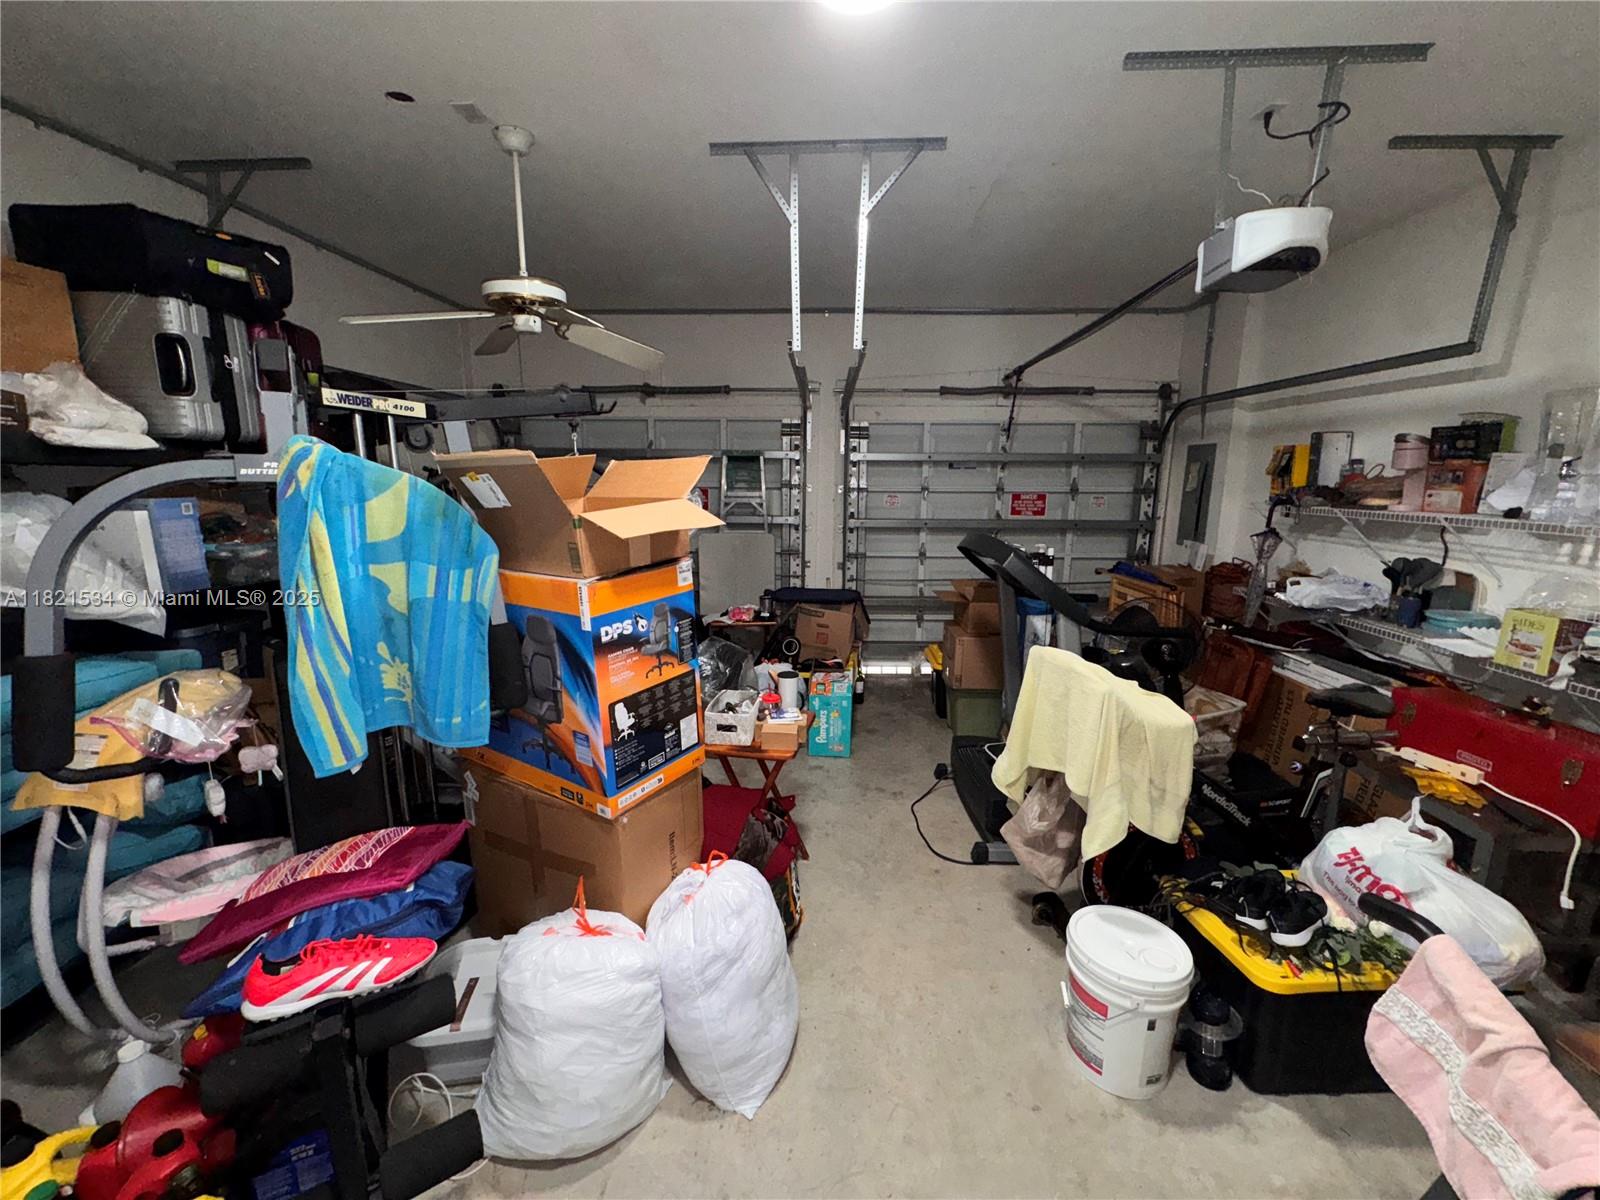
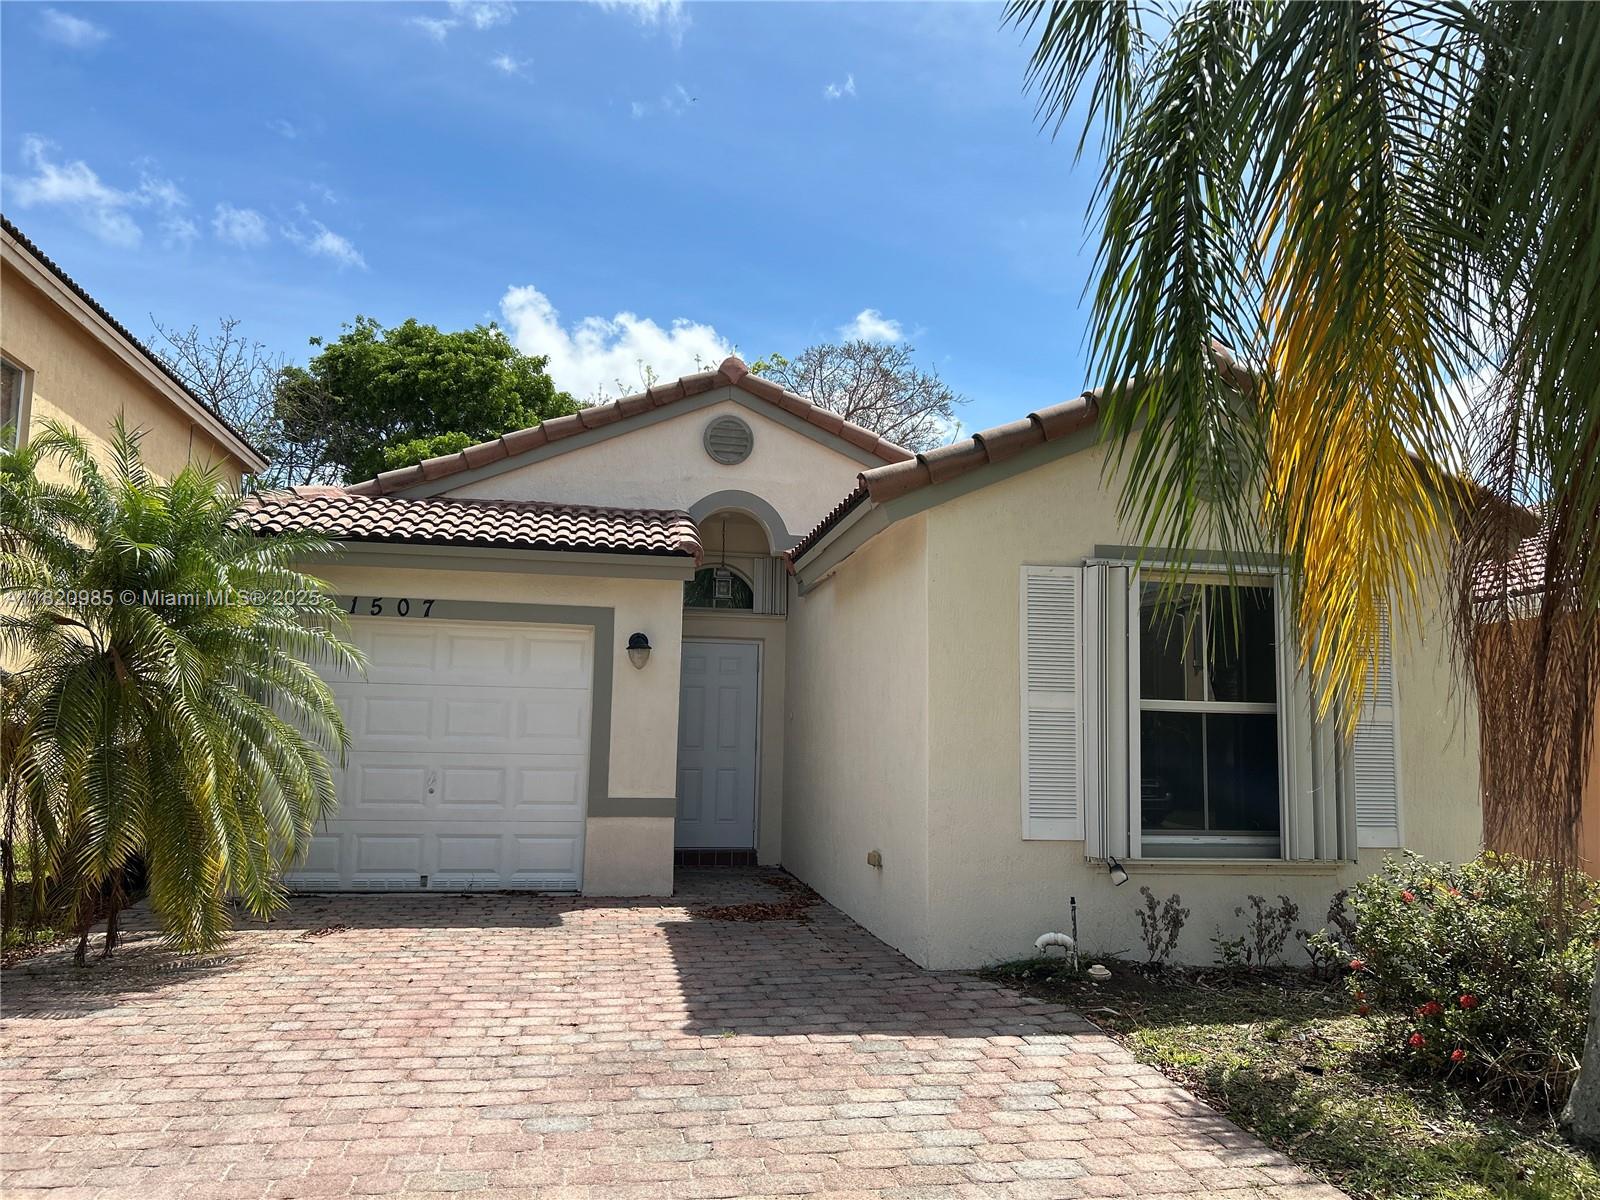
$429,900
3
bds
|
2
ba
|
1,336
sqft
|
built
2005
1507 SE 20th Rd, Homestead, FL 33035
$-1,012
Cash flow
-12.3%
Cash-on-Cash Return
3.5%
Cap rate
0.5%
Rent to Value Ratio

Active
$14,995,000
6
bds
|
8
ba
|
6,753
sqft
|
built
1995
180 Solano Prado, Coral Gables, FL 33156
$-80,817
Cash flow
-28.1%
Cash-on-Cash Return
-0.2%
Cap rate
0.1%
Rent to Value Ratio
Active
$949,700
4
bds
|
3
ba
|
3,656
sqft
|
built
1978
31160 SW 195th Ave, Homestead, FL 33030
$-757
Cash flow
-4.2%
Cash-on-Cash Return
5.3%
Cap rate
0.7%
Rent to Value Ratio

Active
$495,000
3
bds
|
2
ba
|
1,110
sqft
|
built
1978
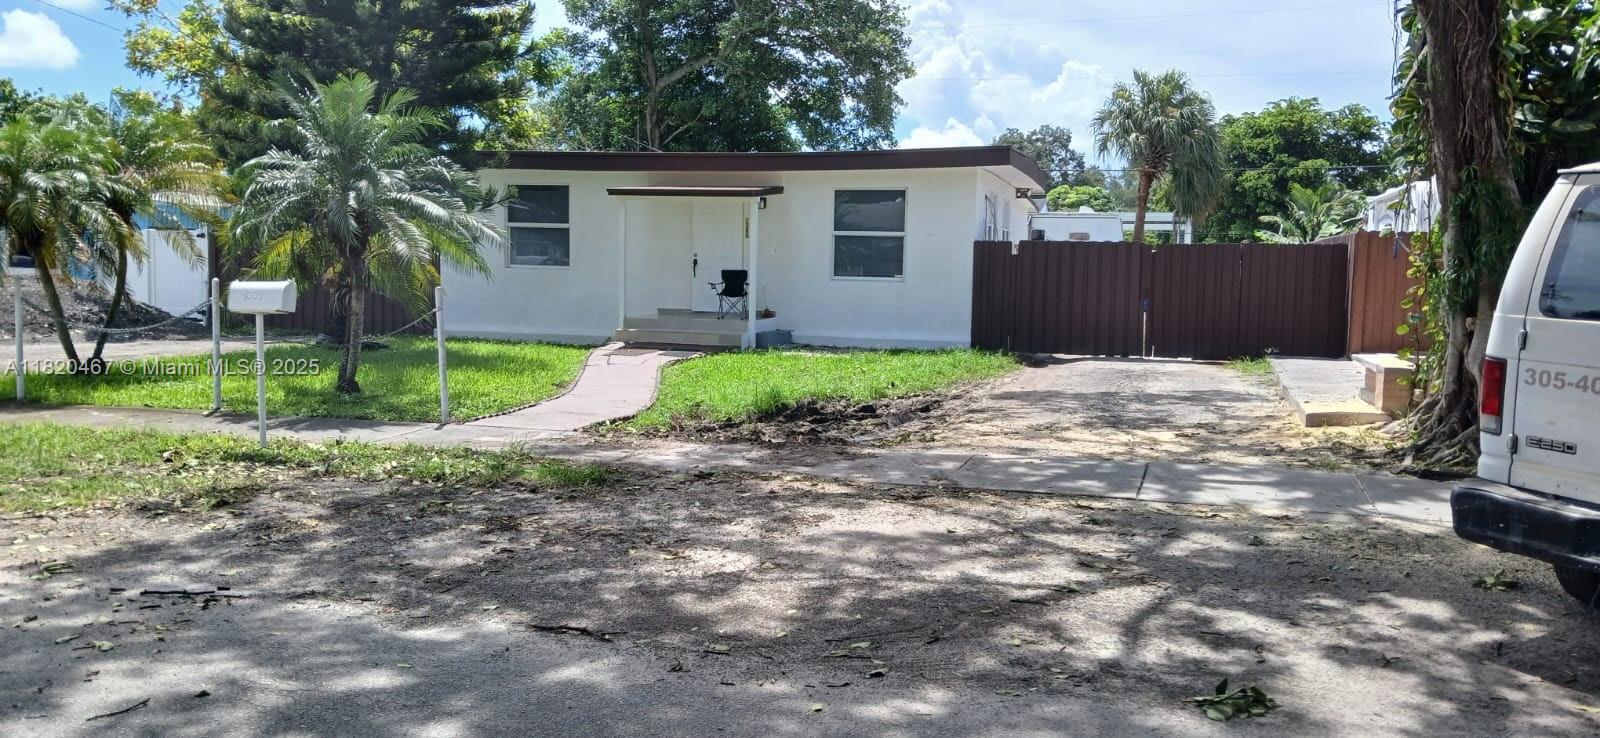
1847 NW 63rd St, Miami, FL 33147
$-465
Cash flow
-4.9%
Cash-on-Cash Return
5.2%
Cap rate
0.7%
Rent to Value Ratio

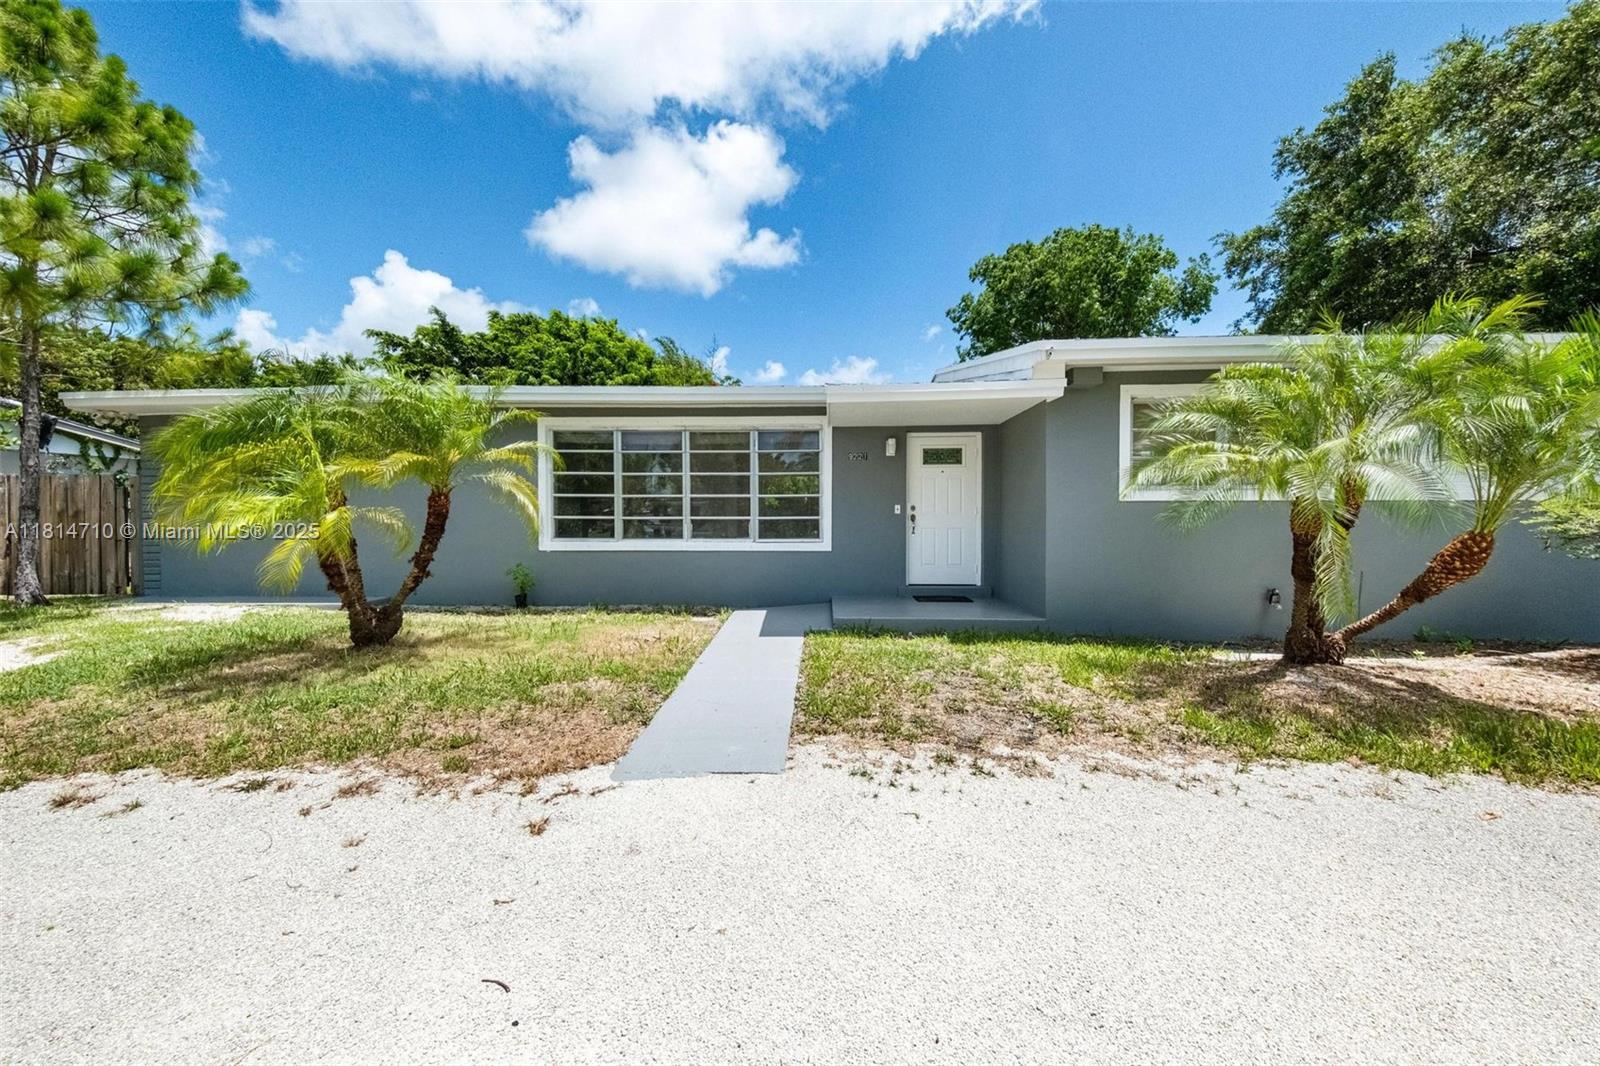
Active
$694,999
3
bds
|
2
ba
|
1,570
sqft
|
built
1953
7110 SW 13th Ter, Miami, FL 33144
$-1,365
Cash flow
-10.2%
Cash-on-Cash Return
3.9%
Cap rate
0.5%
Rent to Value Ratio
Active
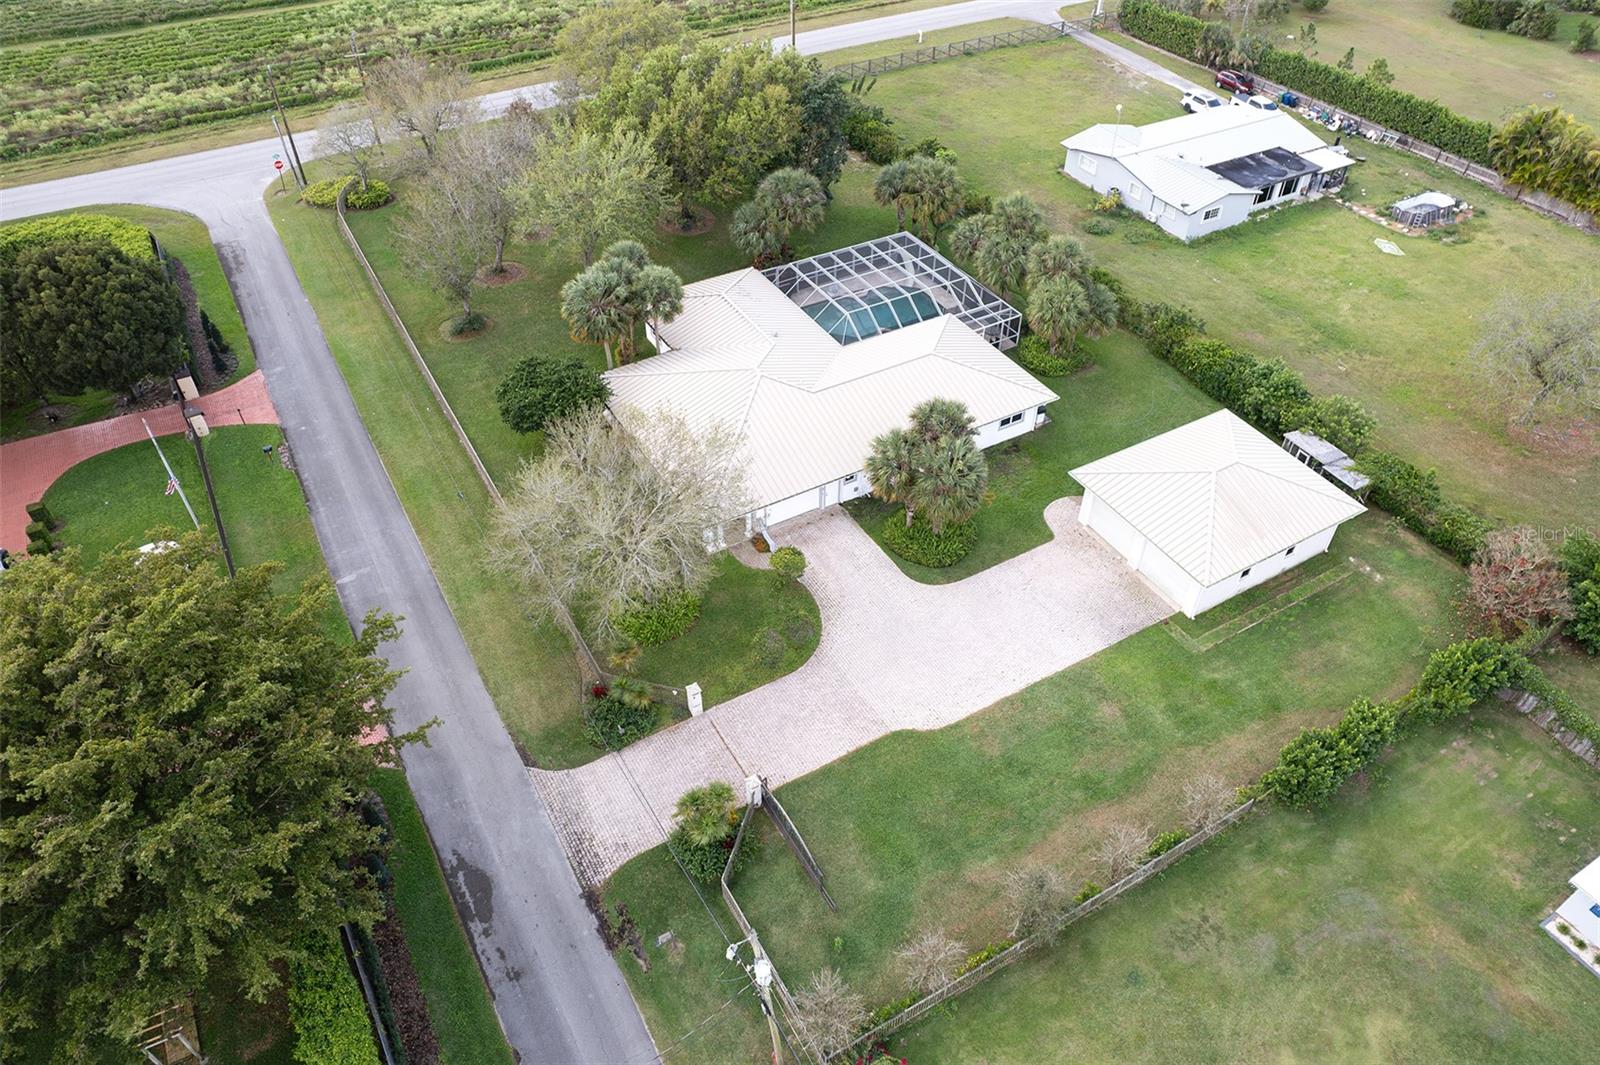
$699,000
3
bds
|
2
ba
|
1,532
sqft
|
built
1958
9221 SW 167th Ter, Palmetto Bay, FL 33157
$-1,861
Cash flow
-13.9%
Cash-on-Cash Return
3.1%
Cap rate
0.5%
Rent to Value Ratio
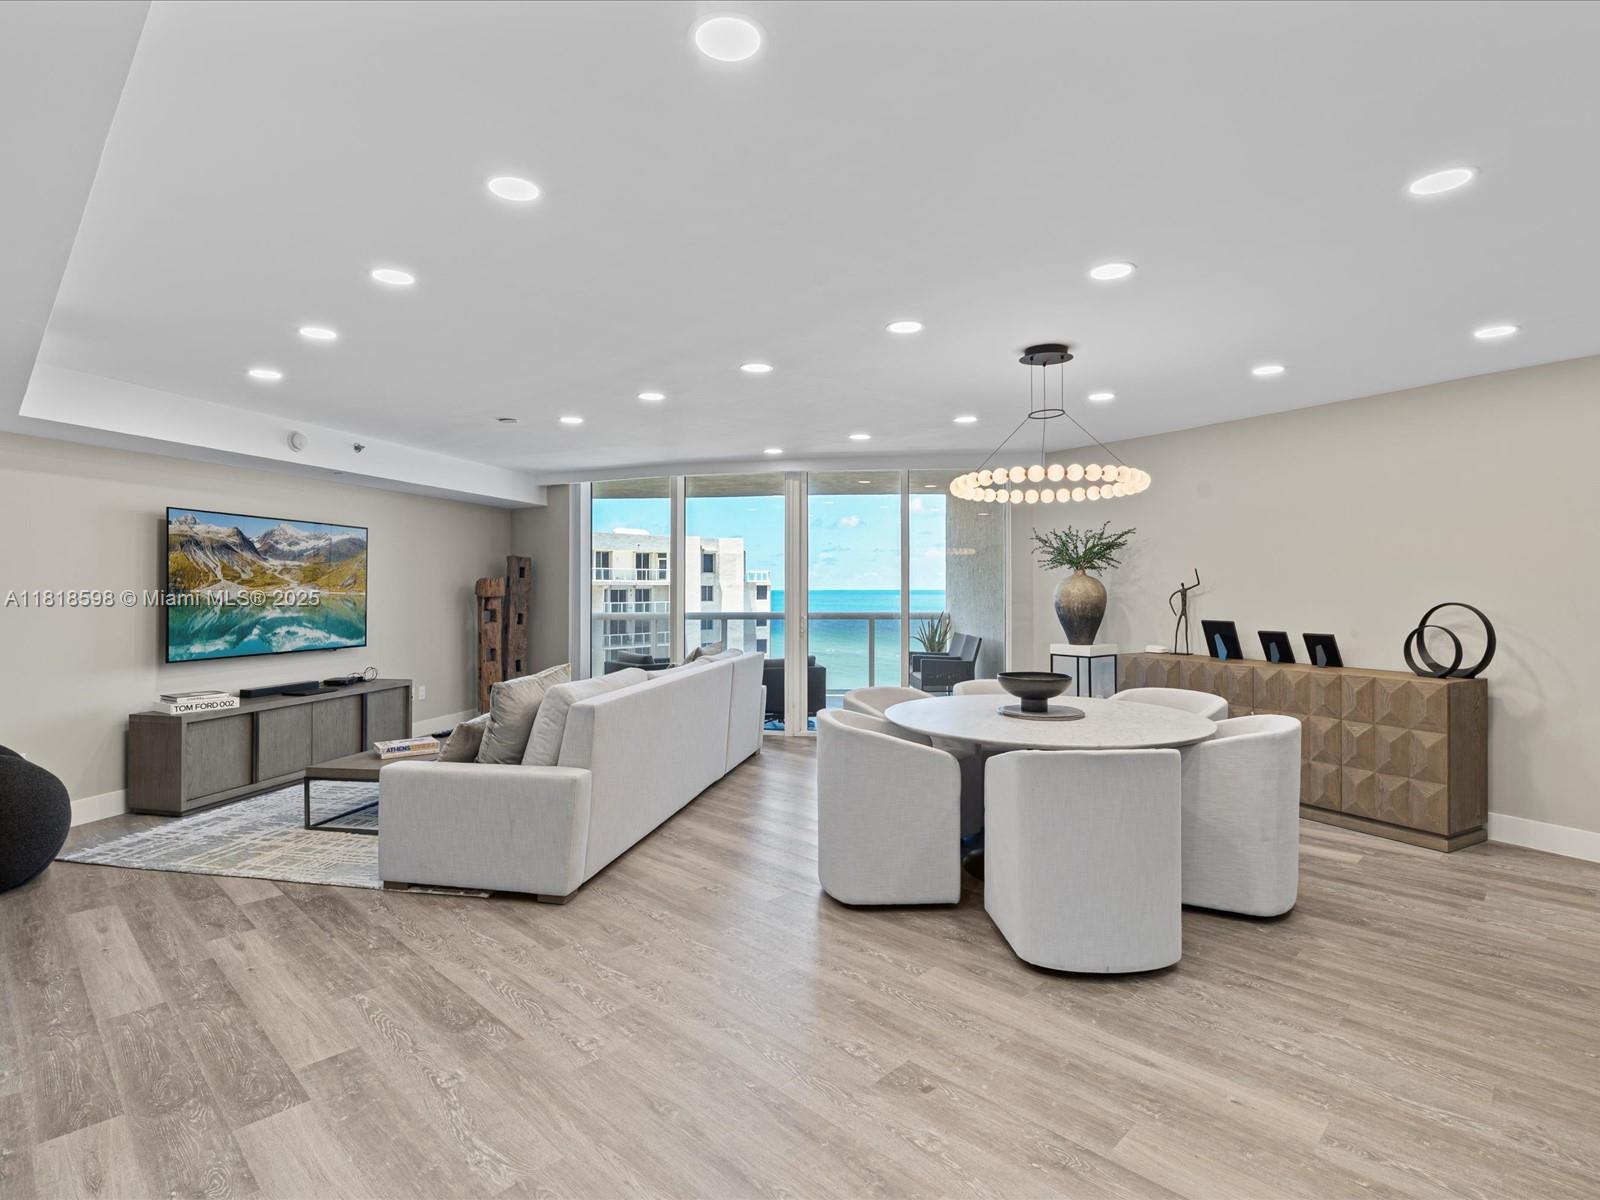
Active
$1,749,999
2
bds
|
3
ba
|
1,886
sqft
|
built
2006
17201 Collins Ave, Sunny Isles Beach, FL 33160
$-7,593
Cash flow
-22.6%
Cash-on-Cash Return
1.1%
Cap rate
0.4%
Rent to Value Ratio
Active
$8,200,000
7
bds
|
7
ba
|
6,318
sqft
|
built
1997
8941 SW 65th Ct, Pinecrest, FL 33156
$-42,224
Cash flow
-26.9%
Cash-on-Cash Return
0.1%
Cap rate
0.1%
Rent to Value Ratio

Active
$508,000
2
bds
|
2
ba
|
950
sqft
|
built
2016
5252 NW 85th Ave, Doral, FL 33166
$-2,266
Cash flow
-23.3%
Cash-on-Cash Return
0.9%
Cap rate
0.6%
Rent to Value Ratio
Active
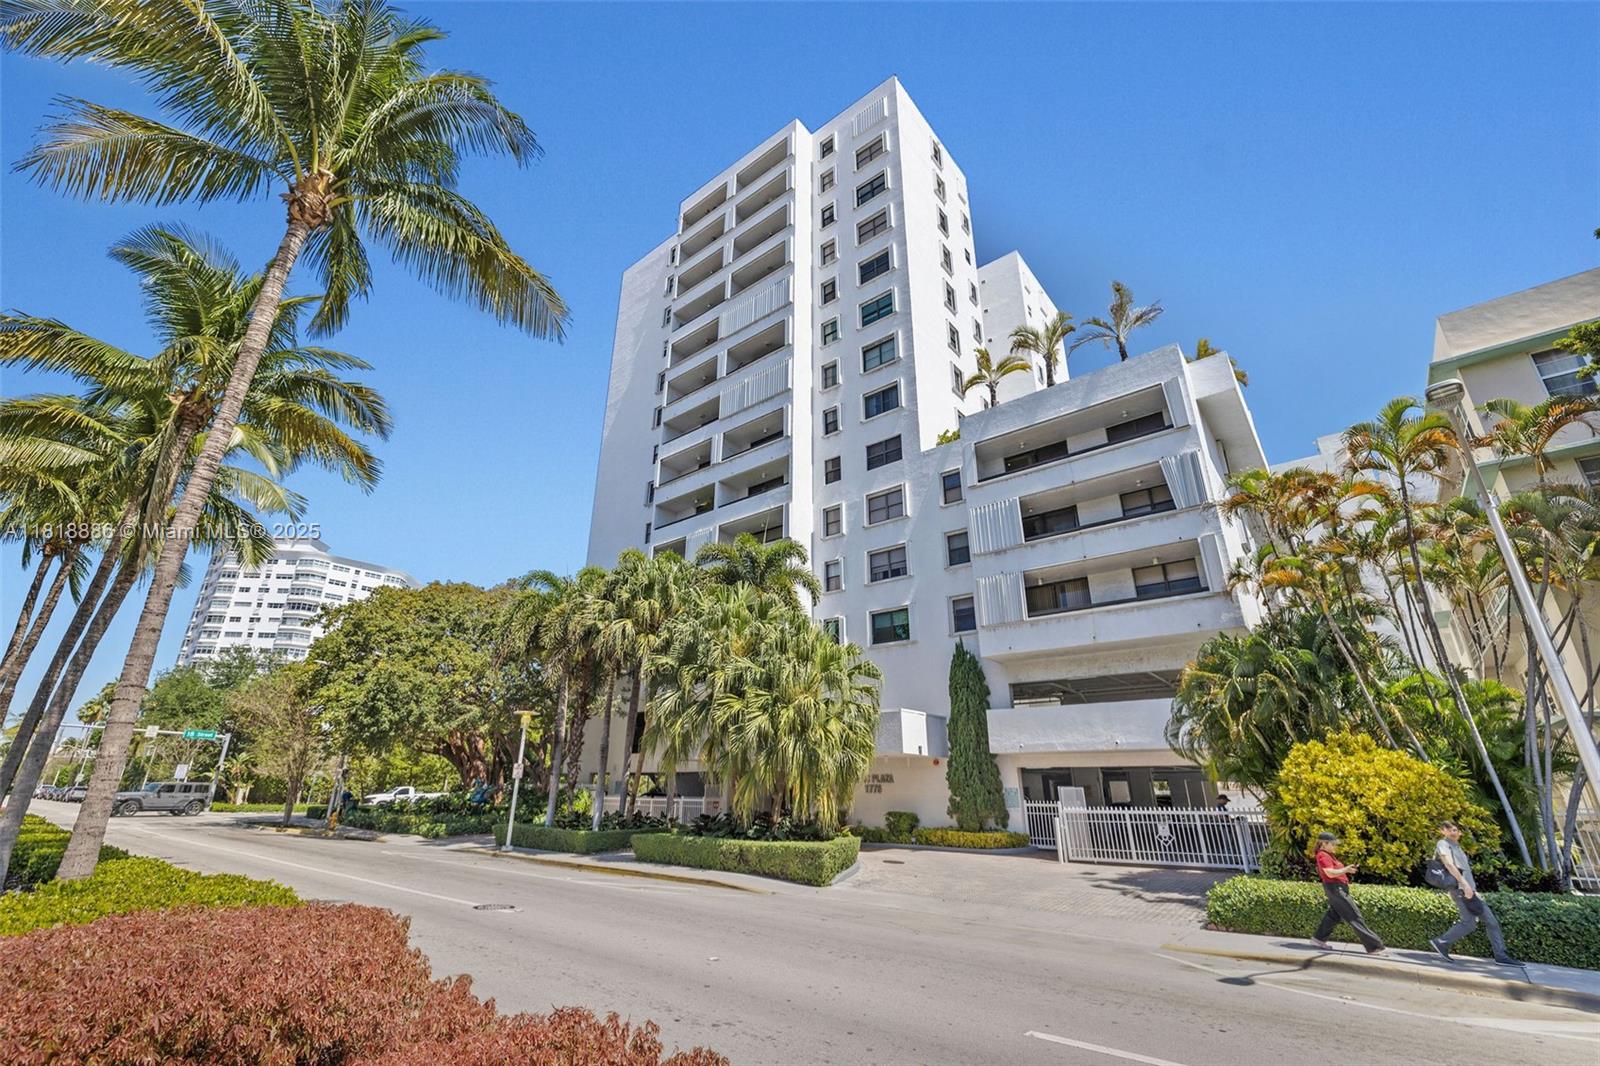
$499,995
2
bds
|
2
ba
|
1,010
sqft
|
built
1983
1775 Washington Ave, Miami Beach, FL 33139
$-1,854
Cash flow
-19.3%
Cash-on-Cash Return
1.8%
Cap rate
0.8%
Rent to Value Ratio
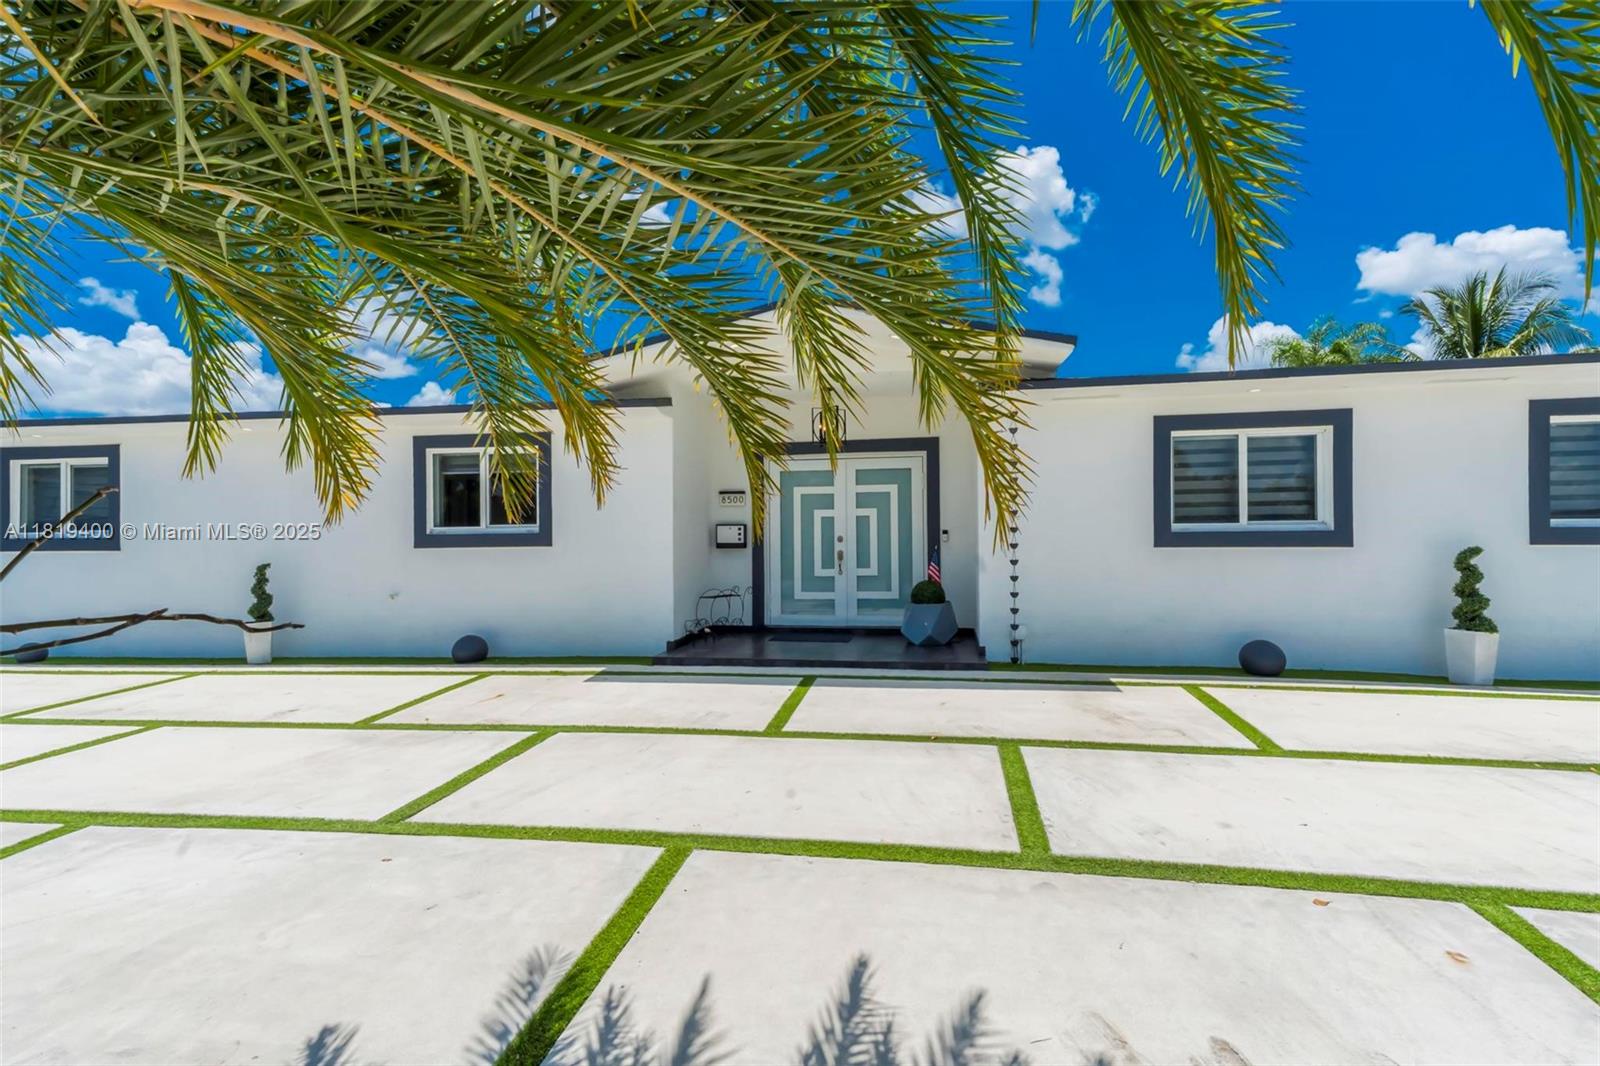
Pending
$1,325,000
5
bds
|
3
ba
|
2,937
sqft
|
built
1970
8500 NW 174th St, Hialeah, FL 33015
$-4,675
Cash flow
-18.4%
Cash-on-Cash Return
2.1%
Cap rate
0.4%
Rent to Value Ratio
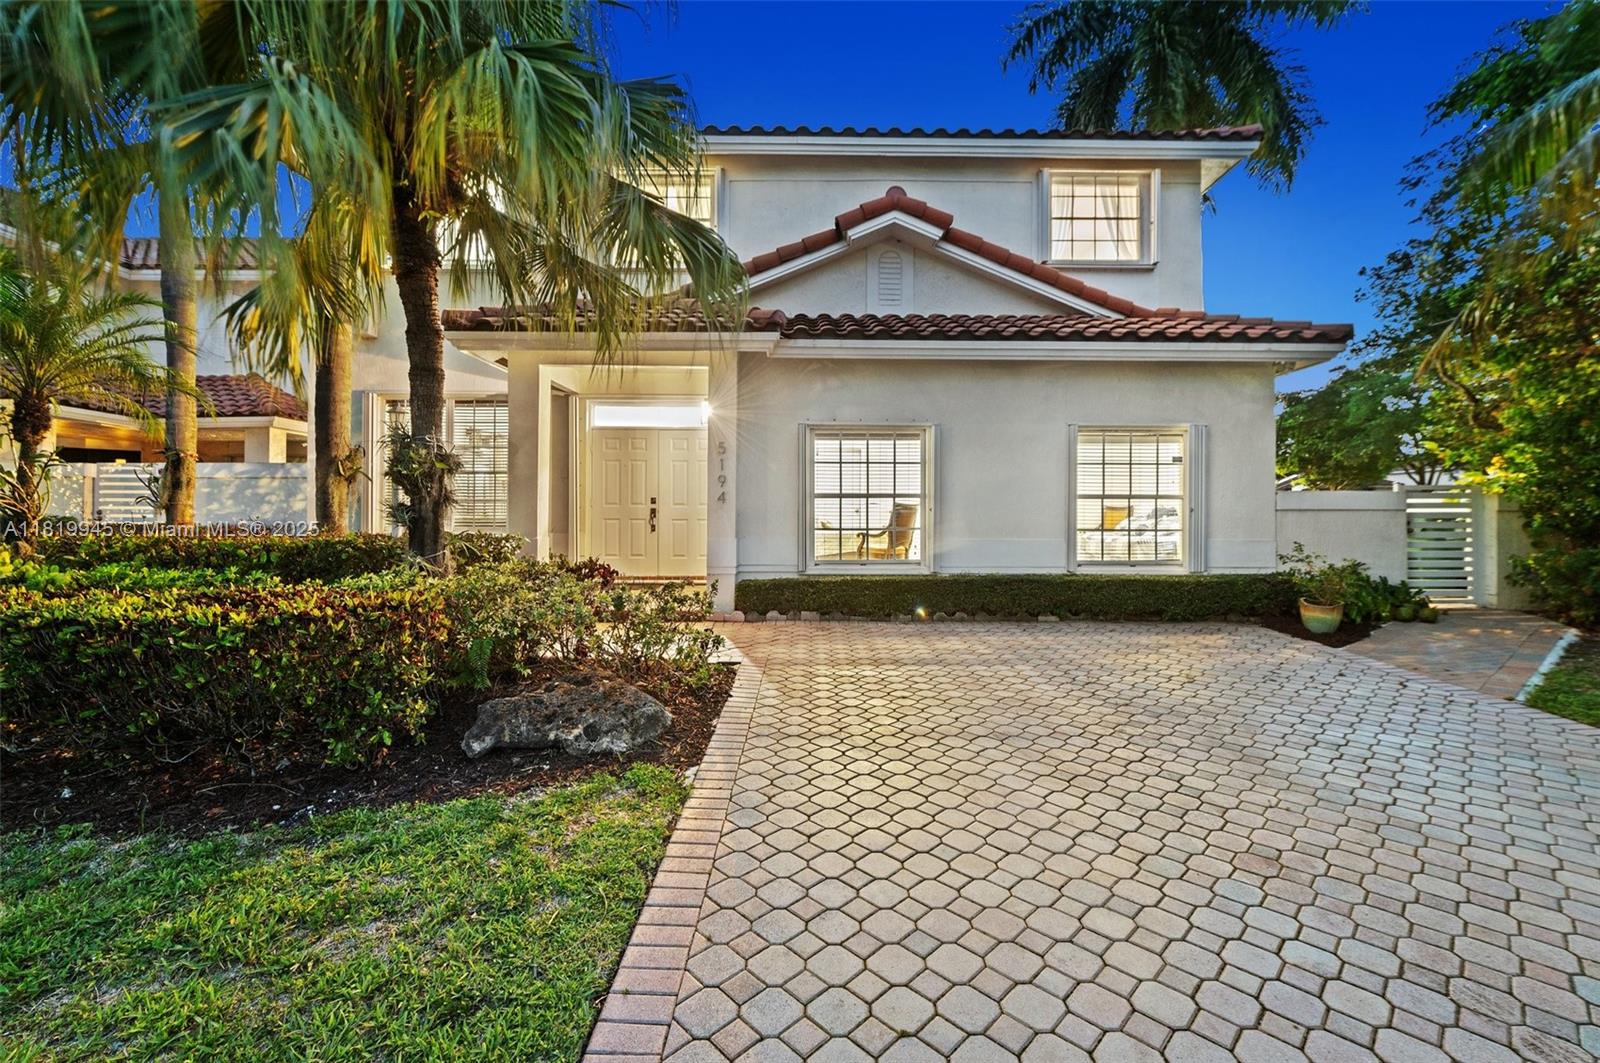
Active
$1,375,000
6
bds
|
5
ba
|
3,305
sqft
|
built
1994
5194 NW 106th Ave, Doral, FL 33178
$-4,770
Cash flow
-18.1%
Cash-on-Cash Return
2.1%
Cap rate
0.4%
Rent to Value Ratio
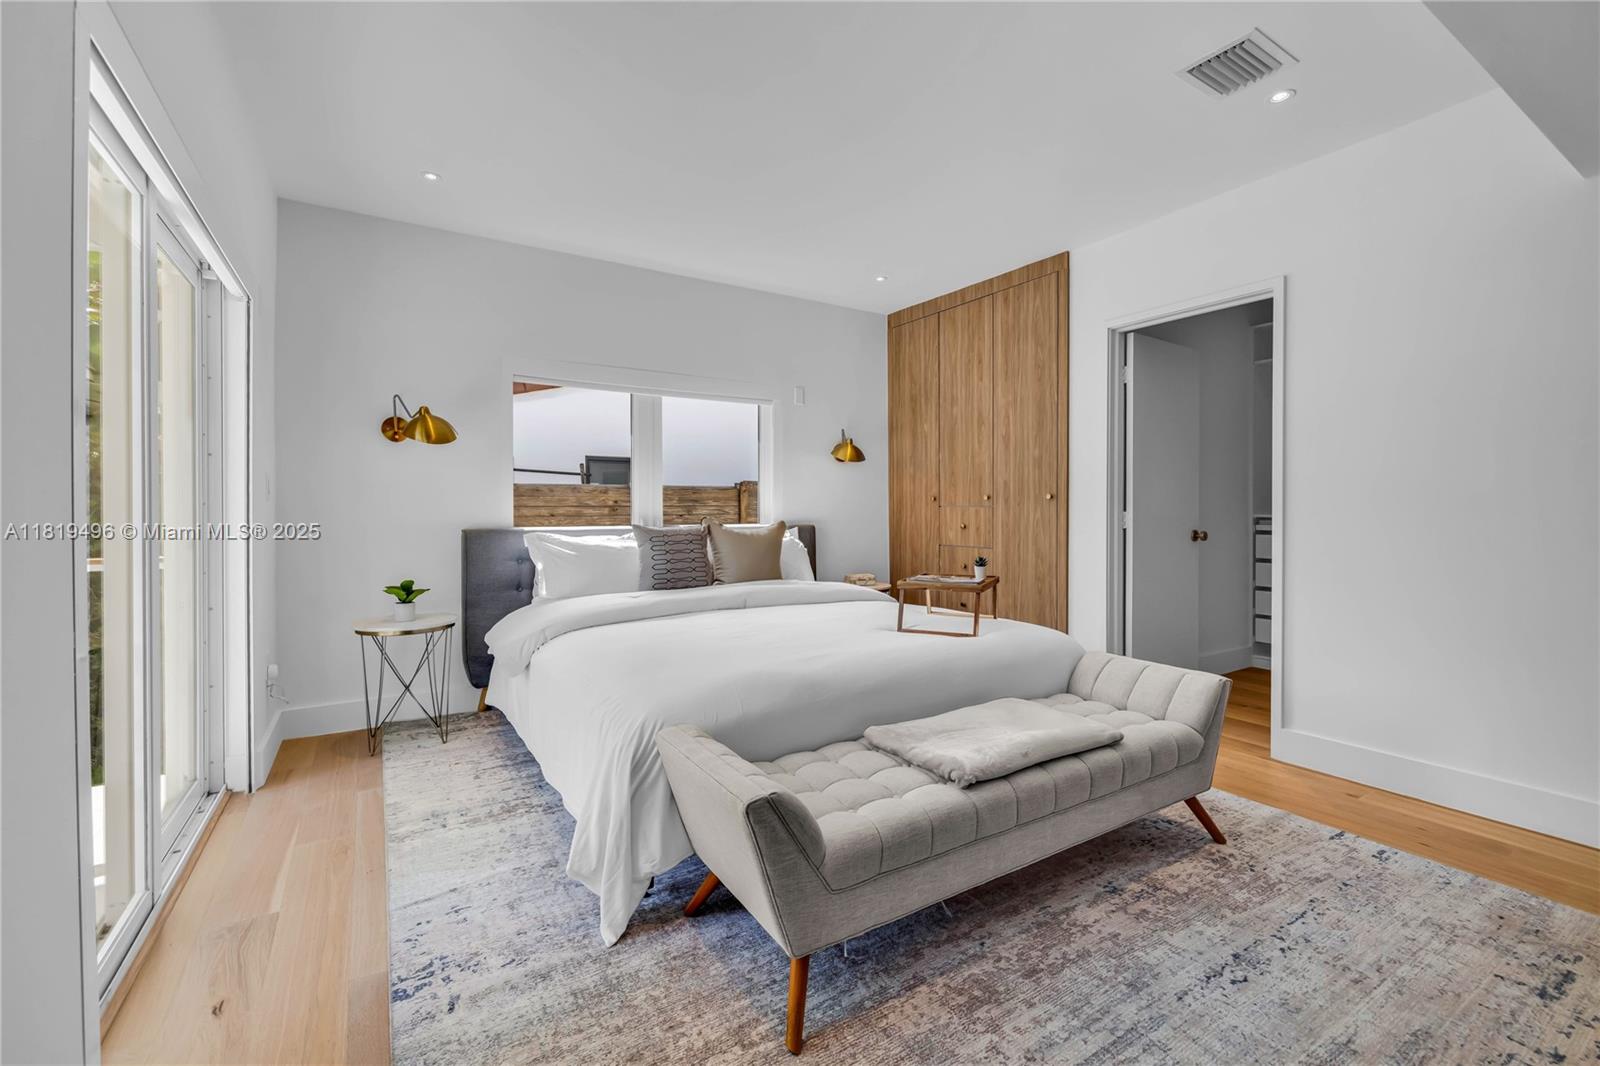
Pending
$1,750,000
3
bds
|
4
ba
|
1,928
sqft
|
built
1952
871 NE 71st St, Miami, FL 33138
$-4,078
Cash flow
-12.2%
Cash-on-Cash Return
3.5%
Cap rate
0.5%
Rent to Value Ratio
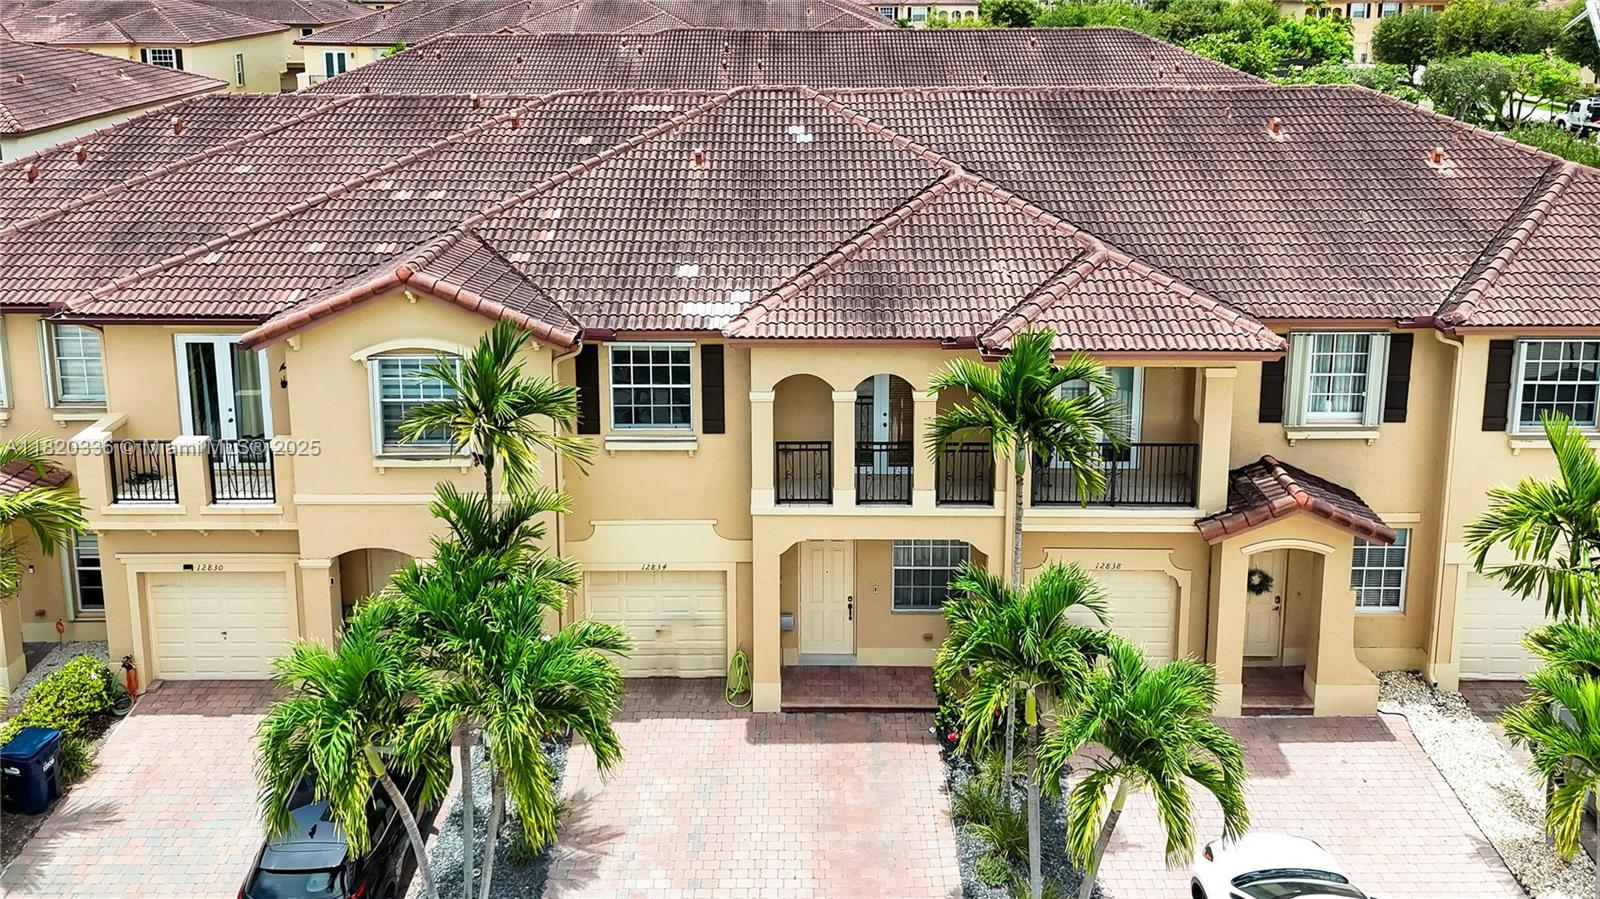
Active
$585,000
3
bds
|
3
ba
|
1,758
sqft
|
built
2005
12834 SW 134th St, Miami, FL 33186
$-1,467
Cash flow
-13.1%
Cash-on-Cash Return
3.3%
Cap rate
0.5%
Rent to Value Ratio
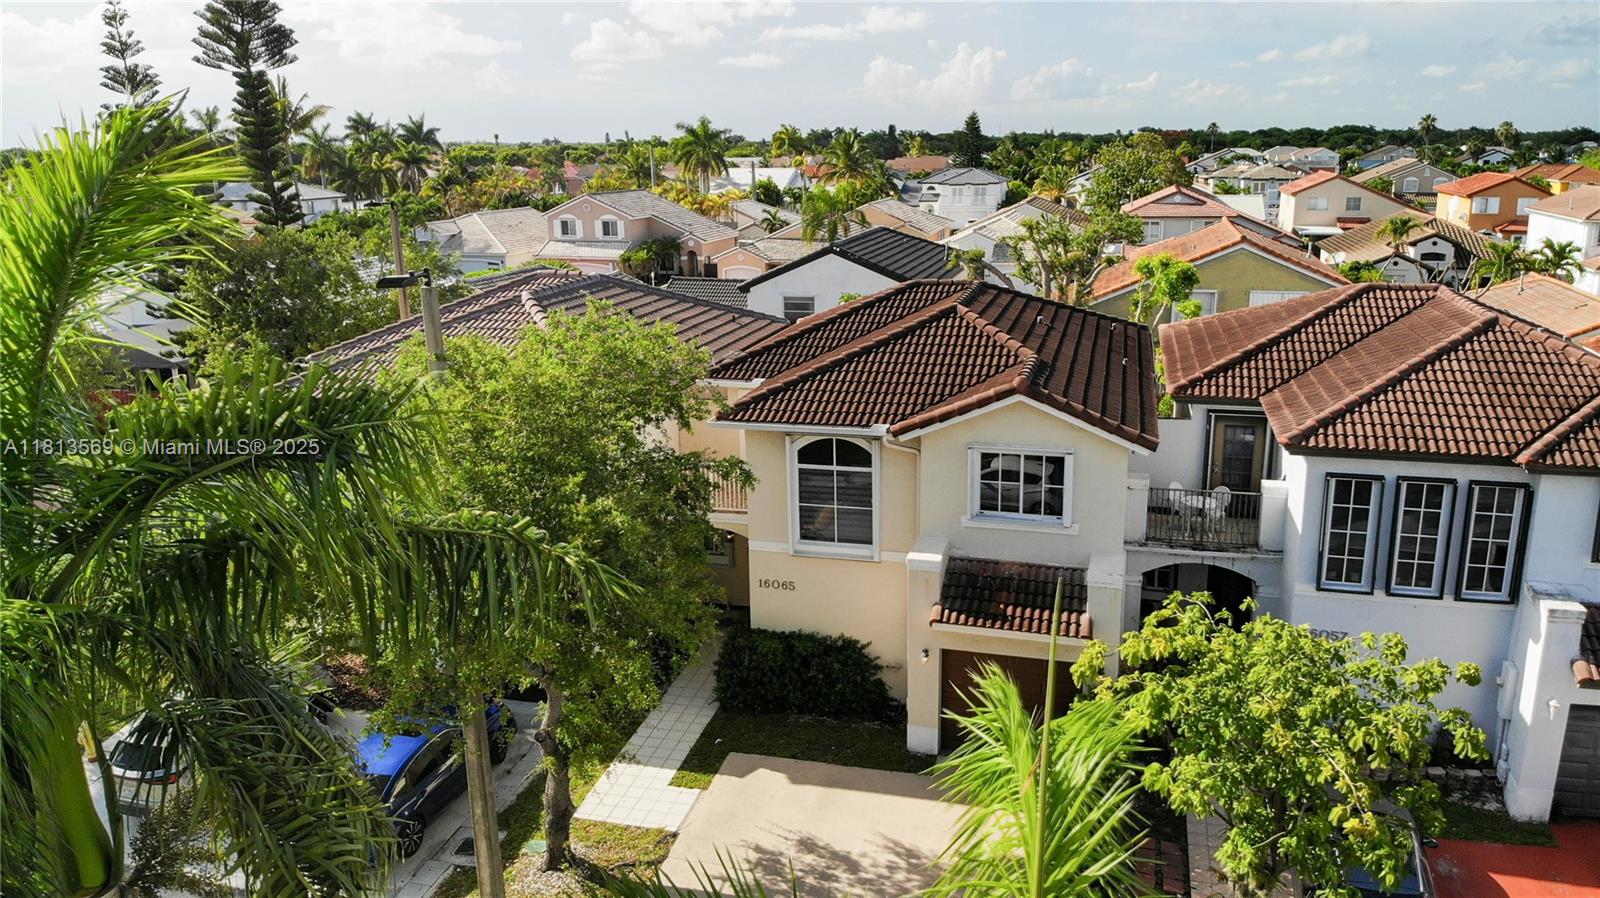
Active
$519,995
3
bds
|
2
ba
|
1,790
sqft
|
built
1997
16065 SW 86th Ln, Miami, FL 33193
$-945
Cash flow
-9.5%
Cash-on-Cash Return
4.1%
Cap rate
0.6%
Rent to Value Ratio
Active under contract
$260,000
2
bds
|
2
ba
|
1,000
sqft
|
built
1978
1789 W 57th St, Hialeah, FL 33012
$-282
Cash flow
-5.7%
Cash-on-Cash Return
5.0%
Cap rate
0.9%
Rent to Value Ratio
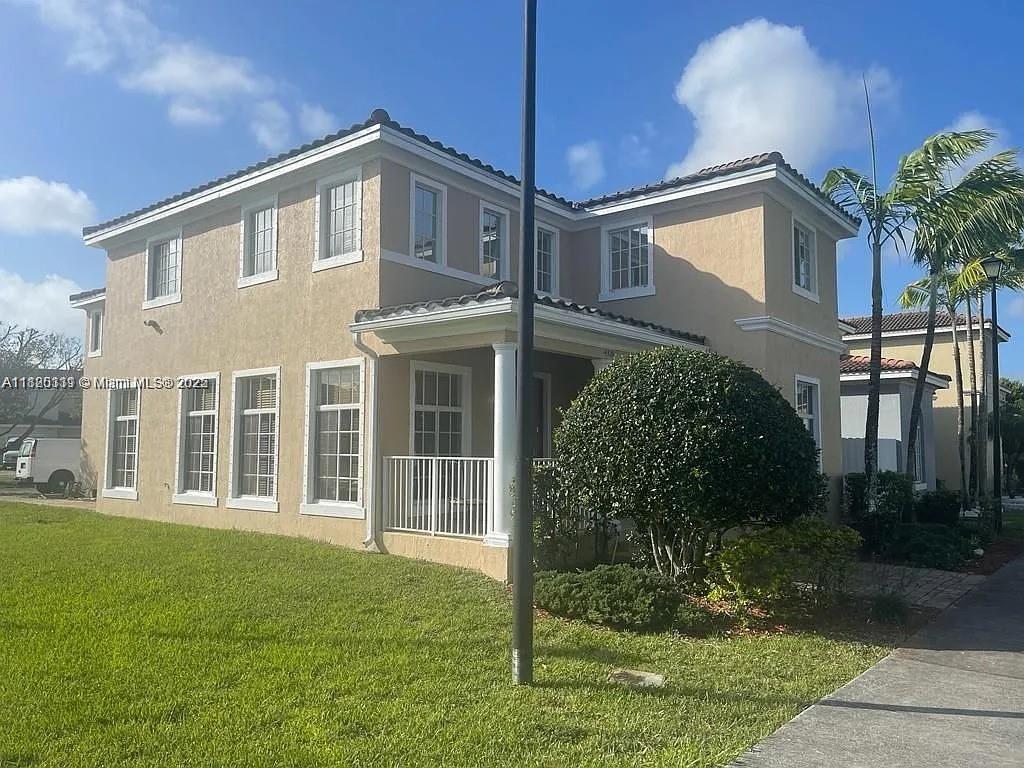
Active
$890,000
4
bds
|
3
ba
|
2,733
sqft
|
built
1981
12950 SW 149th St, Miami, FL 33186
$-1,613
Cash flow
-9.5%
Cash-on-Cash Return
4.1%
Cap rate
0.6%
Rent to Value Ratio
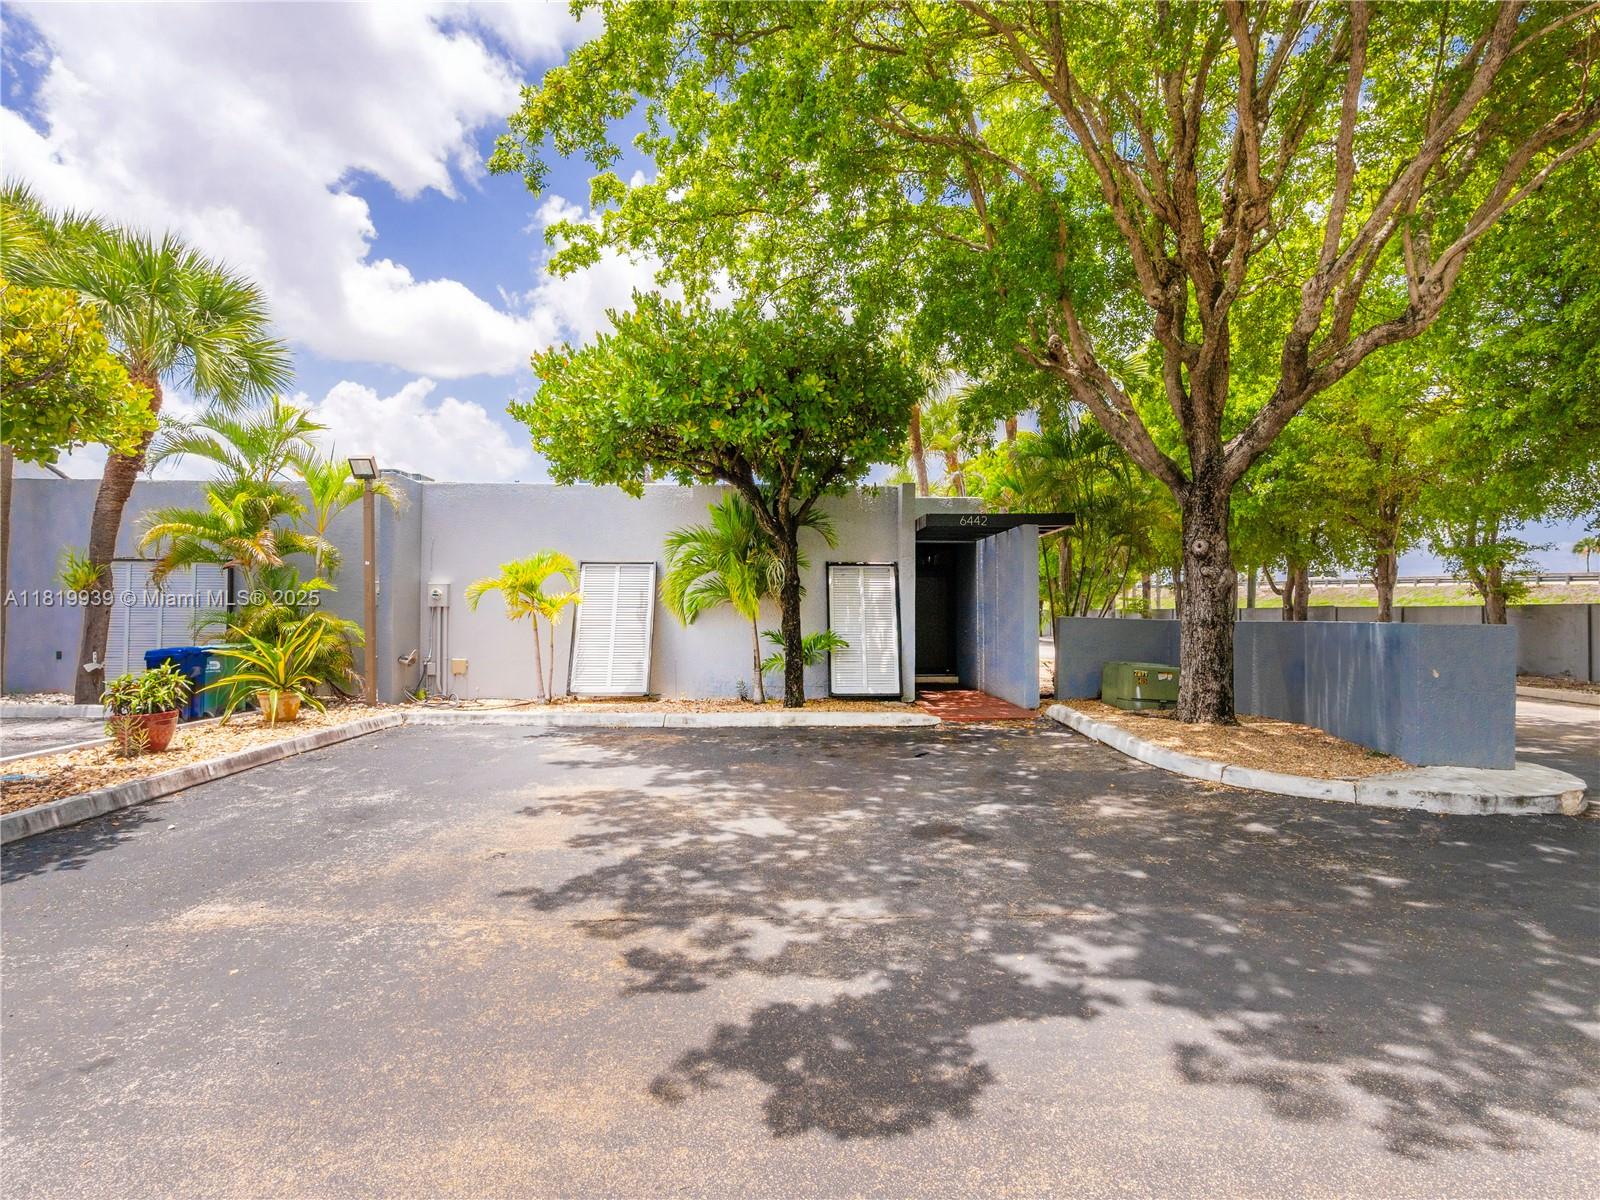
Active
$499,000
2
bds
|
2
ba
|
1,275
sqft
|
built
1977
6442 Milk Wagon Ln, Miami Lakes, FL 33014
$-1,381
Cash flow
-14.4%
Cash-on-Cash Return
3.0%
Cap rate
0.6%
Rent to Value Ratio
Active
$395,000
2
bds
|
1
ba
|
468
sqft
|
built
1948
1280 NW 100th Ter, Miami, FL 33147
$-909
Cash flow
-12.0%
Cash-on-Cash Return
3.5%
Cap rate
0.5%
Rent to Value Ratio
Active
$579,000
3
bds
|
3
ba
|
1,683
sqft
|
built
2006
10840 NW 79th St, Doral, FL 33178
$-1,662
Cash flow
-15.0%
Cash-on-Cash Return
2.8%
Cap rate
0.6%
Rent to Value Ratio
Active
$435,000
1
bds
|
2
ba
|
782
sqft
|
built
2008
60 SW 13th St, Miami, FL 33130
$-540
Cash flow
-6.5%
Cash-on-Cash Return
4.8%
Cap rate
0.8%
Rent to Value Ratio
Active
$950,000
1
bds
|
2
ba
|
1,260
sqft
|
built
1961
5055 Collins Ave, Miami Beach, FL 33140
$-4,393
Cash flow
-24.1%
Cash-on-Cash Return
0.7%
Cap rate
0.4%
Rent to Value Ratio
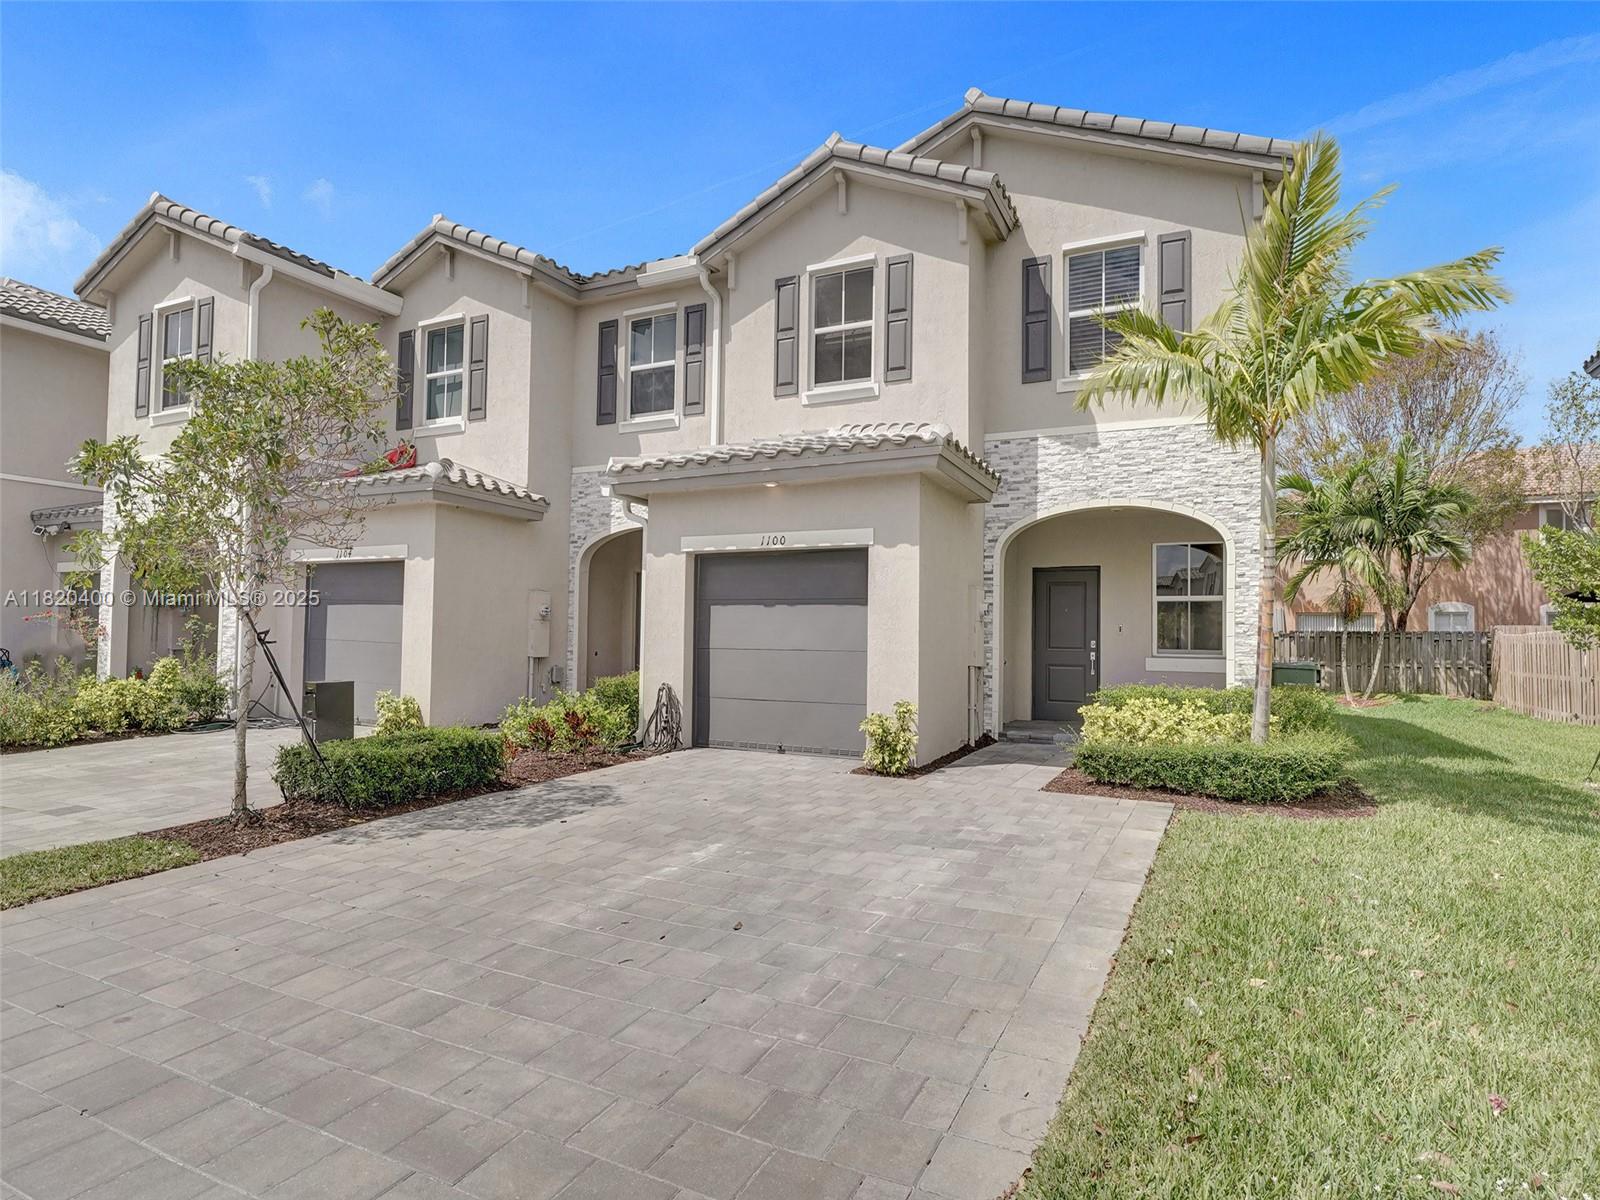
Active
$405,000
3
bds
|
3
ba
|
1,331
sqft
|
built
2022
1100 SE 26th Ter, Homestead, FL 33035
$-1,074
Cash flow
-13.8%
Cash-on-Cash Return
3.1%
Cap rate
0.7%
Rent to Value Ratio
Active
$530,000
6
bds
|
4
ba
|
2,627
sqft
|
built
2007
14318 SW 275th Ln, Homestead, FL 33032
$-998
Cash flow
-9.8%
Cash-on-Cash Return
4.0%
Cap rate
0.7%
Rent to Value Ratio
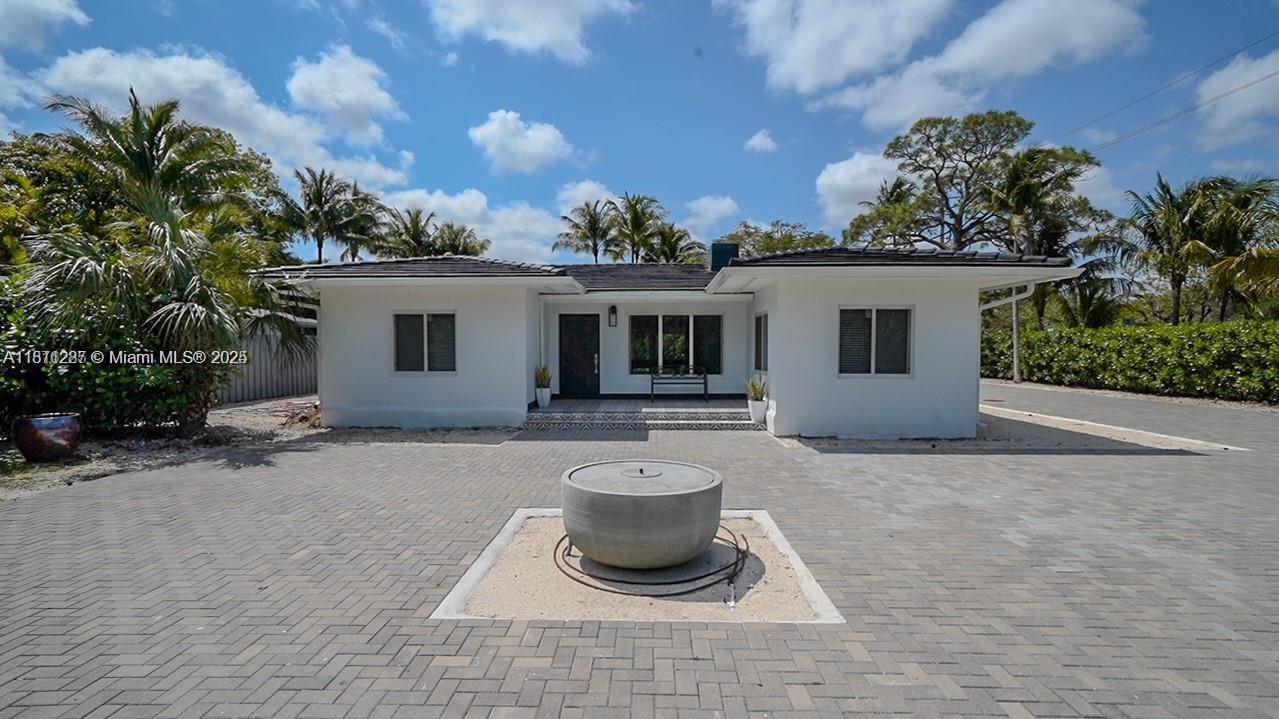
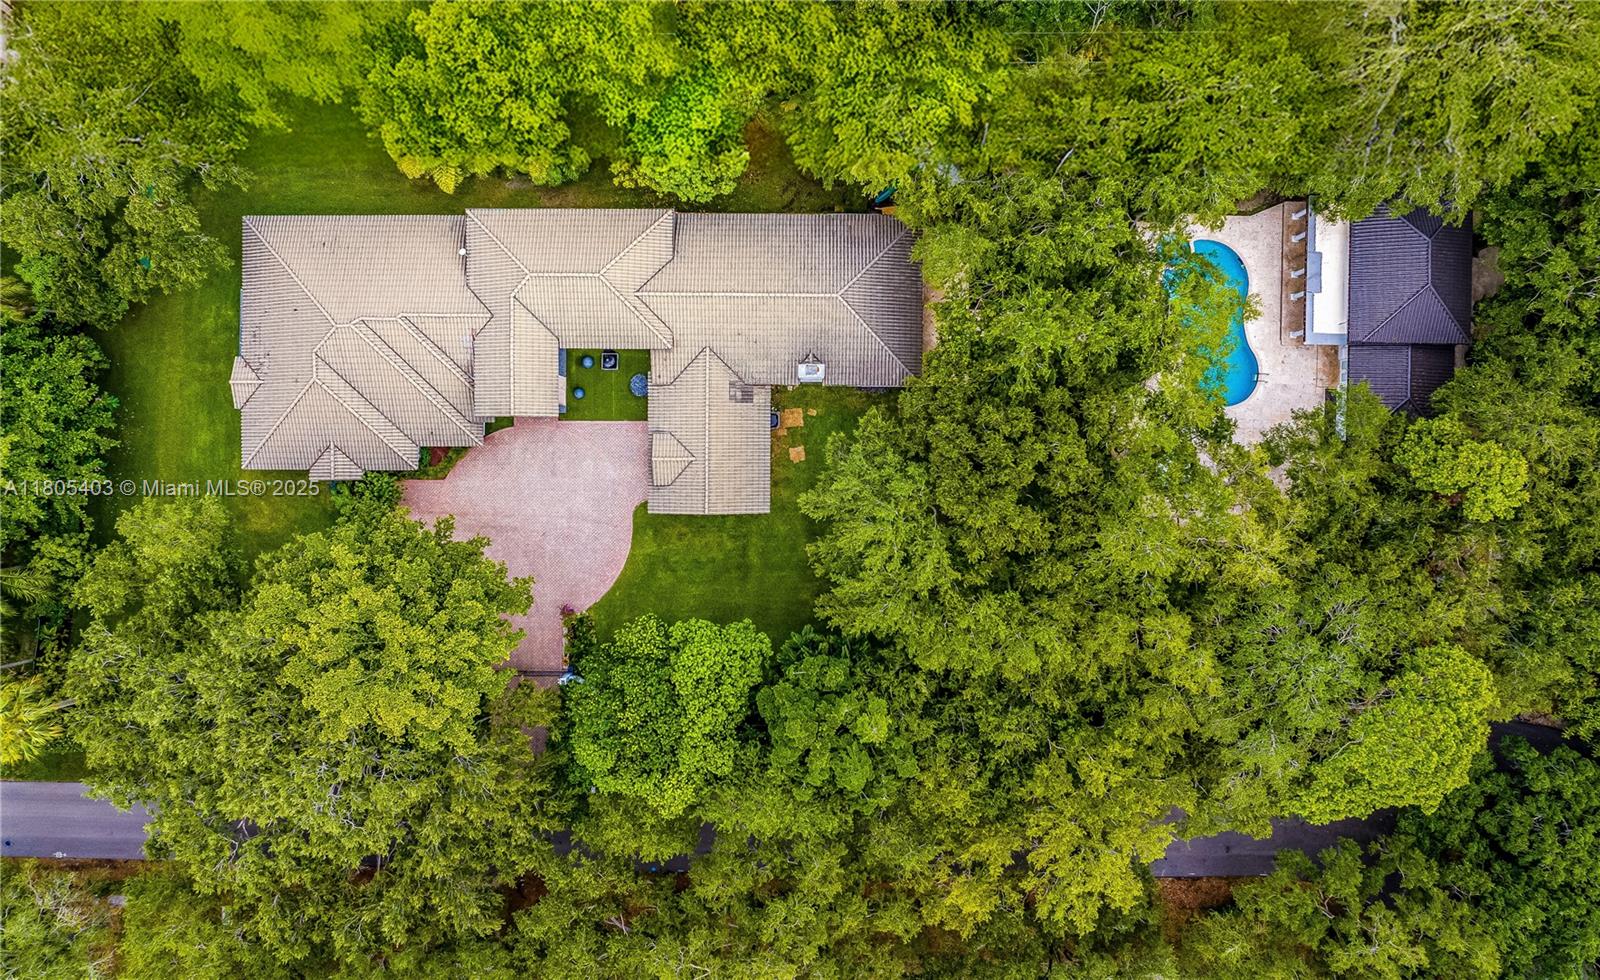
Active
$2,650,000
4
bds
|
3
ba
|
1,556
sqft
|
built
1948
8390 SW 64th St, Miami, FL 33143
$-9,122
Cash flow
-18.0%
Cash-on-Cash Return
2.2%
Cap rate
0.3%
Rent to Value Ratio
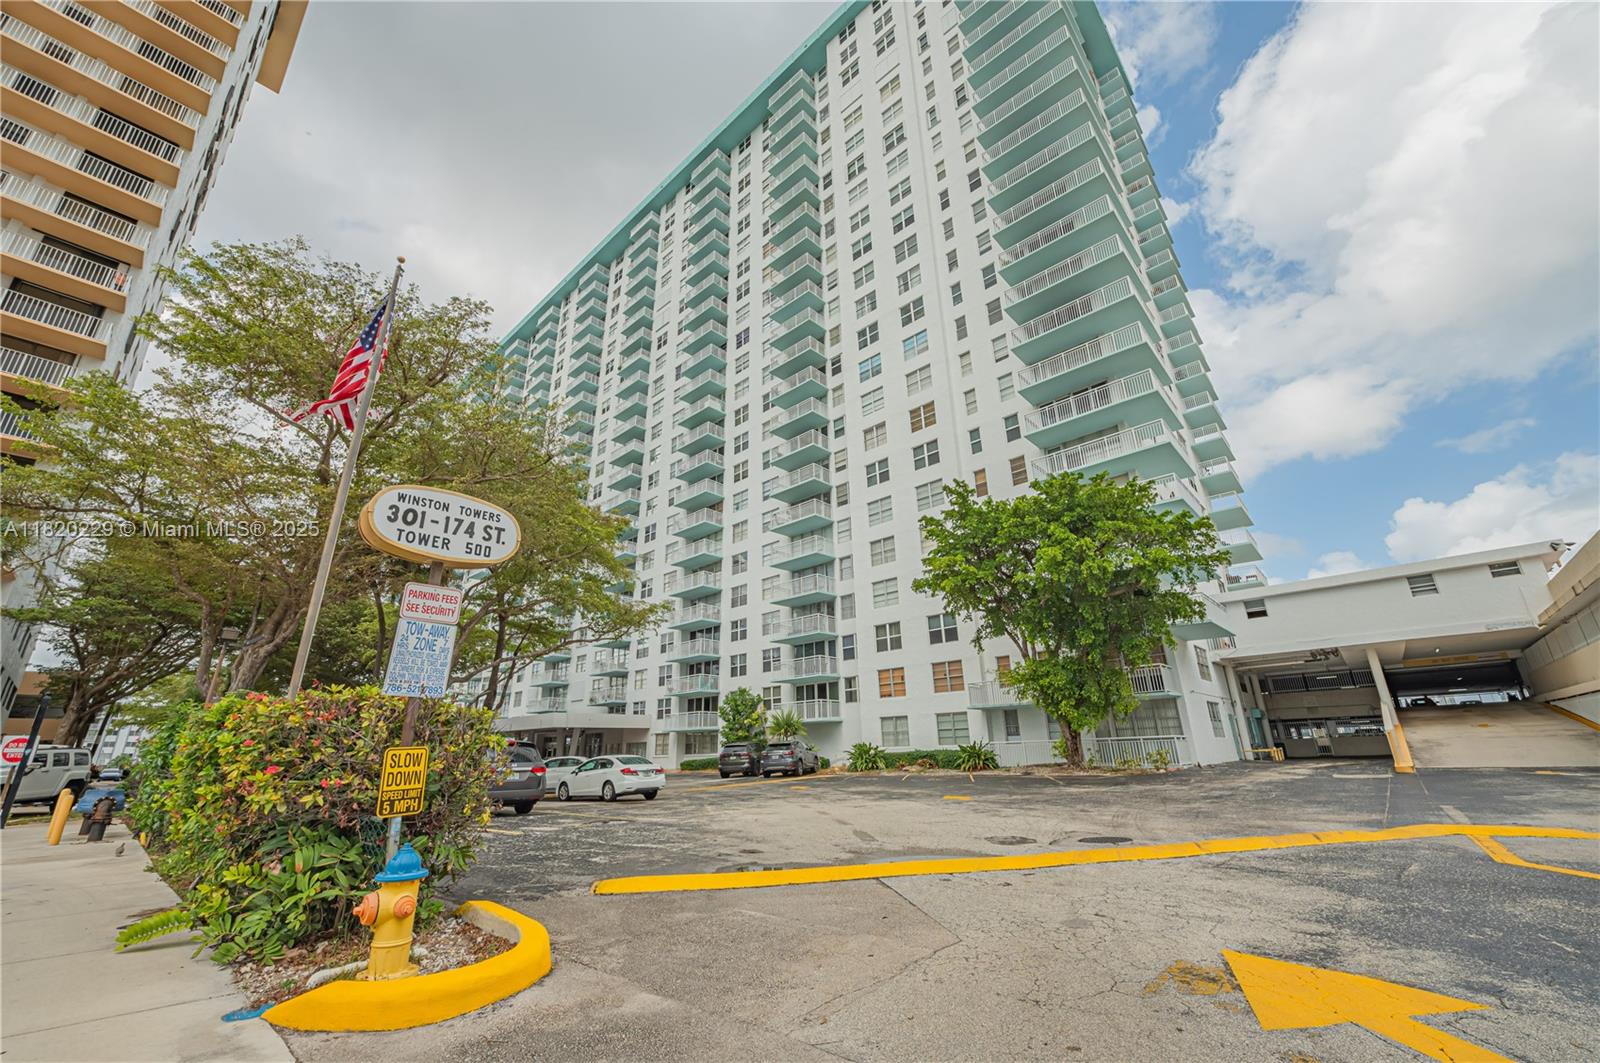
Active
$459,000
2
bds
|
2
ba
|
1,488
sqft
|
built
1976
301 174th St, Sunny Isles Beach, FL 33160
$-899
Cash flow
-10.2%
Cash-on-Cash Return
3.9%
Cap rate
0.7%
Rent to Value Ratio
Active
$399,000
2
bds
|
2
ba
|
1,214
sqft
|
built
2007
7280 SW 89th St, Miami, FL 33156
$-1,671
Cash flow
-21.9%
Cash-on-Cash Return
1.3%
Cap rate
0.7%
Rent to Value Ratio