Miami Dade County Investment Properties for Sale
Browse homes for sale and investment properties in Miami Dade County. Refine your search by price, property type, or more.
Best cash flowing properties in Miami Dade County
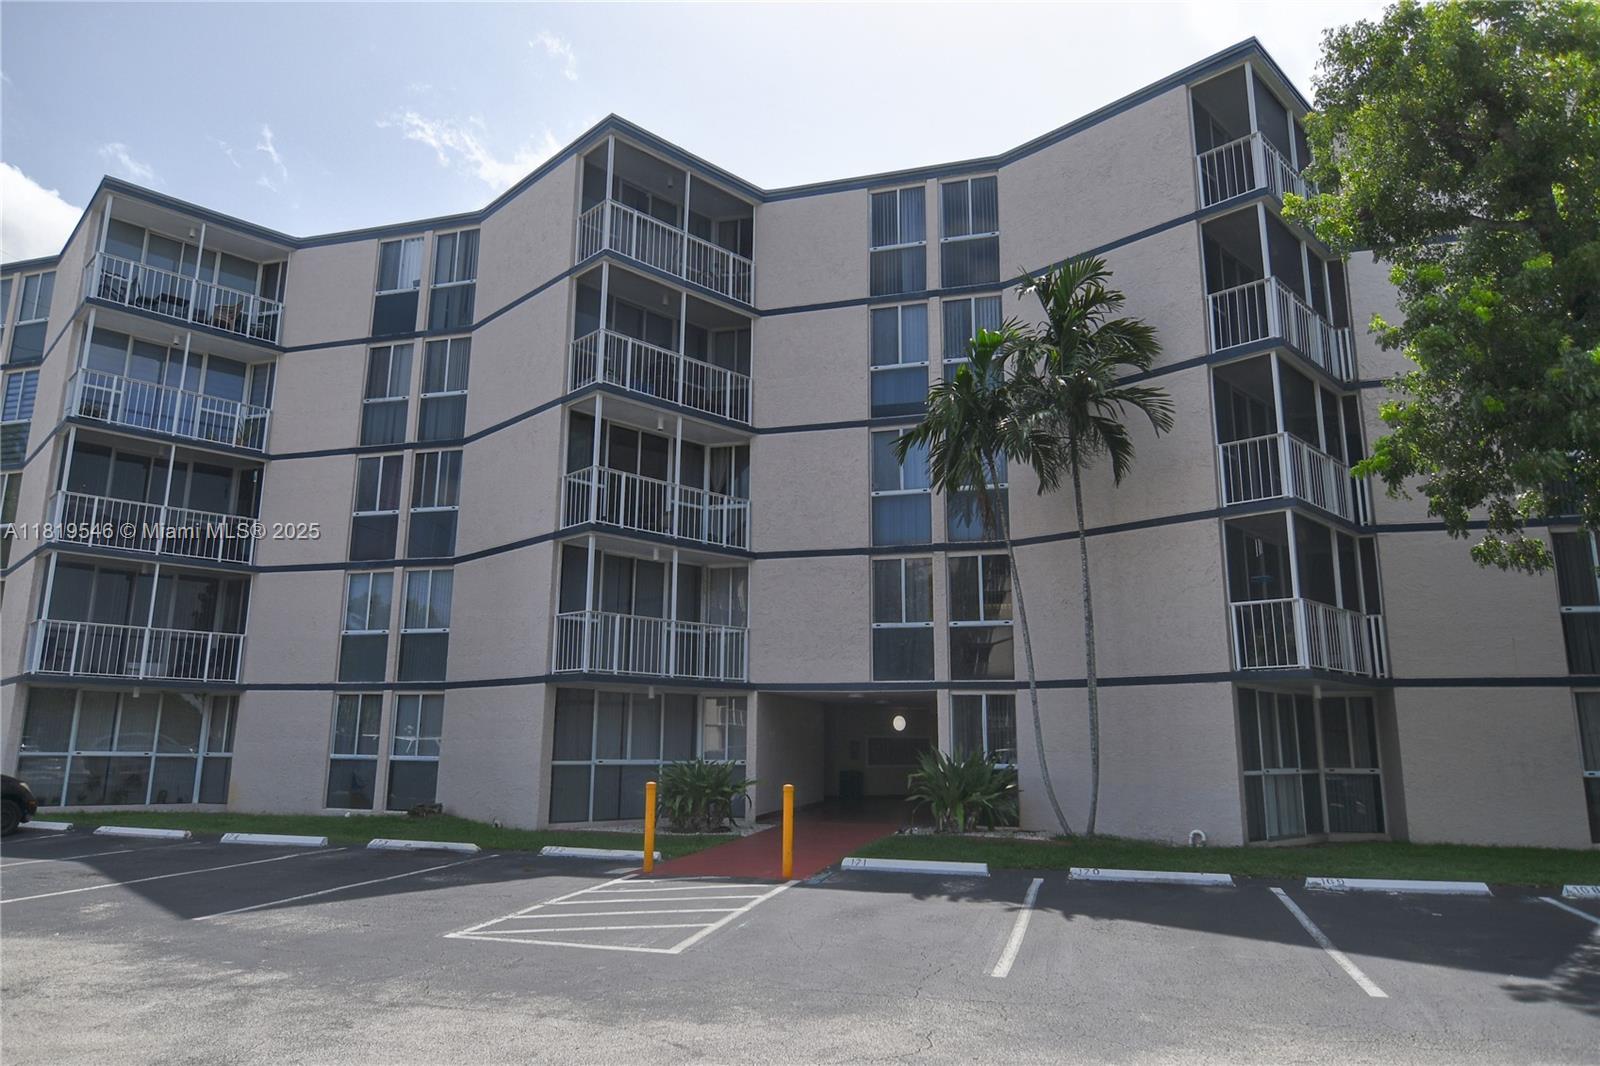
Active
$245,000
2
bds
|
2
ba
|
908
sqft
|
built
1986
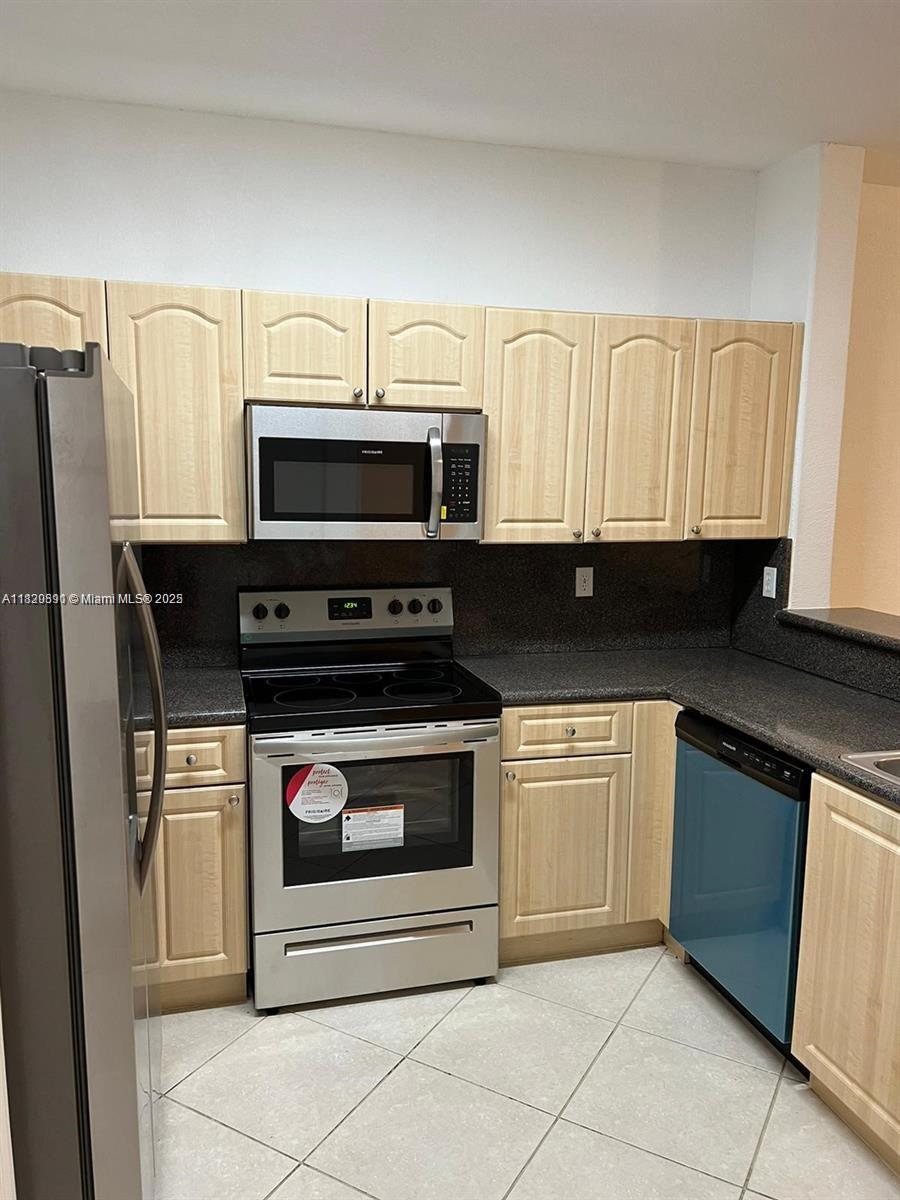
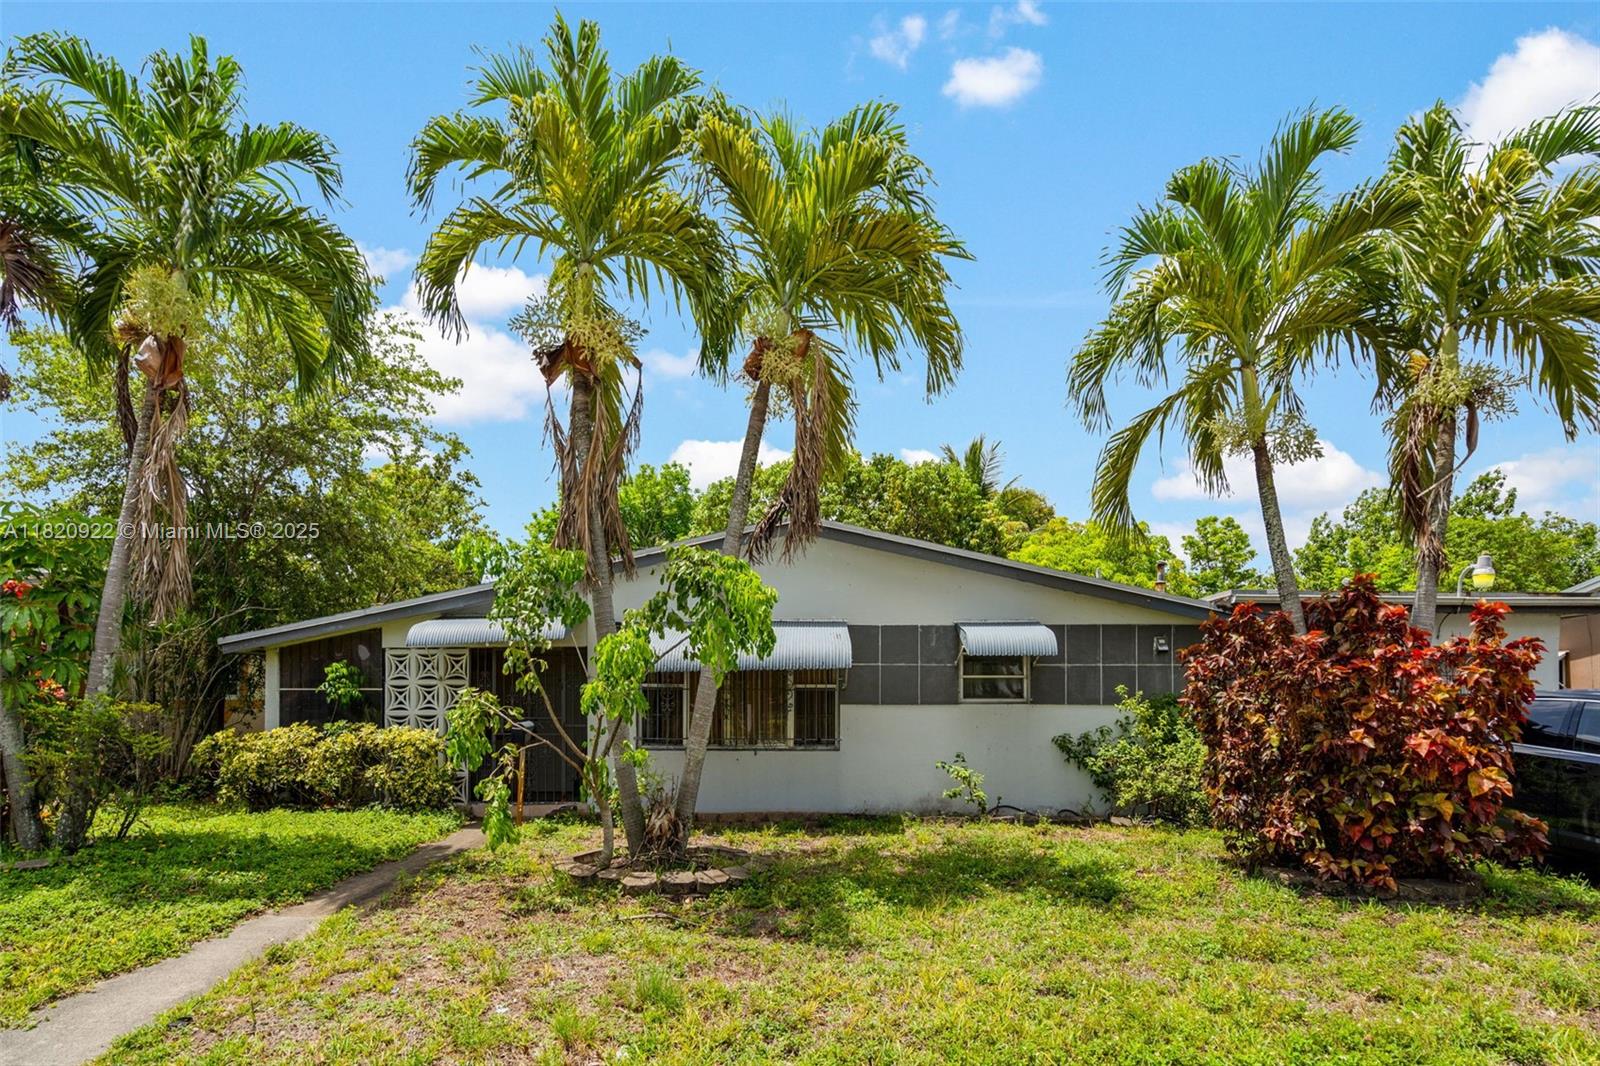
7125 NW 186th St, Hialeah, FL 33015
$-171
Cash flow
-3.6%
Cash-on-Cash Return
5.3%
Cap rate
0.9%
Rent to Value Ratio
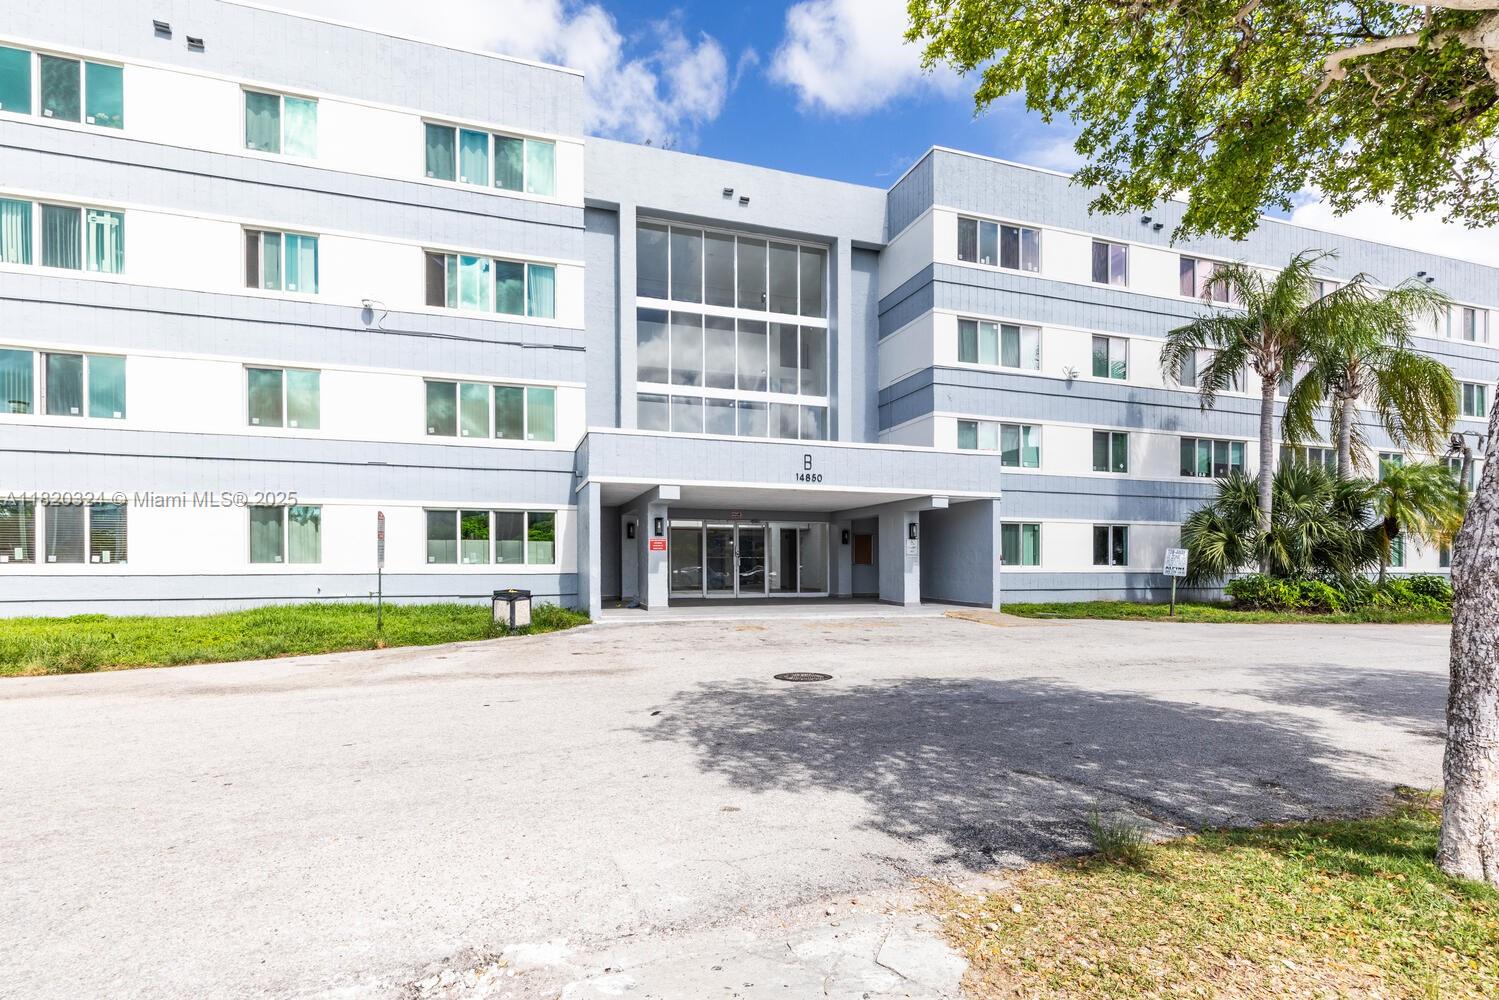
Active
$169,999
2
bds
|
2
ba
|
1,075
sqft
|
built
1974
14850 Naranja Lakes Blvd, Homestead, FL 33032
$-181
Cash flow
-5.6%
Cash-on-Cash Return
4.9%
Cap rate
1.2%
Rent to Value Ratio
10,000 out of 16,821 properties for sale in Miami Dade County
Limited Results Shown
Create a free account, or log in to reveal all property listings and enjoy the complete experience.

Active
$1,320,000
2
bds
|
2
ba
|
1,347
sqft
|
built
2009
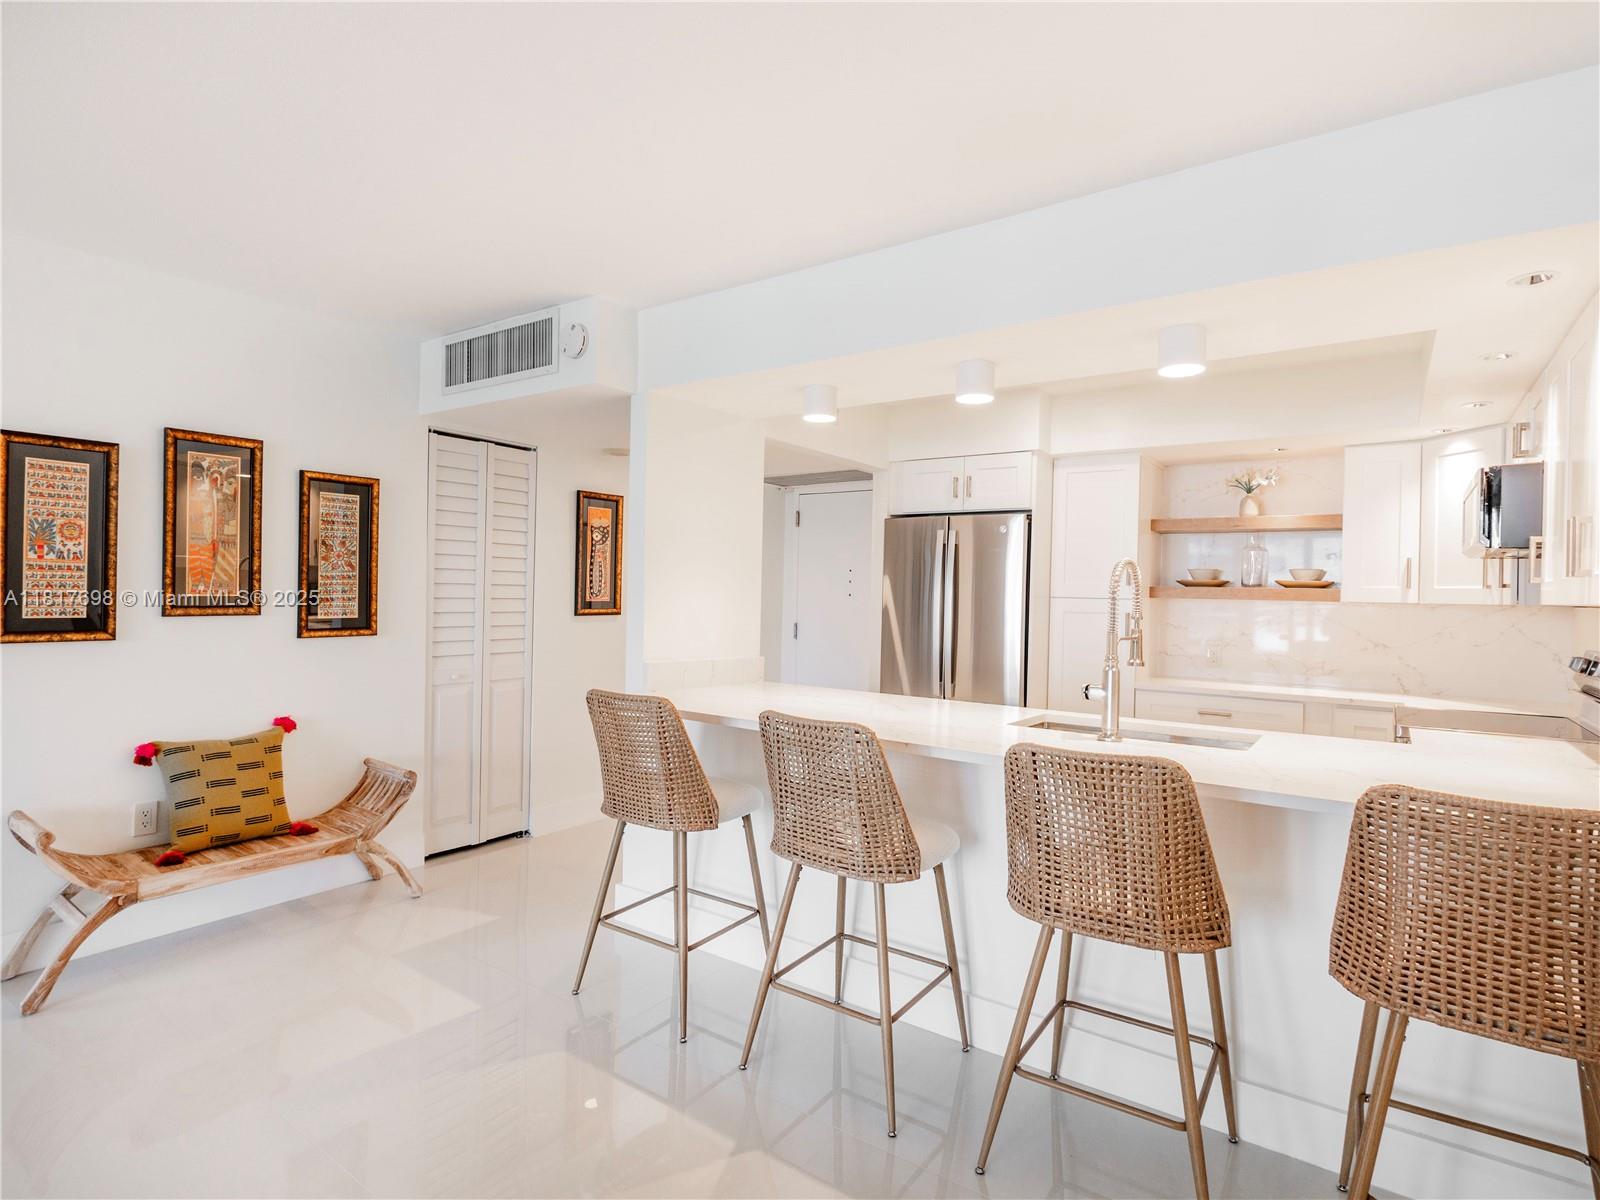
485 Brickell Ave, Miami, FL 33131
$-5,435
Cash flow
-21.5%
Cash-on-Cash Return
1.2%
Cap rate
0.5%
Rent to Value Ratio
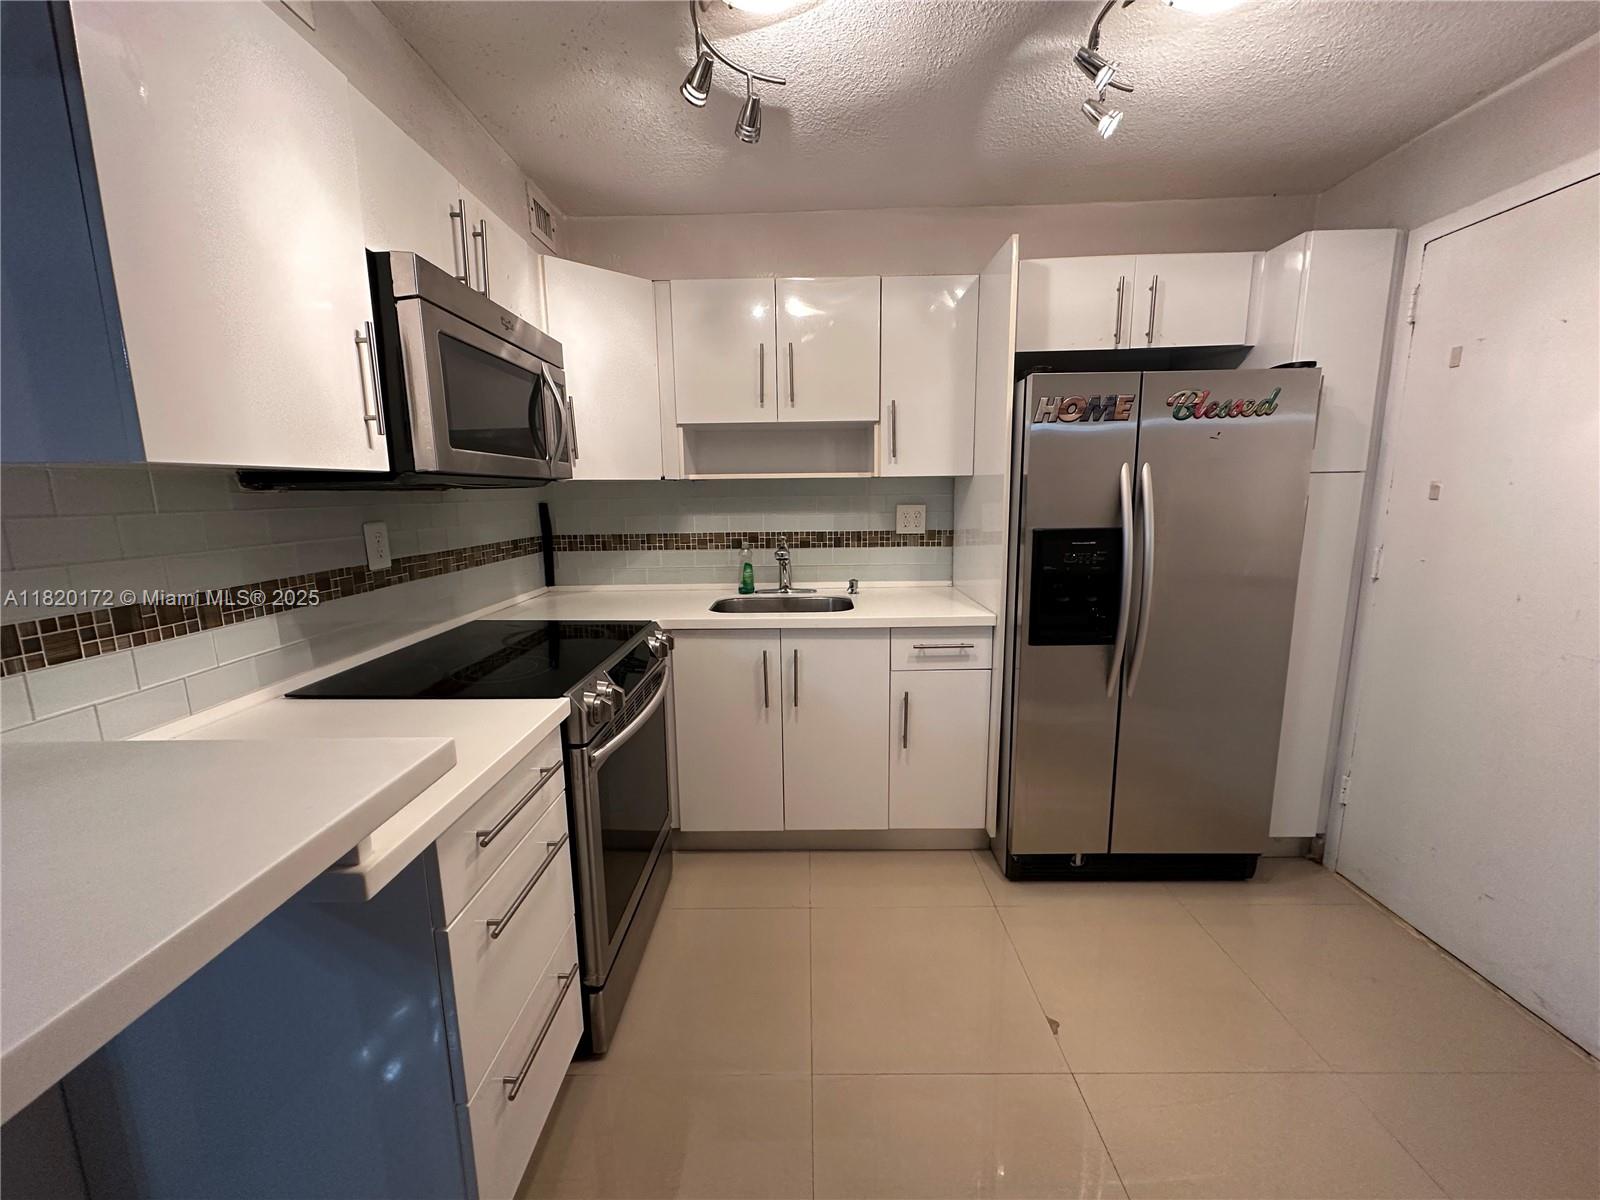
Active
$190,000
1
bds
|
2
ba
|
900
sqft
|
built
1970
1470 NE 125th Ter, North Miami, FL 33161
$-429
Cash flow
-11.8%
Cash-on-Cash Return
3.4%
Cap rate
1.0%
Rent to Value Ratio
Active
$169,999
2
bds
|
2
ba
|
1,075
sqft
|
built
1974
14850 Naranja Lakes Blvd, Homestead, FL 33032
$-181
Cash flow
-5.6%
Cash-on-Cash Return
4.9%
Cap rate
1.2%
Rent to Value Ratio
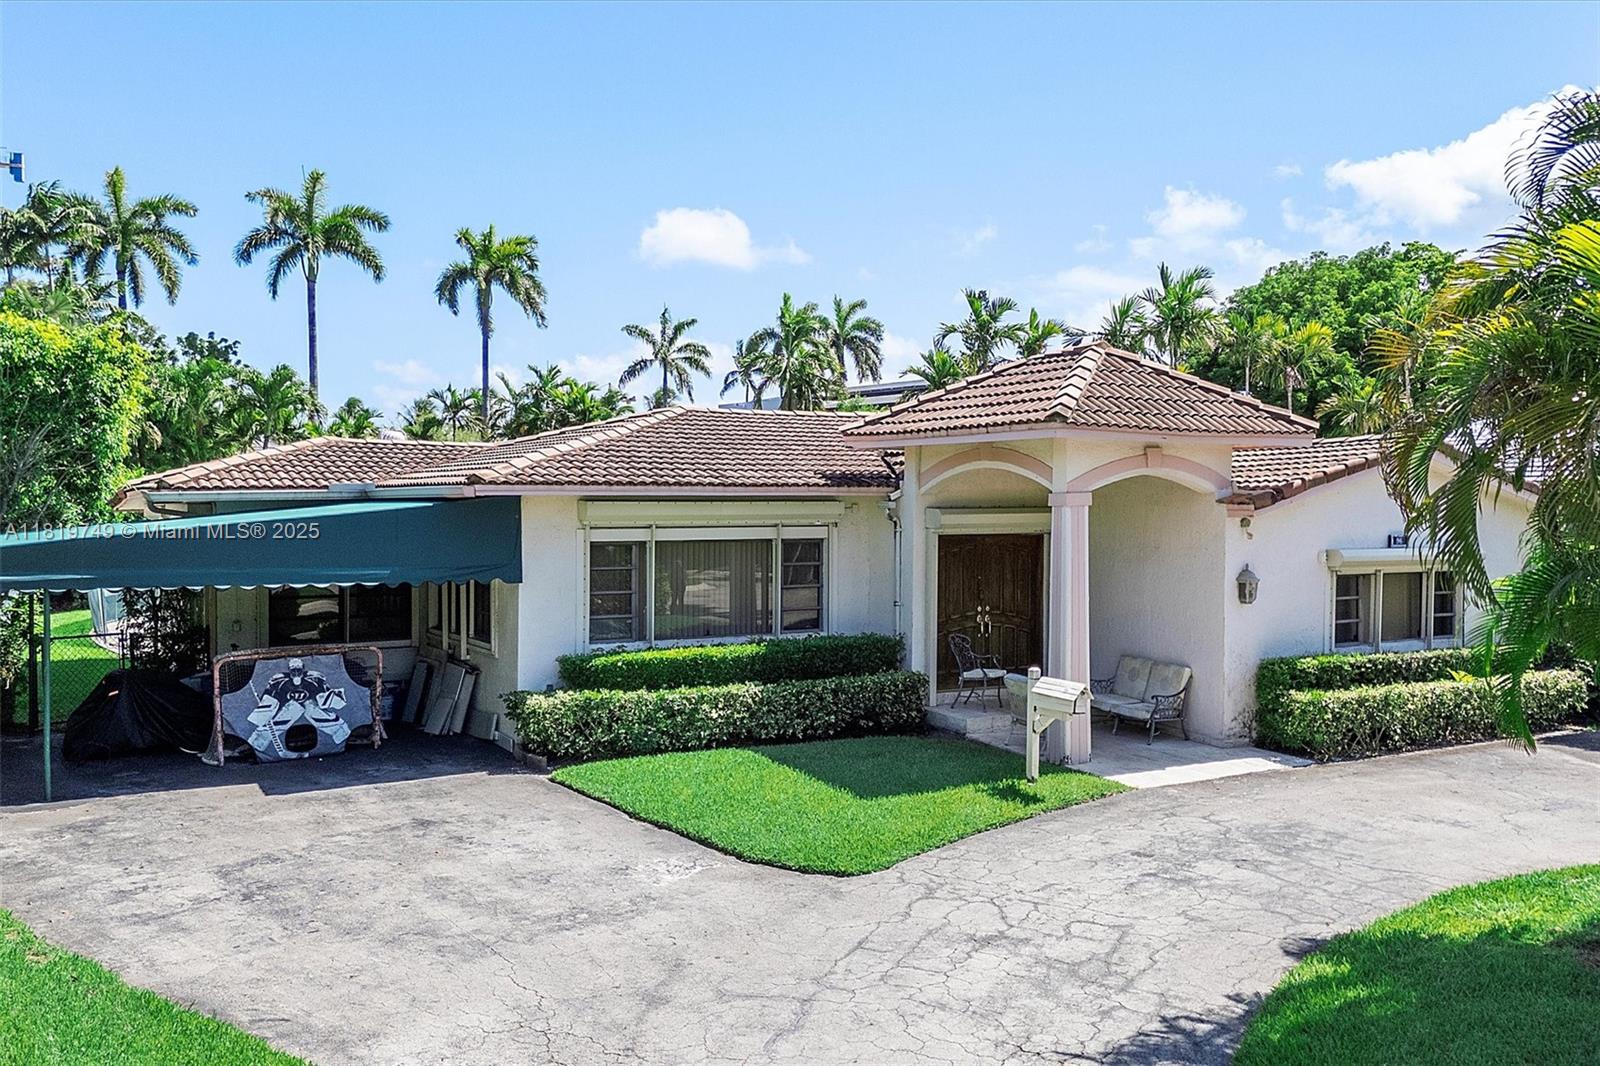
Active
$5,750,000
3
bds
|
5
ba
|
2,688
sqft
|
built
1951
96 Bal Cross Dr, Bal Harbour, FL 33154
$-25,295
Cash flow
-23.0%
Cash-on-Cash Return
0.9%
Cap rate
0.2%
Rent to Value Ratio
Active
$234,900
3
bds
|
2
ba
|
1,166
sqft
|
built
2007
2758 SE 17th Ave, Homestead, FL 33035
$-414
Cash flow
-9.2%
Cash-on-Cash Return
4.0%
Cap rate
0.9%
Rent to Value Ratio
Active
$479,000
1
bds
|
2
ba
|
824
sqft
|
built
1969
5701 Collins Ave, Miami Beach, FL 33140
$-2,437
Cash flow
-26.5%
Cash-on-Cash Return
0.0%
Cap rate
0.6%
Rent to Value Ratio
Active
$315,000
1
bds
|
1
ba
|
596
sqft
|
built
1971
445 SW 11th St, Miami, FL 33130
$-922
Cash flow
-15.3%
Cash-on-Cash Return
2.6%
Cap rate
0.7%
Rent to Value Ratio
Active
$694,999
3
bds
|
2
ba
|
1,427
sqft
|
built
2007
3022 NW 95th St, Miami, FL 33147
$-2,293
Cash flow
-17.2%
Cash-on-Cash Return
2.2%
Cap rate
0.5%
Rent to Value Ratio
Active
$450,000
4
bds
|
2
ba
|
1,851
sqft
|
built
1958
1110 NW 183rd St, Miami Gardens, FL 33169
$-889
Cash flow
-10.3%
Cash-on-Cash Return
3.8%
Cap rate
0.7%
Rent to Value Ratio
Active
$590,000
4
bds
|
0
ba
|
1,452
sqft
|
built
1954
6430 NE 1st Ct, Miami, FL 33138
$-1,305
Cash flow
-11.5%
Cash-on-Cash Return
3.5%
Cap rate
0.5%
Rent to Value Ratio
Active
$398,000
2
bds
|
3
ba
|
1,150
sqft
|
built
2007
7472 NW 180th St, Hialeah, FL 33015
$-740
Cash flow
-9.7%
Cash-on-Cash Return
3.9%
Cap rate
0.6%
Rent to Value Ratio
Active
$598,000
3
bds
|
2
ba
|
1,318
sqft
|
built
2003
19220 SW 119th Pl, Miami, FL 33177
$-1,351
Cash flow
-11.8%
Cash-on-Cash Return
3.4%
Cap rate
0.5%
Rent to Value Ratio
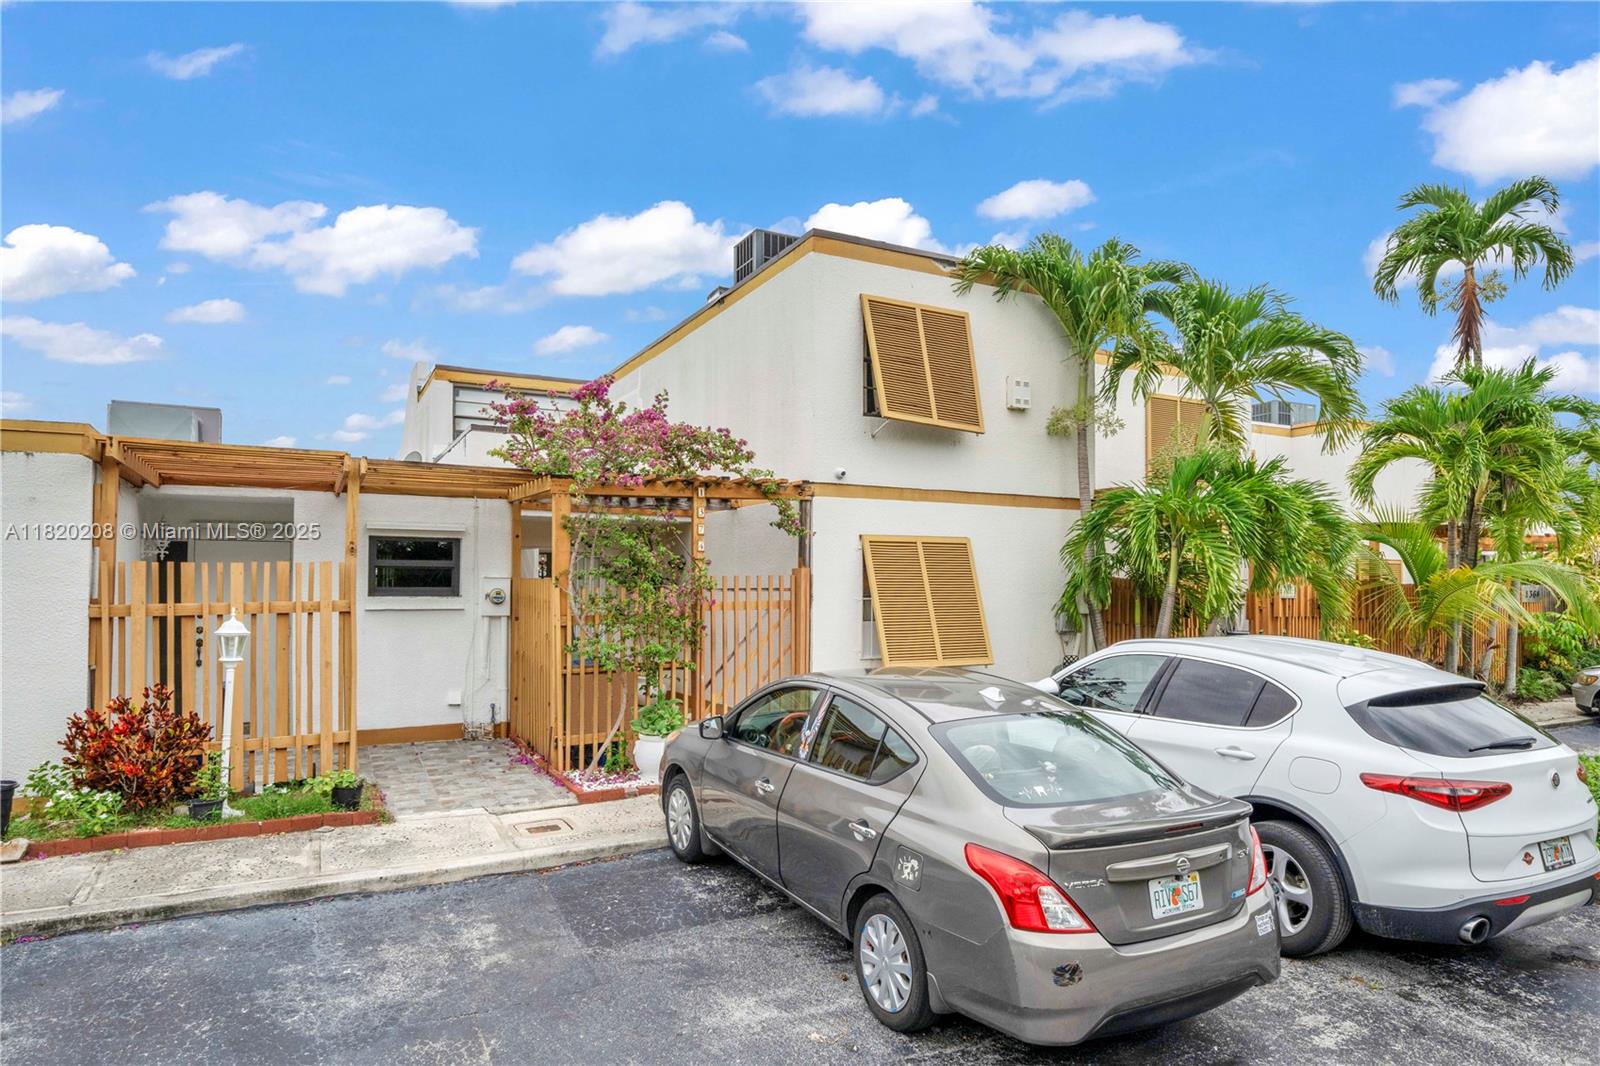
Active
$559,900
3
bds
|
3
ba
|
1,851
sqft
|
built
1979
1374 SW 131st Place Cir E, Miami, FL 33184
$-1,412
Cash flow
-13.2%
Cash-on-Cash Return
3.1%
Cap rate
0.6%
Rent to Value Ratio
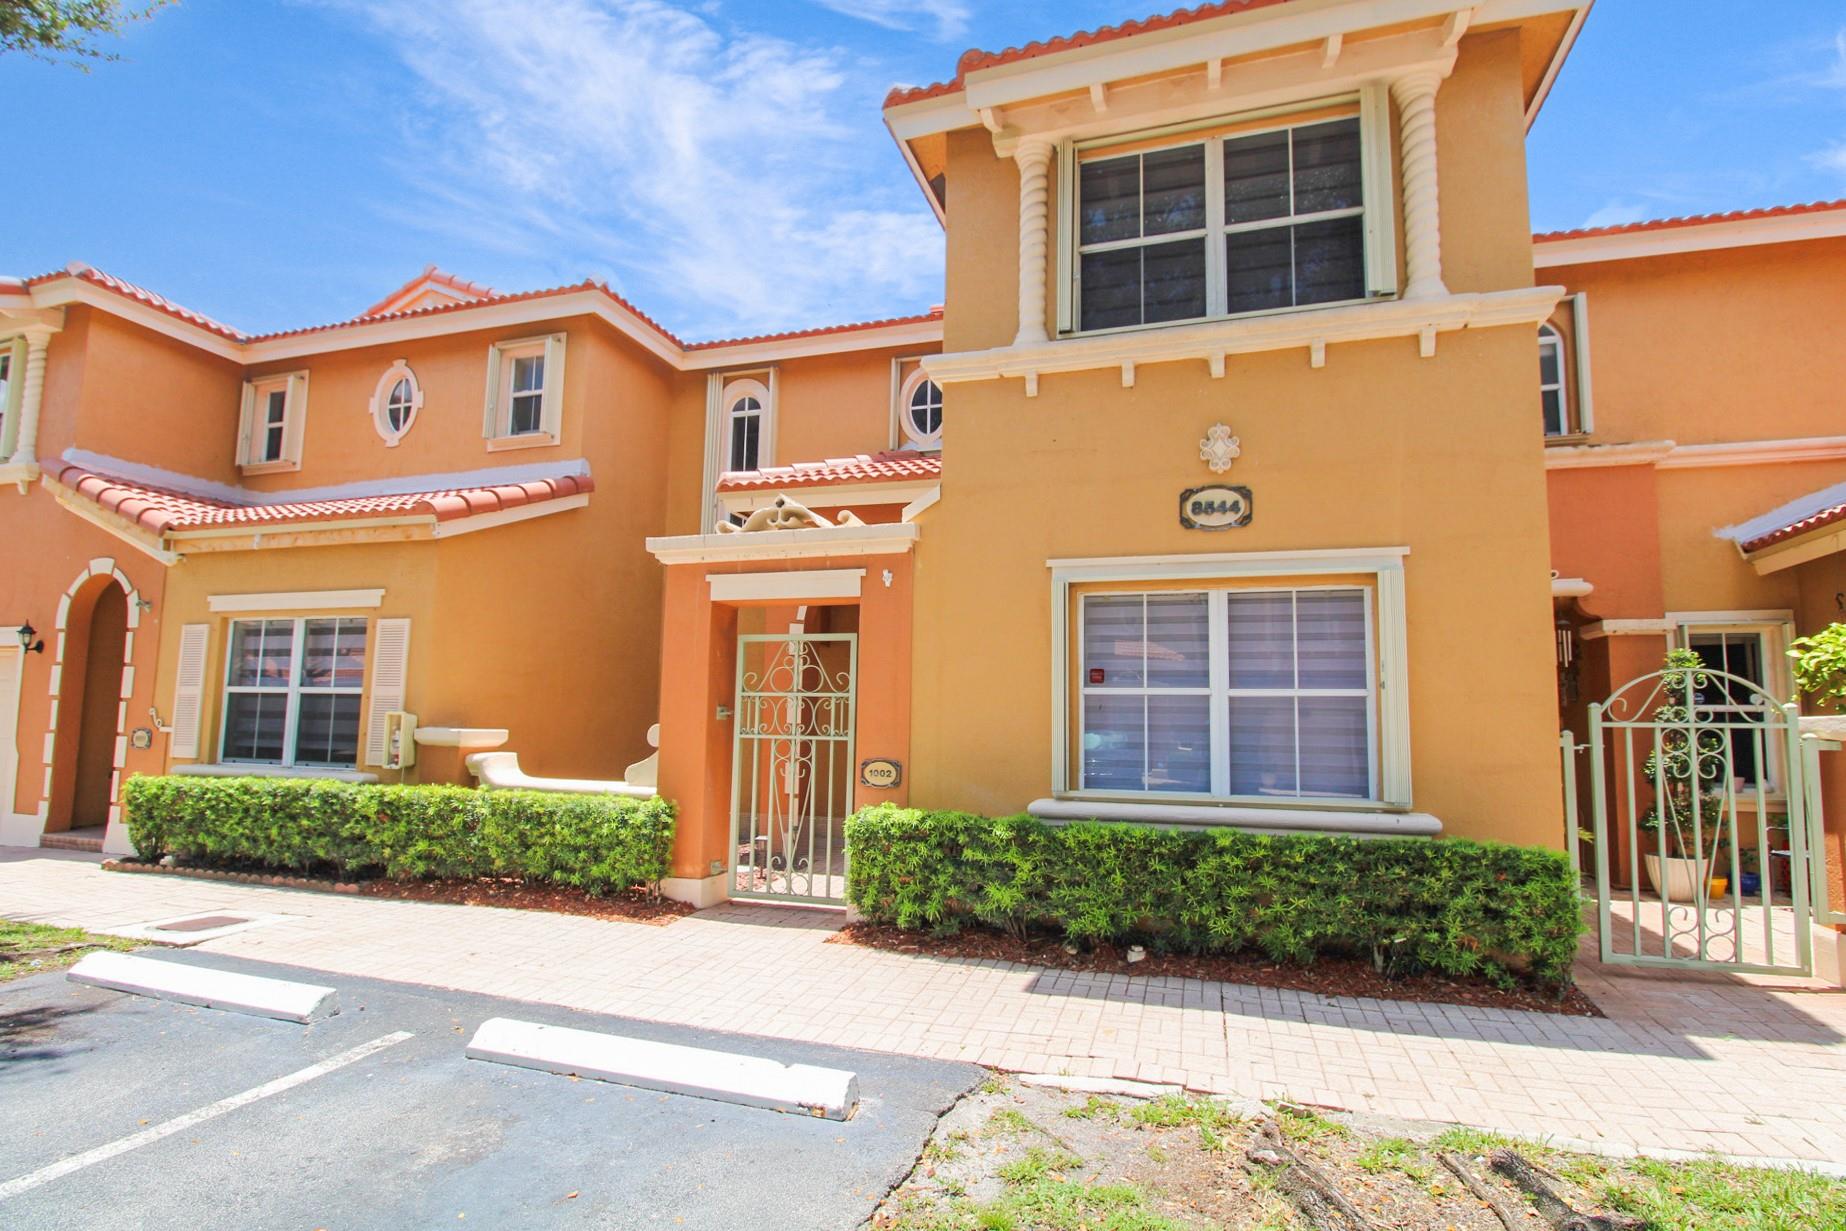
Active
$535,000
3
bds
|
3
ba
|
1,450
sqft
|
built
2001
8544 NW 140th Ter, Miami Lakes, FL 33016
$-1,292
Cash flow
-12.6%
Cash-on-Cash Return
3.3%
Cap rate
0.6%
Rent to Value Ratio

Active
$649,999
3
bds
|
3
ba
|
1,477
sqft
|
built
2004
19730 NW 78th Path, Hialeah, FL 33015
$-1,340
Cash flow
-10.8%
Cash-on-Cash Return
3.7%
Cap rate
0.5%
Rent to Value Ratio
Active
$159,900
bds
|
1
ba
|
370
sqft
|
built
1966
19201 Collins Ave, Sunny Isles Beach, FL 33160
$-627
Cash flow
-20.5%
Cash-on-Cash Return
1.4%
Cap rate
1.6%
Rent to Value Ratio

Active
$3,999,000
3
bds
|
3
ba
|
1,950
sqft
|
built
1952
1865 Keystone Blvd, North Miami, FL 33181
$-16,043
Cash flow
-20.9%
Cash-on-Cash Return
1.3%
Cap rate
0.2%
Rent to Value Ratio

Active
$1,795,000
4
bds
|
3
ba
|
1,900
sqft
|
built
1933
427 W 43rd St, Miami Beach, FL 33140
$-4,618
Cash flow
-13.4%
Cash-on-Cash Return
3.1%
Cap rate
0.5%
Rent to Value Ratio

Active
$850,000
3
bds
|
2
ba
|
1,767
sqft
|
built
1954
5959 SW 16th Ter, Miami, FL 33155
$-2,116
Cash flow
-13.0%
Cash-on-Cash Return
3.2%
Cap rate
0.4%
Rent to Value Ratio

Active
$642,000
2
bds
|
2
ba
|
982
sqft
|
built
1980
2924 Collins Ave, Miami Beach, FL 33140
$-2,733
Cash flow
-22.2%
Cash-on-Cash Return
1.0%
Cap rate
0.4%
Rent to Value Ratio
Active
$245,000
2
bds
|
2
ba
|
908
sqft
|
built
1986
7125 NW 186th St, Hialeah, FL 33015
$-171
Cash flow
-3.6%
Cash-on-Cash Return
5.3%
Cap rate
0.9%
Rent to Value Ratio

Active
$610,000
2
bds
|
3
ba
|
1,158
sqft
|
built
2005
601 NE 36th St, Miami, FL 33137
$-2,113
Cash flow
-18.1%
Cash-on-Cash Return
2.0%
Cap rate
0.7%
Rent to Value Ratio
Active
$699,900
4
bds
|
0
ba
|
2,555
sqft
|
built
1952
9620 NW 26th Ave, Miami, FL 33147
$-2,325
Cash flow
-17.3%
Cash-on-Cash Return
2.2%
Cap rate
0.3%
Rent to Value Ratio

Active
$1,370,000
6
bds
|
0
ba
|
2,320
sqft
|
built
1984
43 NW 41st St, Miami, FL 33127
$-4,666
Cash flow
-17.8%
Cash-on-Cash Return
2.1%
Cap rate
0.3%
Rent to Value Ratio
Active
$769,900
3
bds
|
2
ba
|
2,118
sqft
|
built
1982
12821 SW 148th Street Rd, Miami, FL 33186
$-788
Cash flow
-5.3%
Cash-on-Cash Return
4.9%
Cap rate
0.6%
Rent to Value Ratio
Active
$1,550,000
5
bds
|
3
ba
|
3,052
sqft
|
built
1999
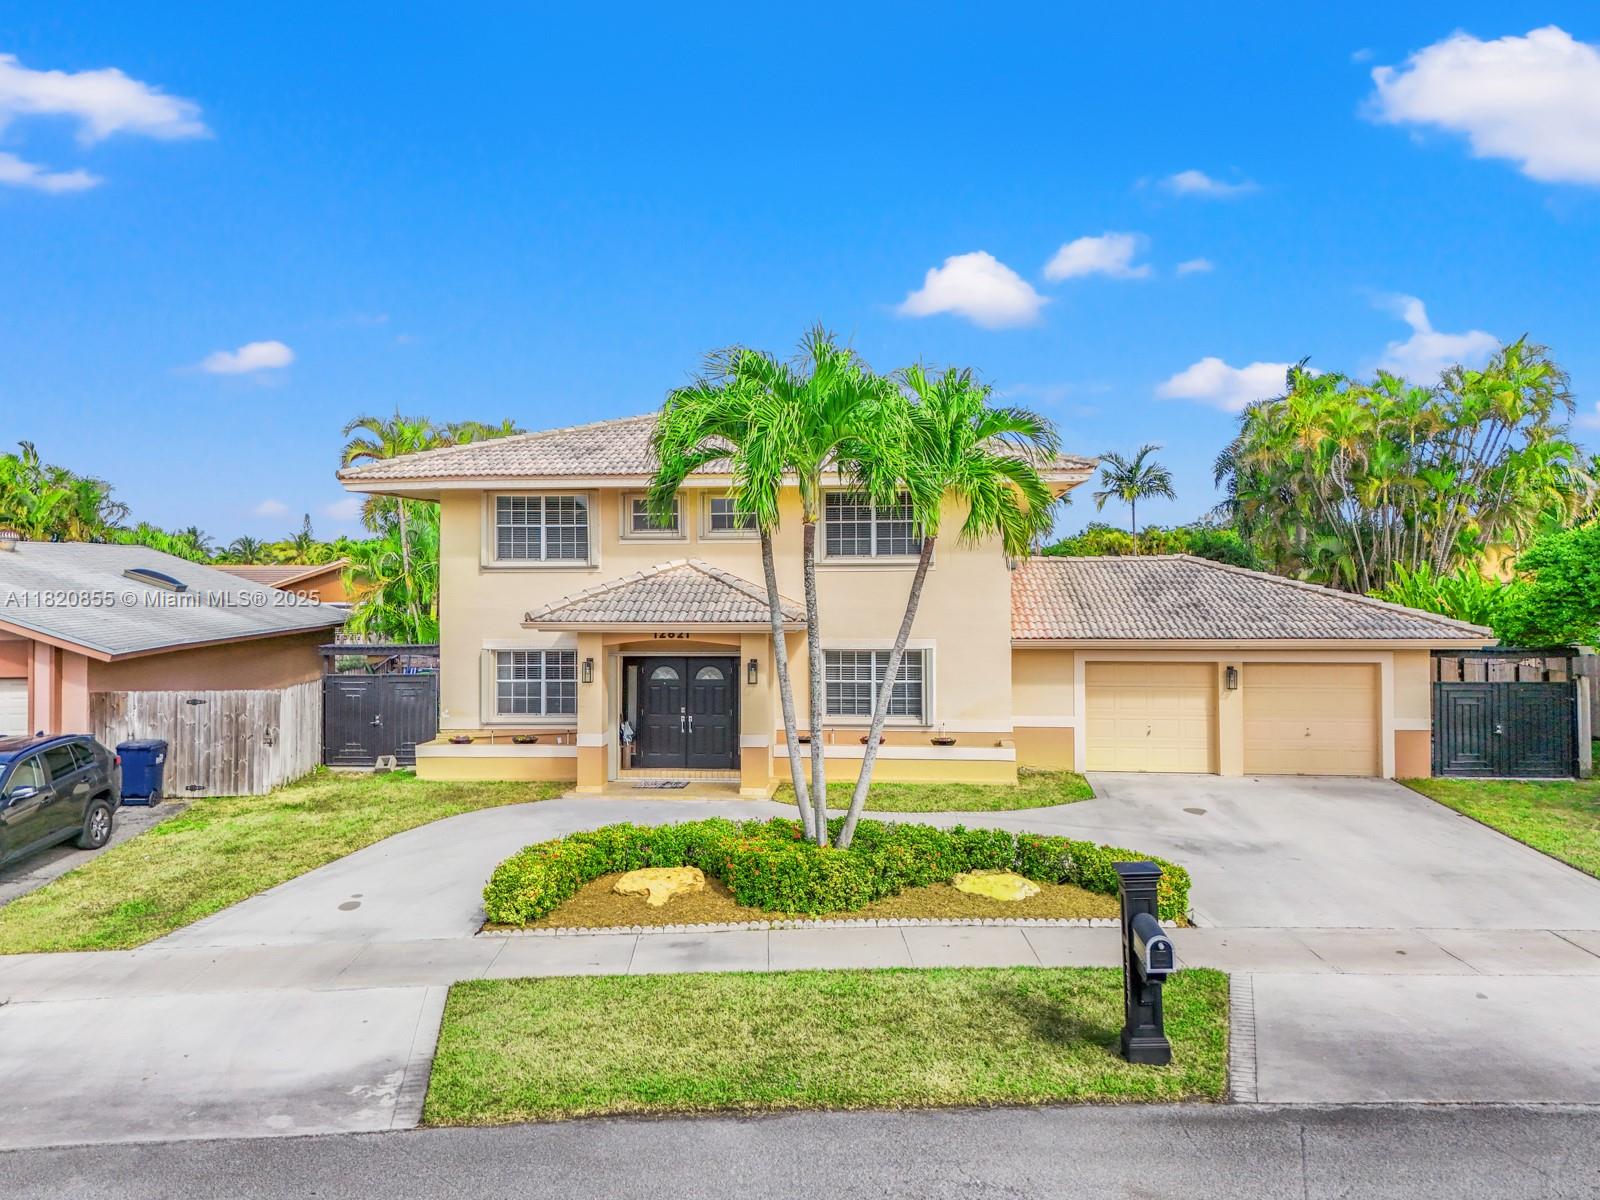
10873 NW 71st St, Doral, FL 33178
$-5,442
Cash flow
-18.3%
Cash-on-Cash Return
1.9%
Cap rate
0.4%
Rent to Value Ratio
Active
$815,000
3
bds
|
0
ba
|
2,055
sqft
|
built
1947
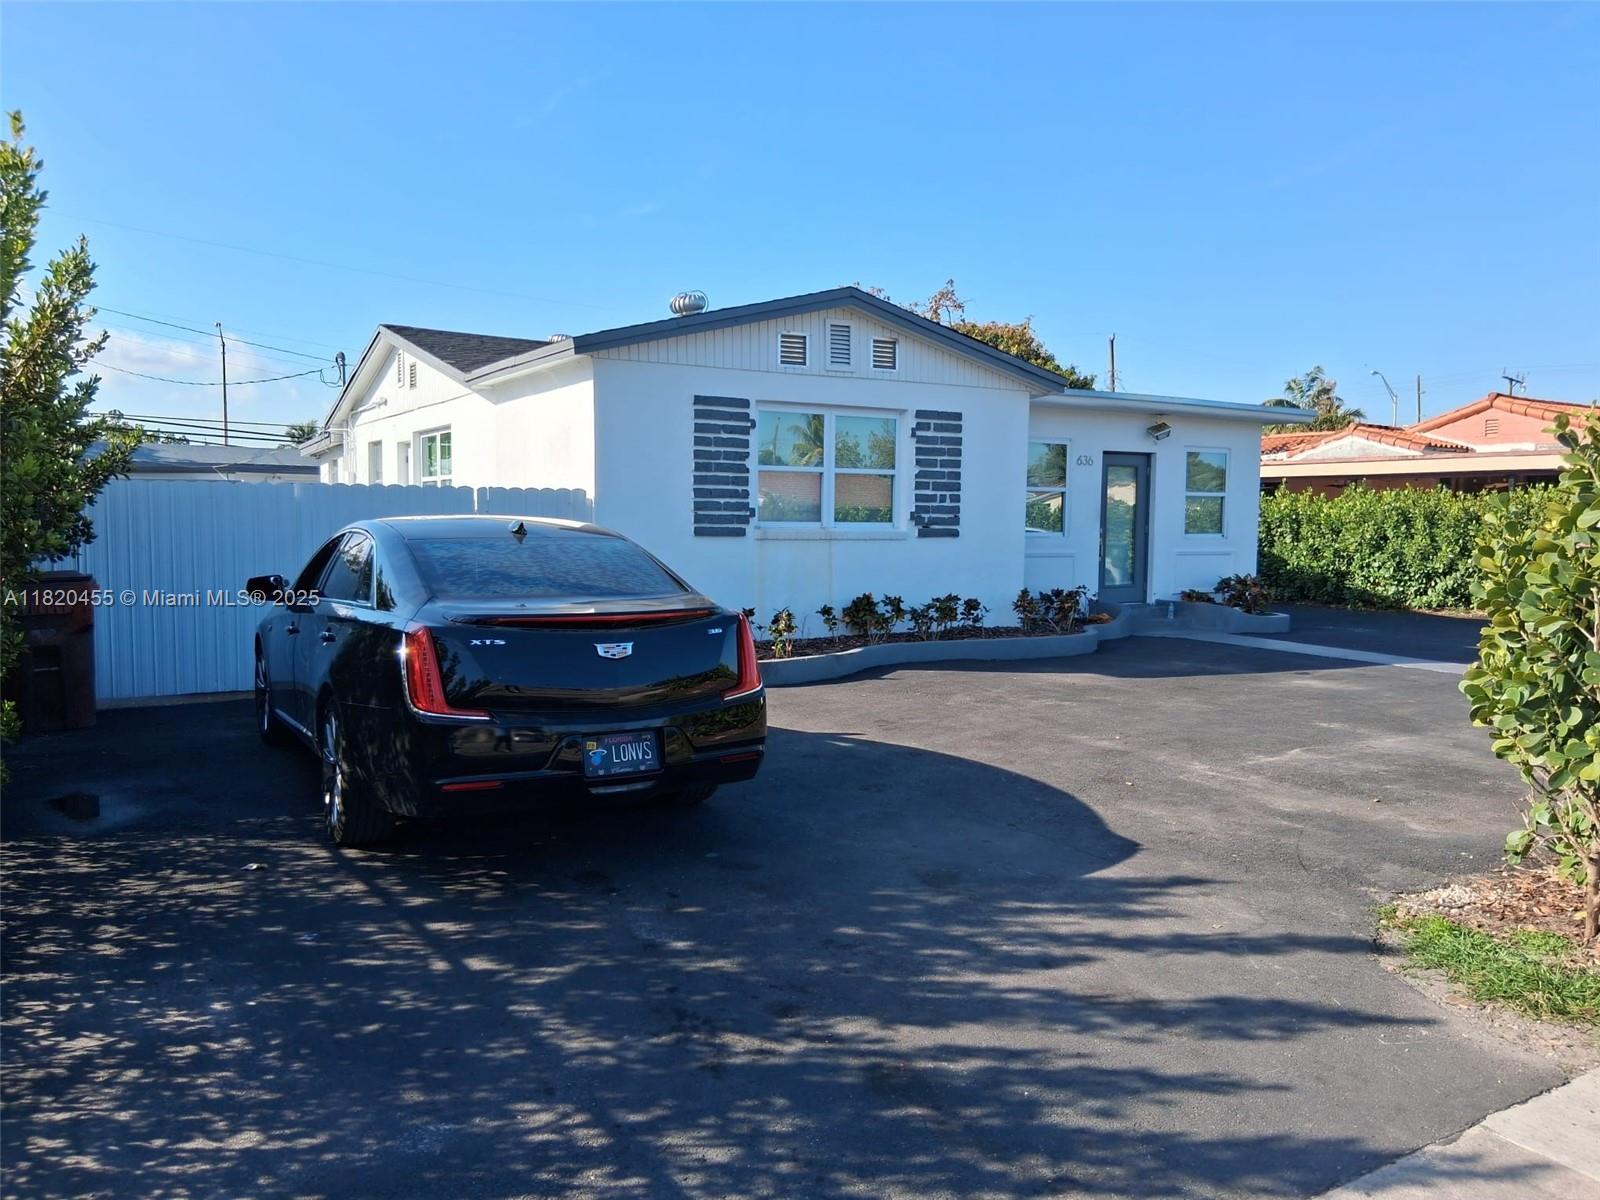
636 E 18th St, Hialeah, FL 33013
$-3,200
Cash flow
-20.5%
Cash-on-Cash Return
1.4%
Cap rate
0.3%
Rent to Value Ratio
Active
$259,900
2
bds
|
2
ba
|
1,091
sqft
|
built
1968
1475 NE 125th Ter, North Miami, FL 33161
$-1,011
Cash flow
-20.3%
Cash-on-Cash Return
1.5%
Cap rate
0.8%
Rent to Value Ratio
Active
$530,000
3
bds
|
2
ba
|
966
sqft
|
built
1964
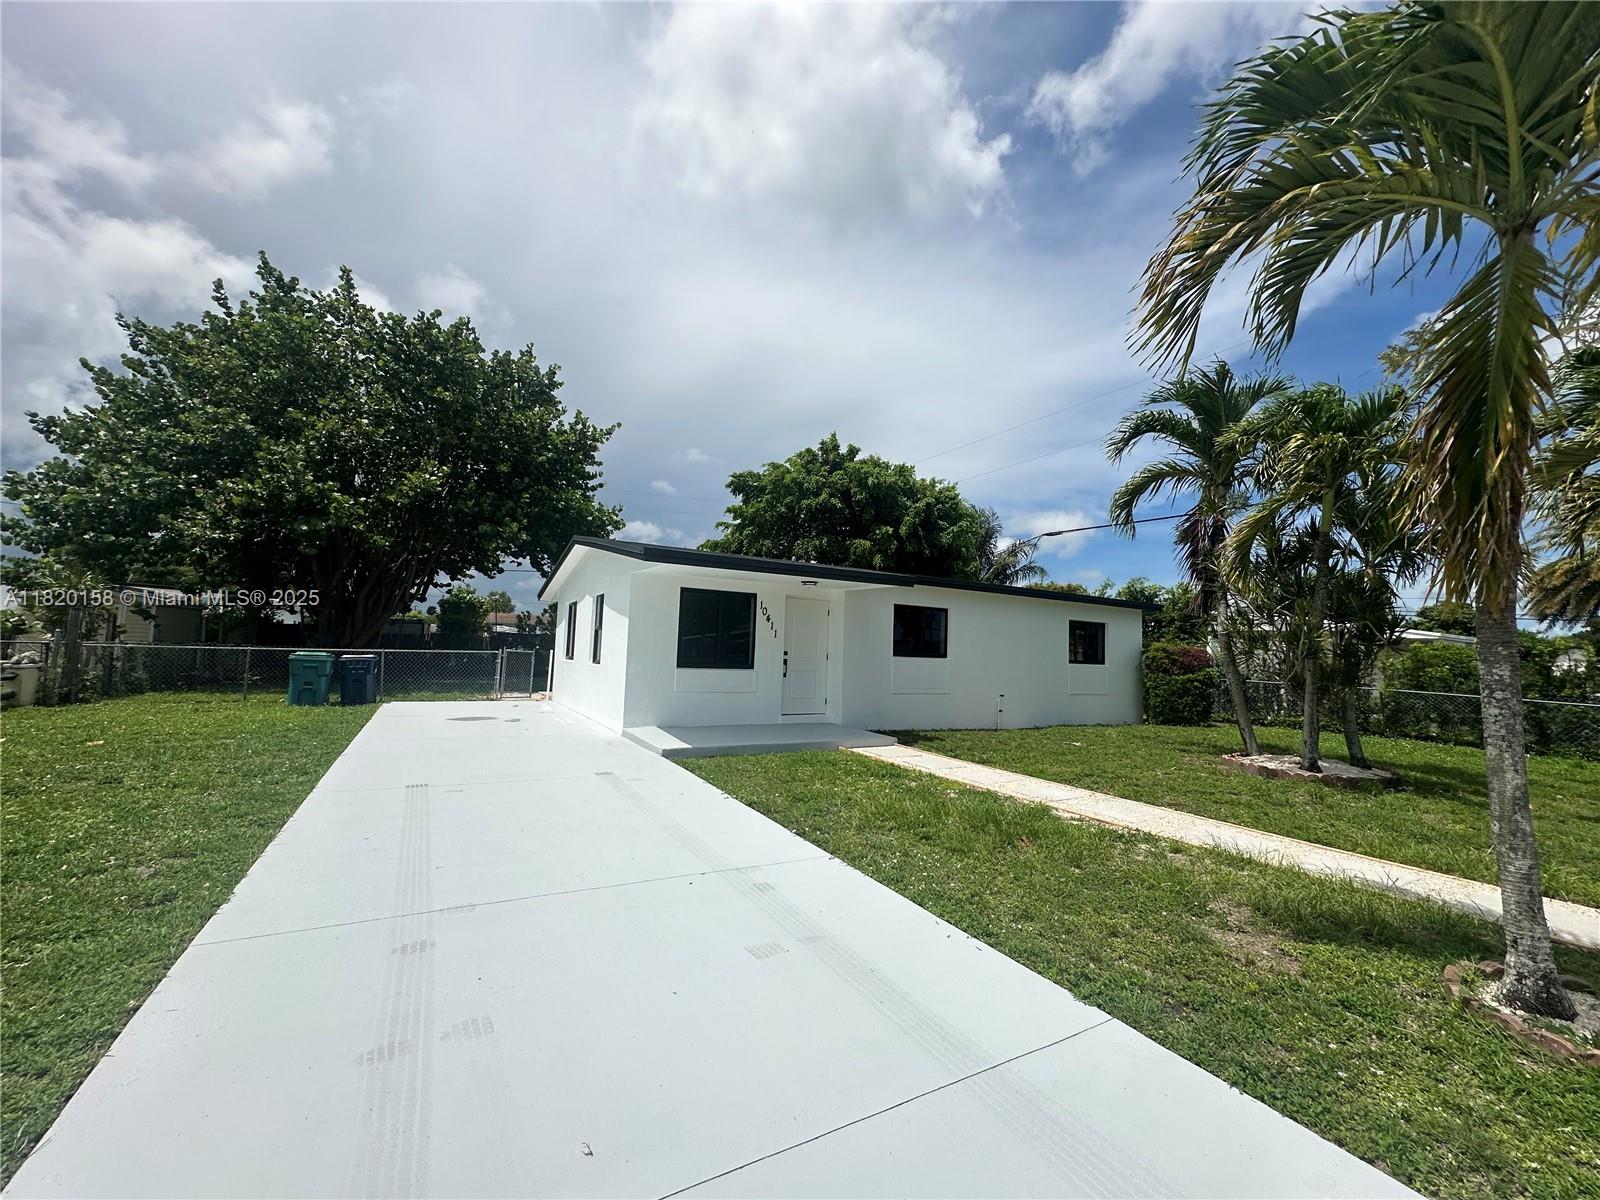
10411 SW 151st Ter, Miami, FL 33176
$-1,027
Cash flow
-10.1%
Cash-on-Cash Return
3.8%
Cap rate
0.5%
Rent to Value Ratio
Active
$230,000
2
bds
|
2
ba
|
940
sqft
|
built
1974
10350 SW 220th St, Cutler Bay, FL 33190
$-380
Cash flow
-8.6%
Cash-on-Cash Return
4.2%
Cap rate
1.0%
Rent to Value Ratio
Active
$255,000
2
bds
|
2
ba
|
1,050
sqft
|
built
1973
13499 Biscayne Blvd, North Miami, FL 33181
$-1,455
Cash flow
-29.8%
Cash-on-Cash Return
-0.7%
Cap rate
0.8%
Rent to Value Ratio
Active
$1,790,000
3
bds
|
3
ba
|
976
sqft
|
built
2022
398 NE 5th St, Miami, FL 33132
$-4,771
Cash flow
-13.9%
Cash-on-Cash Return
2.9%
Cap rate
0.6%
Rent to Value Ratio
Active
$390,000
2
bds
|
2
ba
|
1,128
sqft
|
built
1990
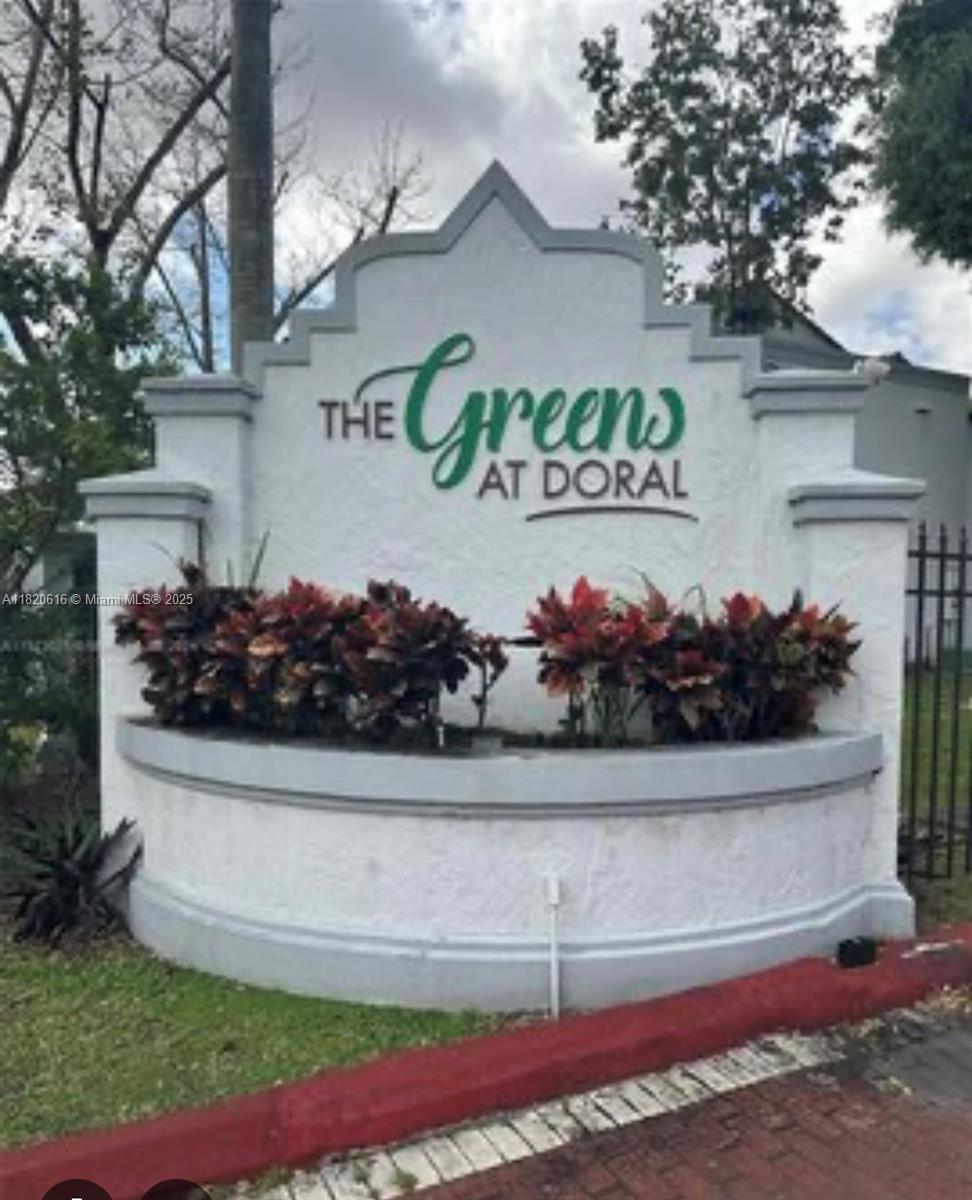
4659 NW 97th Ct, Doral, FL 33178
$-1,121
Cash flow
-15.0%
Cash-on-Cash Return
2.7%
Cap rate
0.6%
Rent to Value Ratio
Active
$650,000
2
bds
|
3
ba
|
1,274
sqft
|
built
2008
90 SW 3rd St, Miami, FL 33130
$-2,584
Cash flow
-20.7%
Cash-on-Cash Return
1.4%
Cap rate
0.6%
Rent to Value Ratio
Active
$3,000,000
3
bds
|
4
ba
|
1,933
sqft
|
built
2009
17121 Collins Ave, Sunny Isles Beach, FL 33160
$-13,573
Cash flow
-23.6%
Cash-on-Cash Return
0.7%
Cap rate
0.3%
Rent to Value Ratio
Active
$730,000
2
bds
|
2
ba
|
1,450
sqft
|
built
2009
495 Brickell Ave, Miami, FL 33131
$-2,991
Cash flow
-21.4%
Cash-on-Cash Return
1.2%
Cap rate
0.8%
Rent to Value Ratio
Active
$260,000
2
bds
|
1
ba
|
978
sqft
|
built
1989
18346 NW 68th Ave, Hialeah, FL 33015
$-559
Cash flow
-11.2%
Cash-on-Cash Return
3.6%
Cap rate
0.8%
Rent to Value Ratio
Active
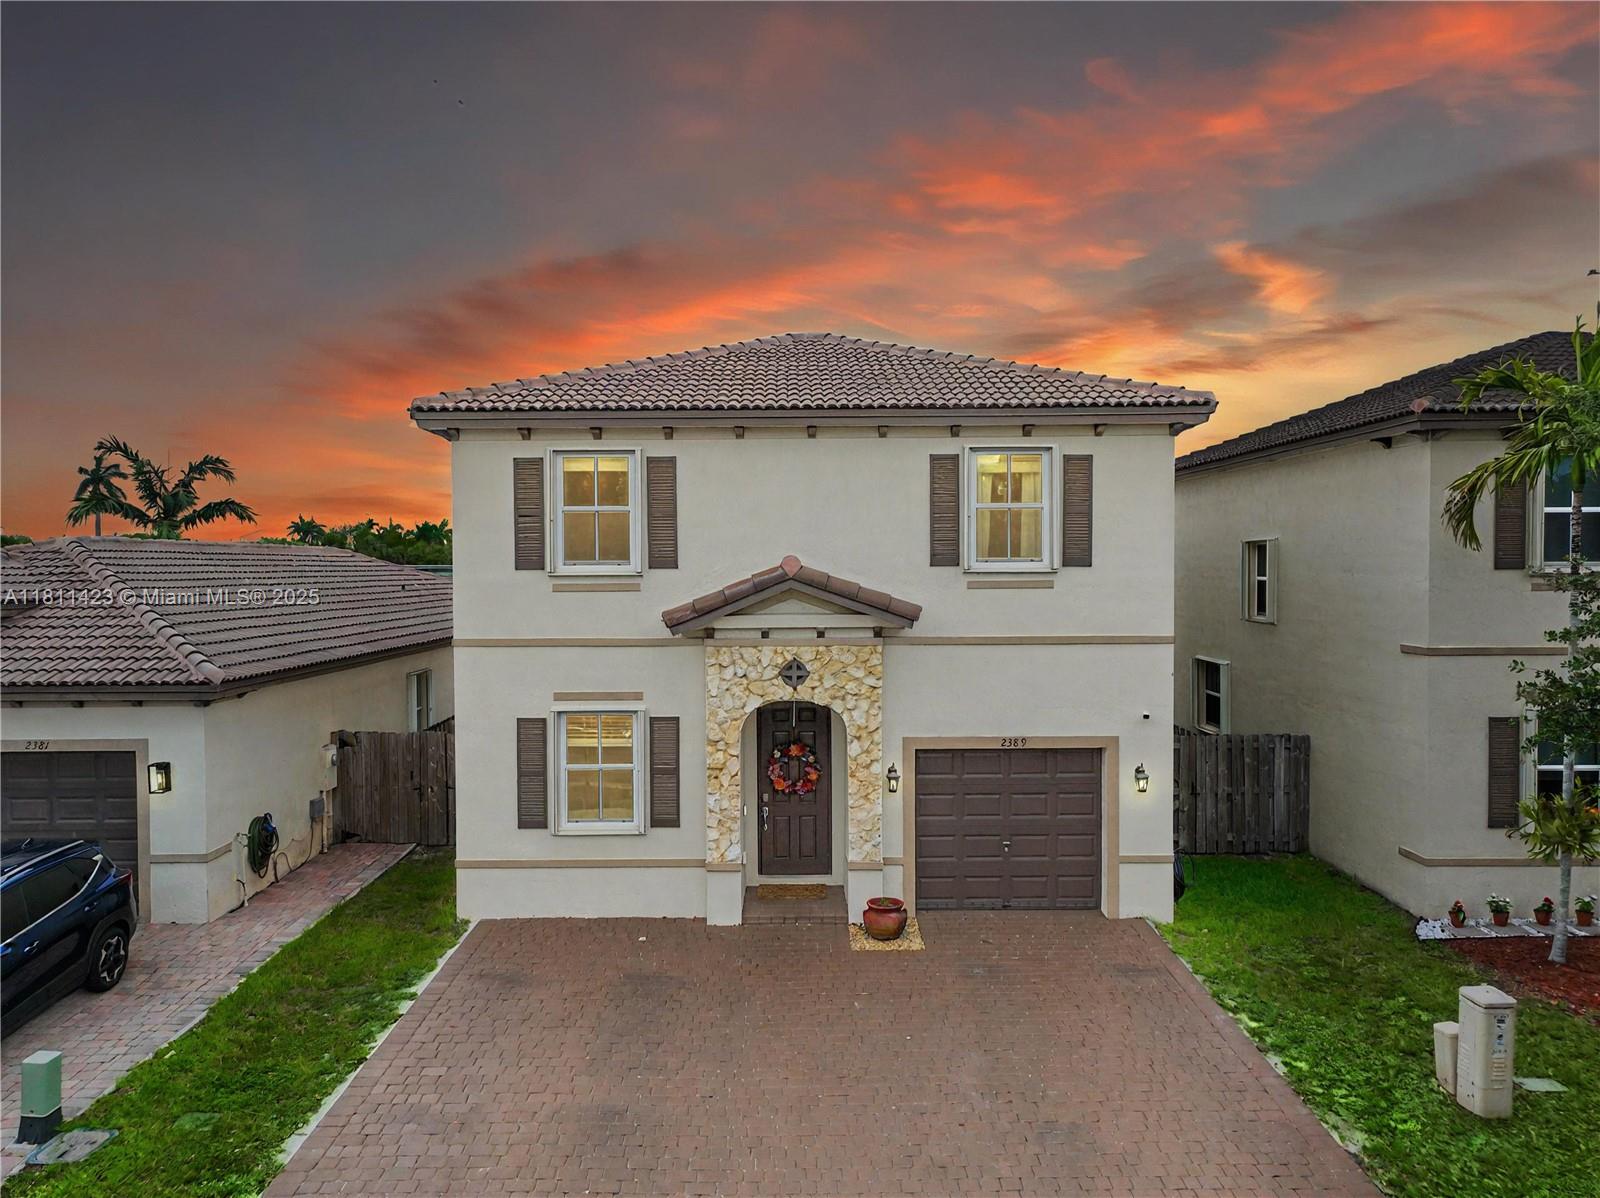
$529,900
4
bds
|
3
ba
|
2,104
sqft
|
built
2012
2389 NE 4th St, Homestead, FL 33033
$-1,118
Cash flow
-11.0%
Cash-on-Cash Return
3.6%
Cap rate
0.6%
Rent to Value Ratio
Active
$455,000
2
bds
|
3
ba
|
1,592
sqft
|
built
1985
14388 SW 96th Ln, Miami, FL 33186
$-1,071
Cash flow
-12.3%
Cash-on-Cash Return
3.3%
Cap rate
0.6%
Rent to Value Ratio
Active
$320,000
2
bds
|
2
ba
|
1,003
sqft
|
built
1985
5314 W 26th Ave, Hialeah, FL 33016
$-502
Cash flow
-8.2%
Cash-on-Cash Return
4.3%
Cap rate
0.7%
Rent to Value Ratio