Miami Dade County Investment Properties for Sale
Browse homes for sale and investment properties in Miami Dade County. Refine your search by price, property type, or more.
Best cash flowing properties in Miami Dade County
Active
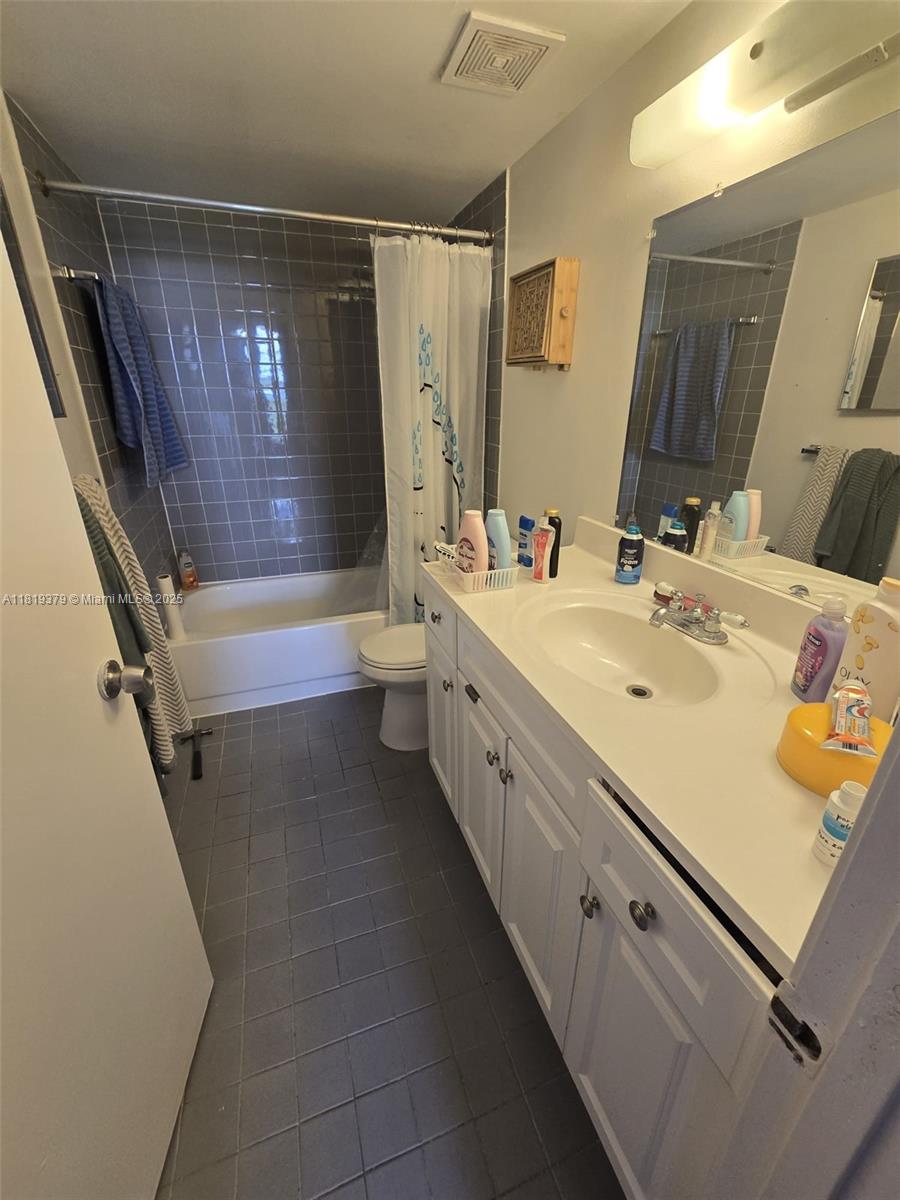
$280,000
2
bds
|
2
ba
|
974
sqft
|
built
1982
9688 Fontainebleau Blvd, Miami, FL 33172
$-402
Cash flow
-7.5%
Cash-on-Cash Return
4.6%
Cap rate
0.9%
Rent to Value Ratio
Active
$215,000
1
bds
|
1
ba
|
709
sqft
|
built
1968
10816 SW 88th St, Miami, FL 33176
$-409
Cash flow
-9.9%
Cash-on-Cash Return
4.0%
Cap rate
0.9%
Rent to Value Ratio
10,000 out of 16,821 properties for sale in Miami Dade County
Limited Results Shown
Create a free account, or log in to reveal all property listings and enjoy the complete experience.
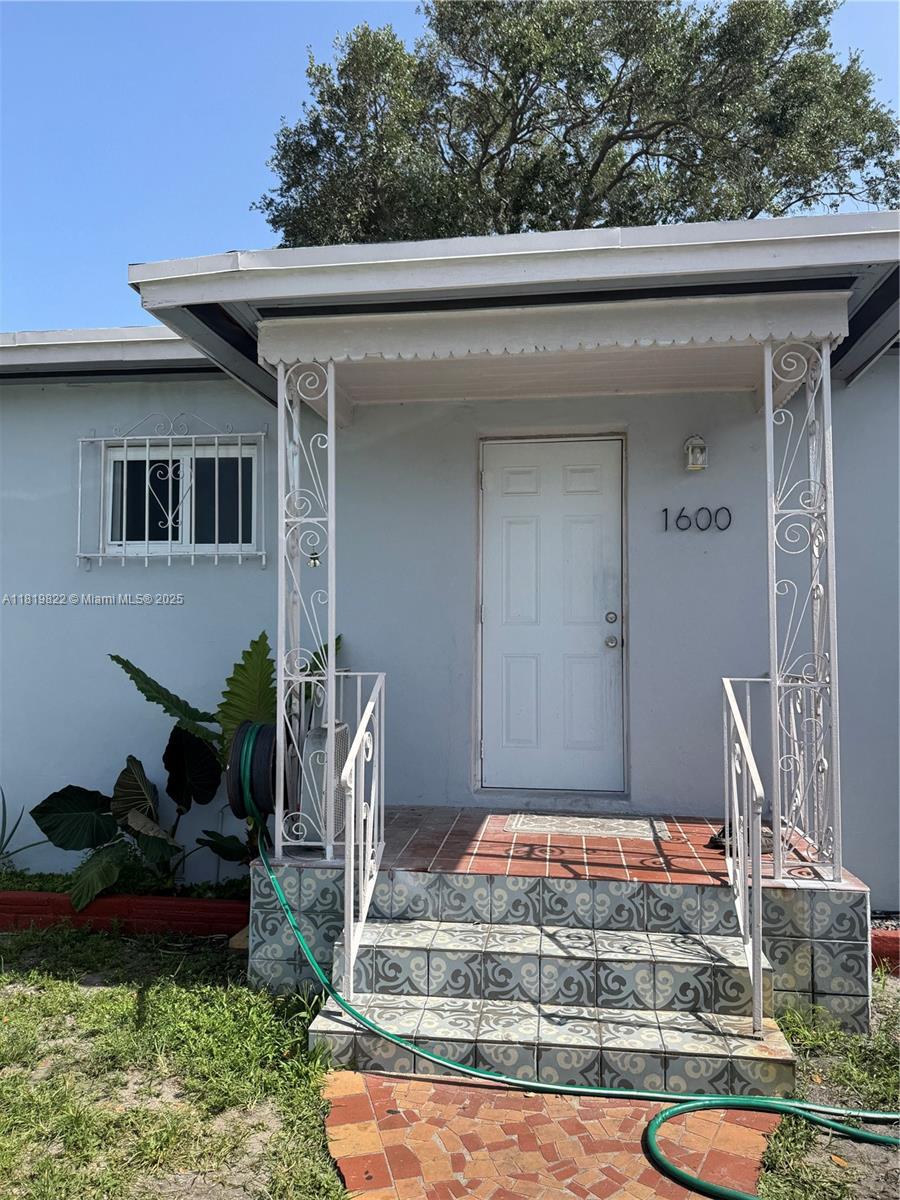
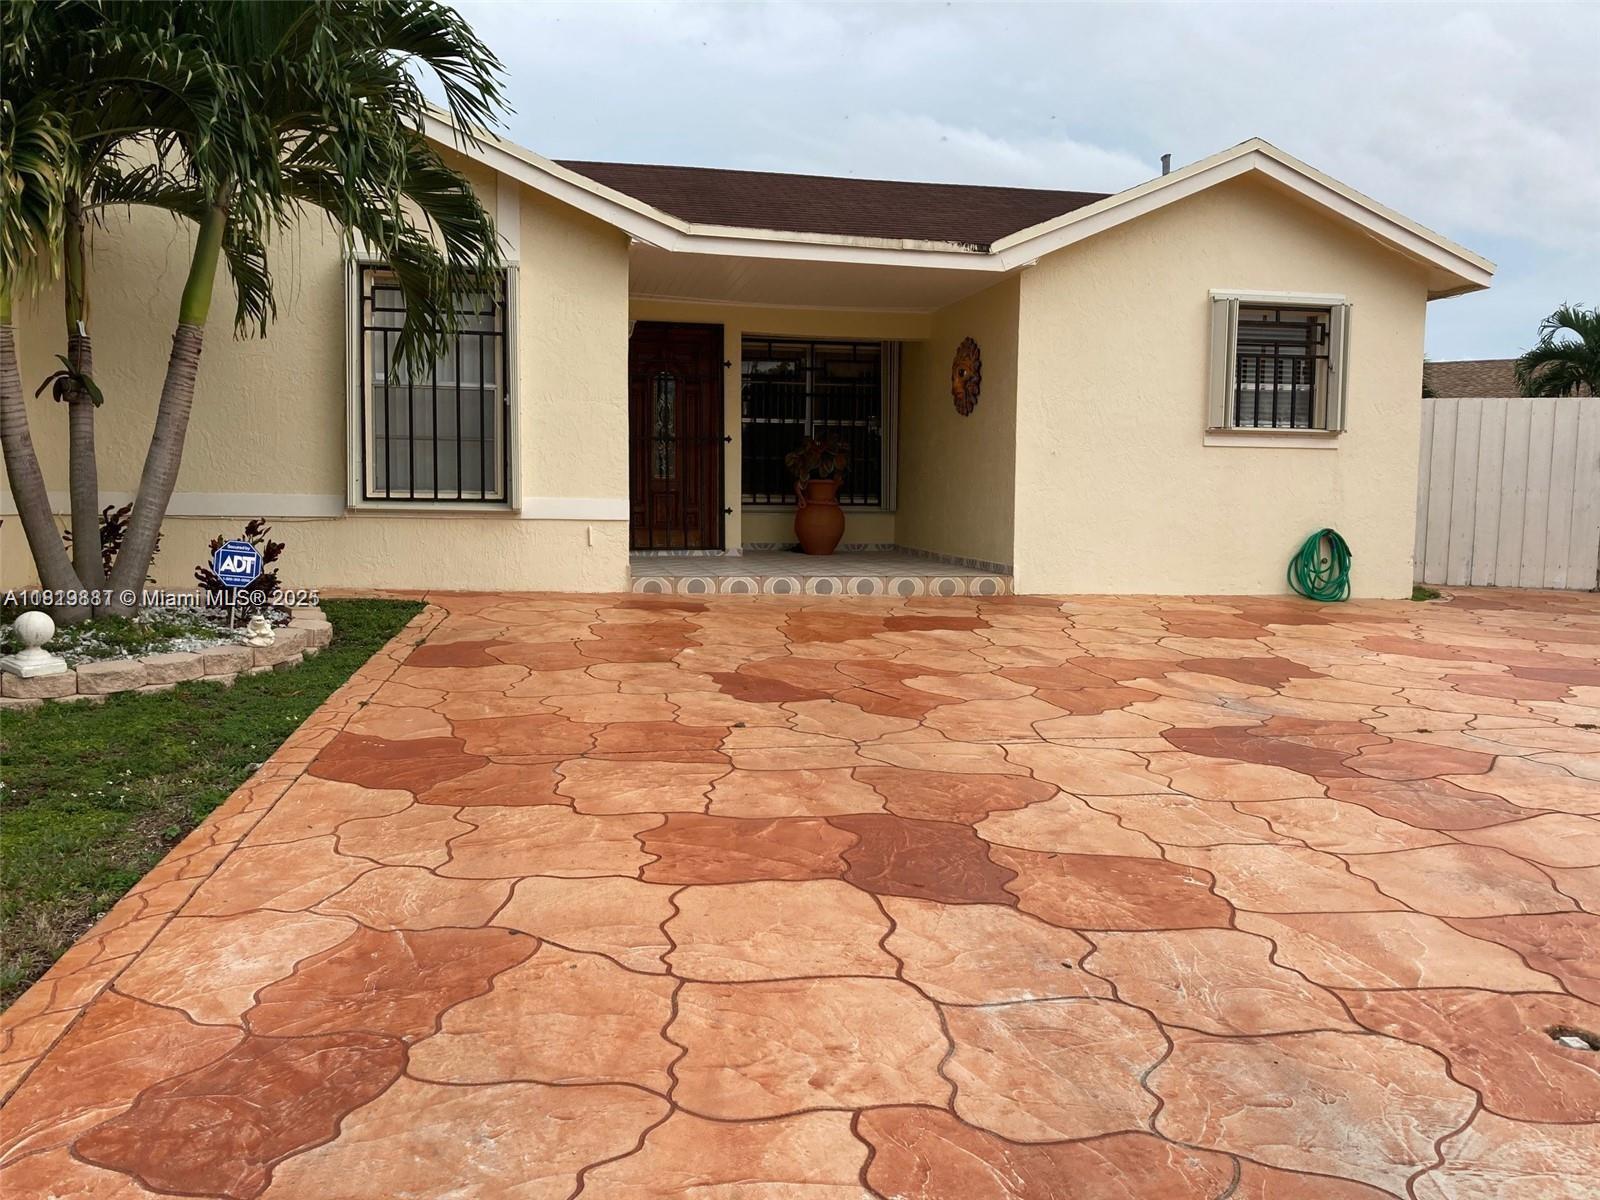
Active
$475,000
4
bds
|
2
ba
|
1,371
sqft
|
built
1961
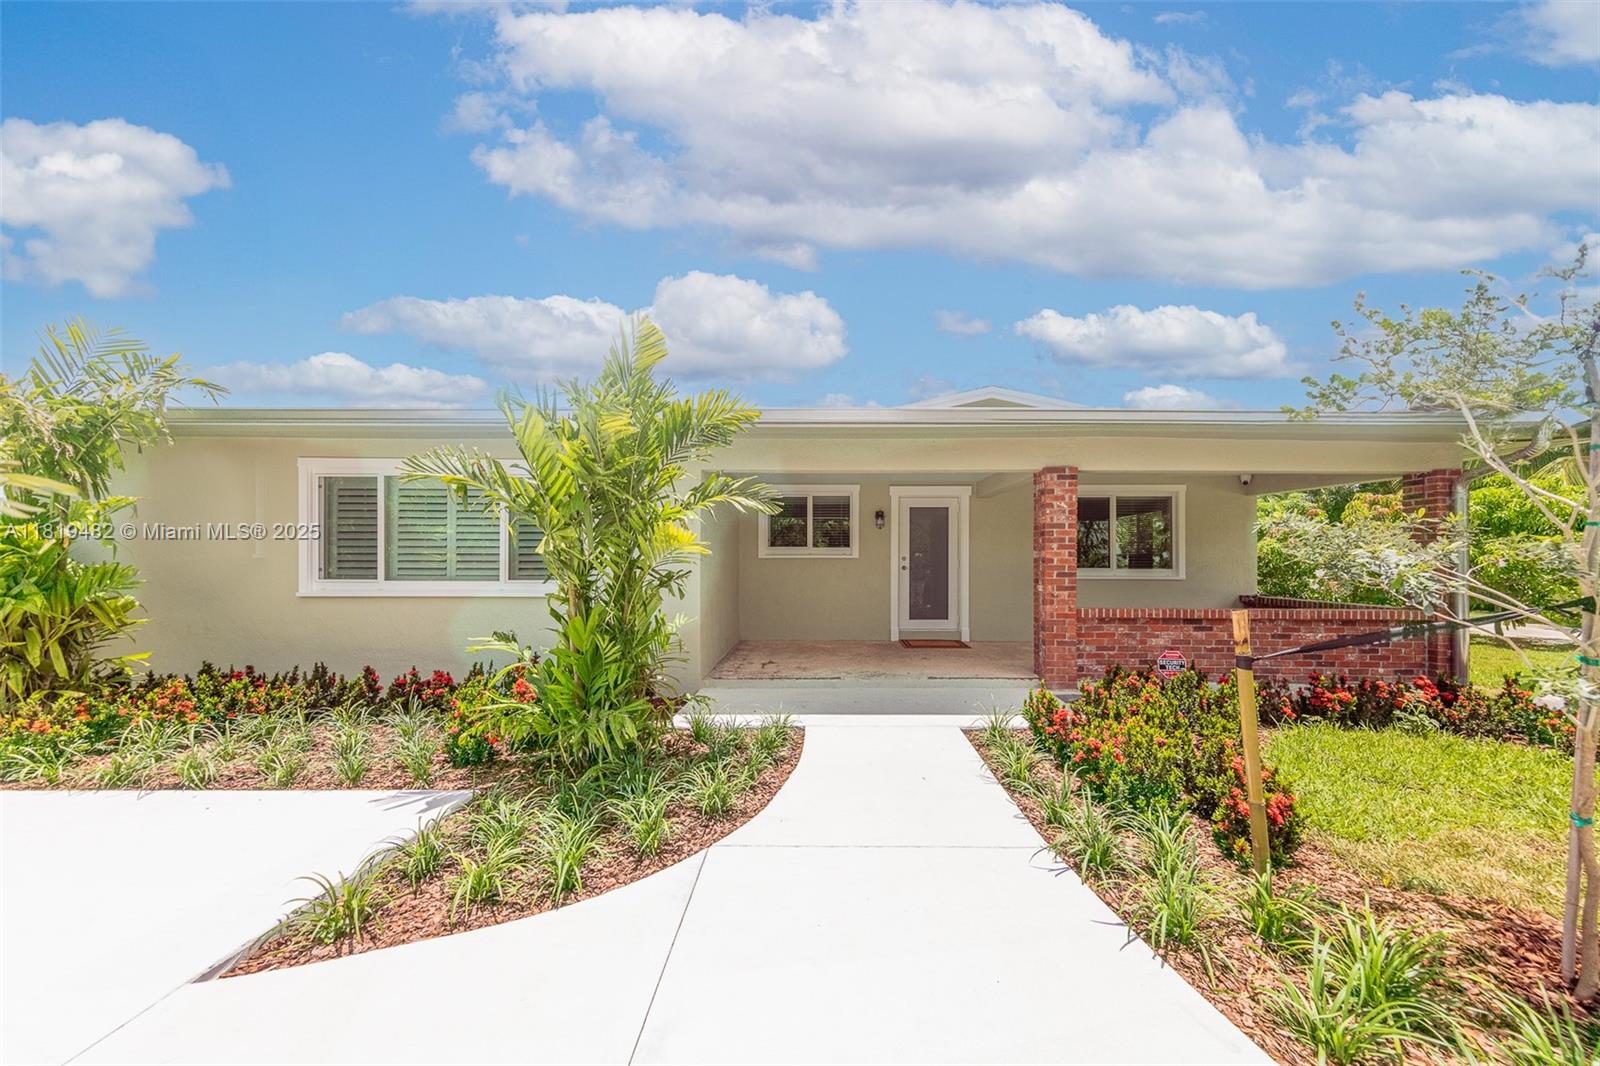
1600 NW 153rd St, Miami Gardens, FL 33054
$-661
Cash flow
-7.3%
Cash-on-Cash Return
4.6%
Cap rate
0.7%
Rent to Value Ratio
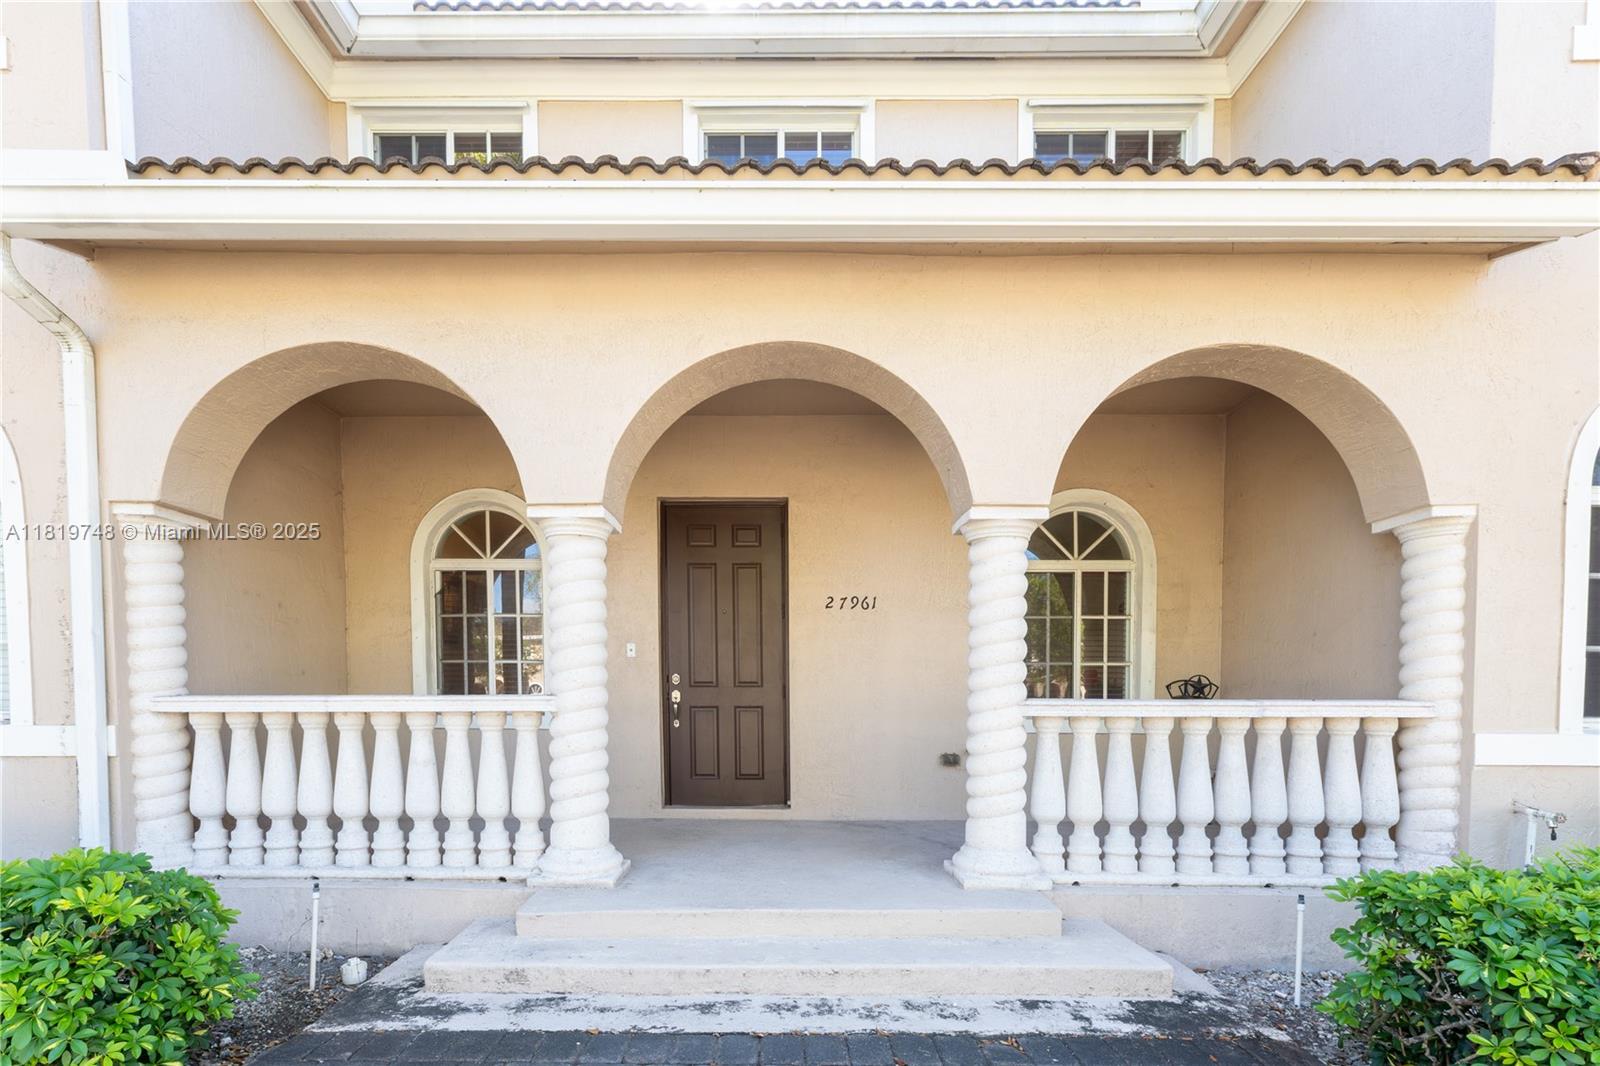
Active
$364,990
2
bds
|
3
ba
|
1,408
sqft
|
built
2006
27961 SW 140th Ave, Homestead, FL 33032
$-726
Cash flow
-10.4%
Cash-on-Cash Return
3.9%
Cap rate
0.7%
Rent to Value Ratio
Active
$9,500,000
5
bds
|
3
ba
|
4,386
sqft
|
built
1957
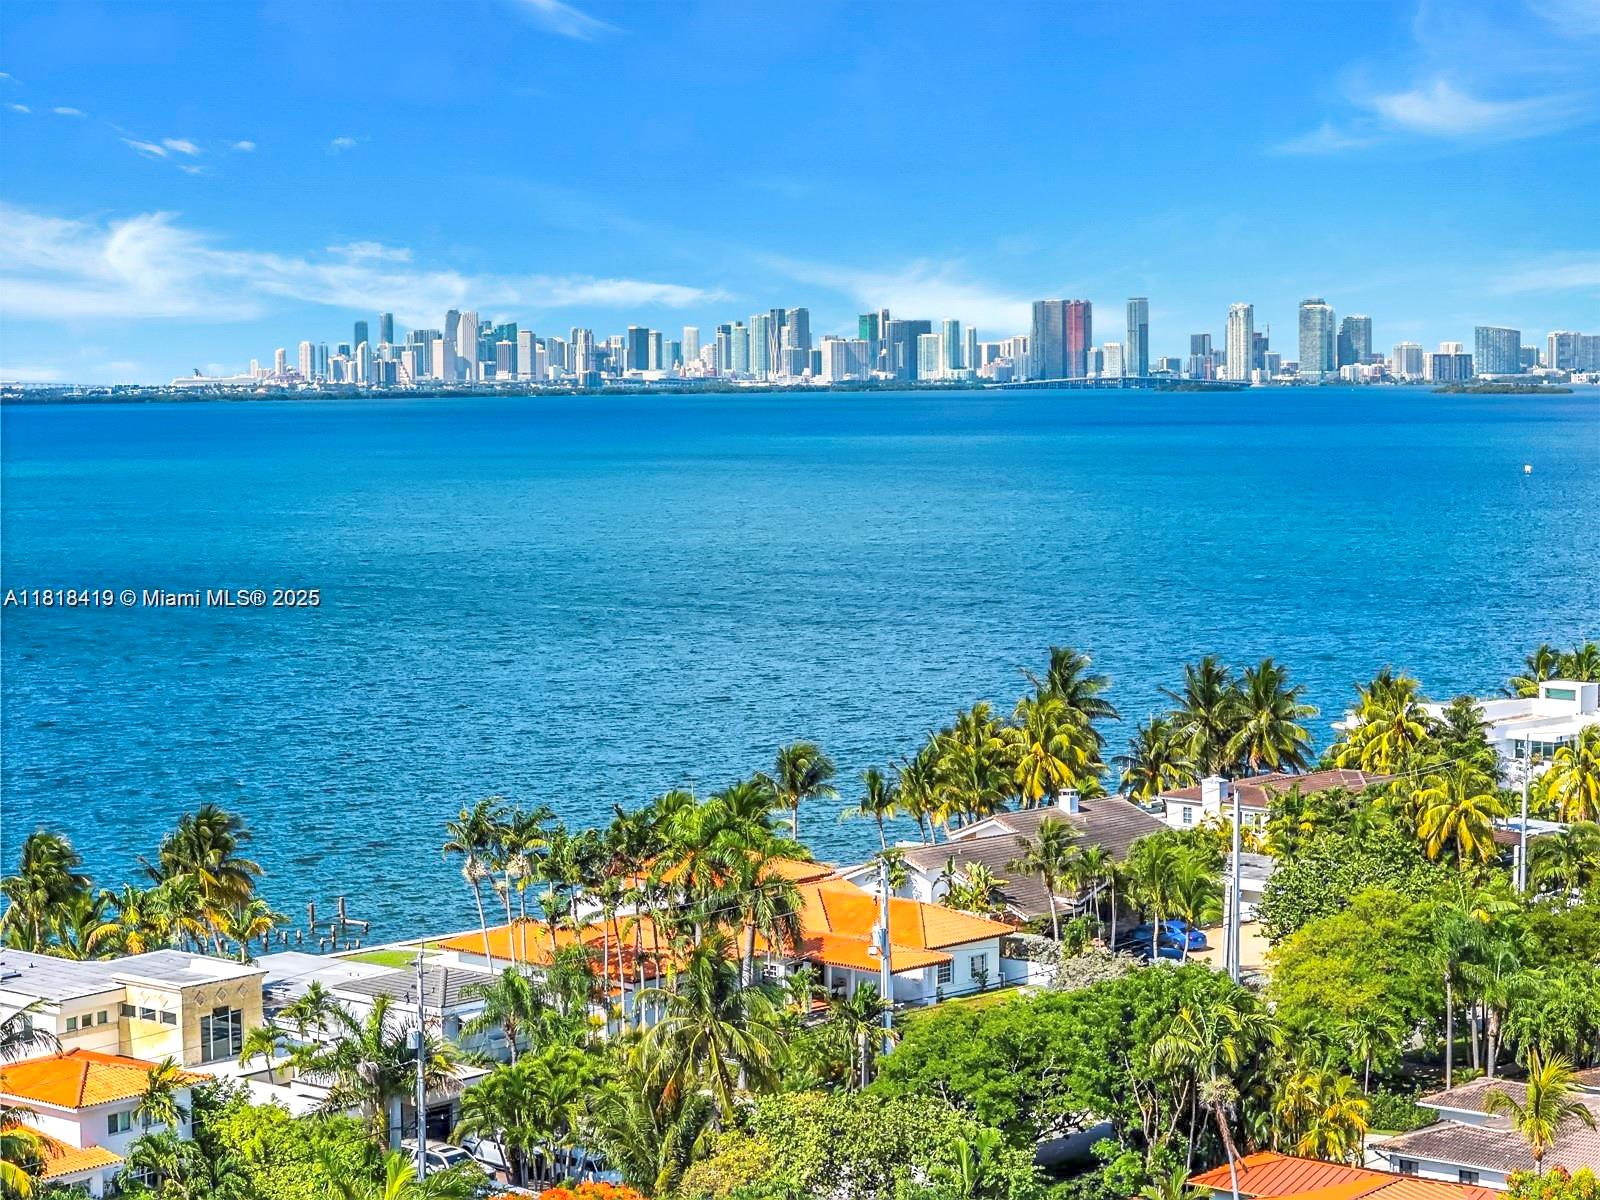
1730 Bay Dr, Miami Beach, FL 33141
$-50,403
Cash flow
-27.7%
Cash-on-Cash Return
-0.1%
Cap rate
0.1%
Rent to Value Ratio
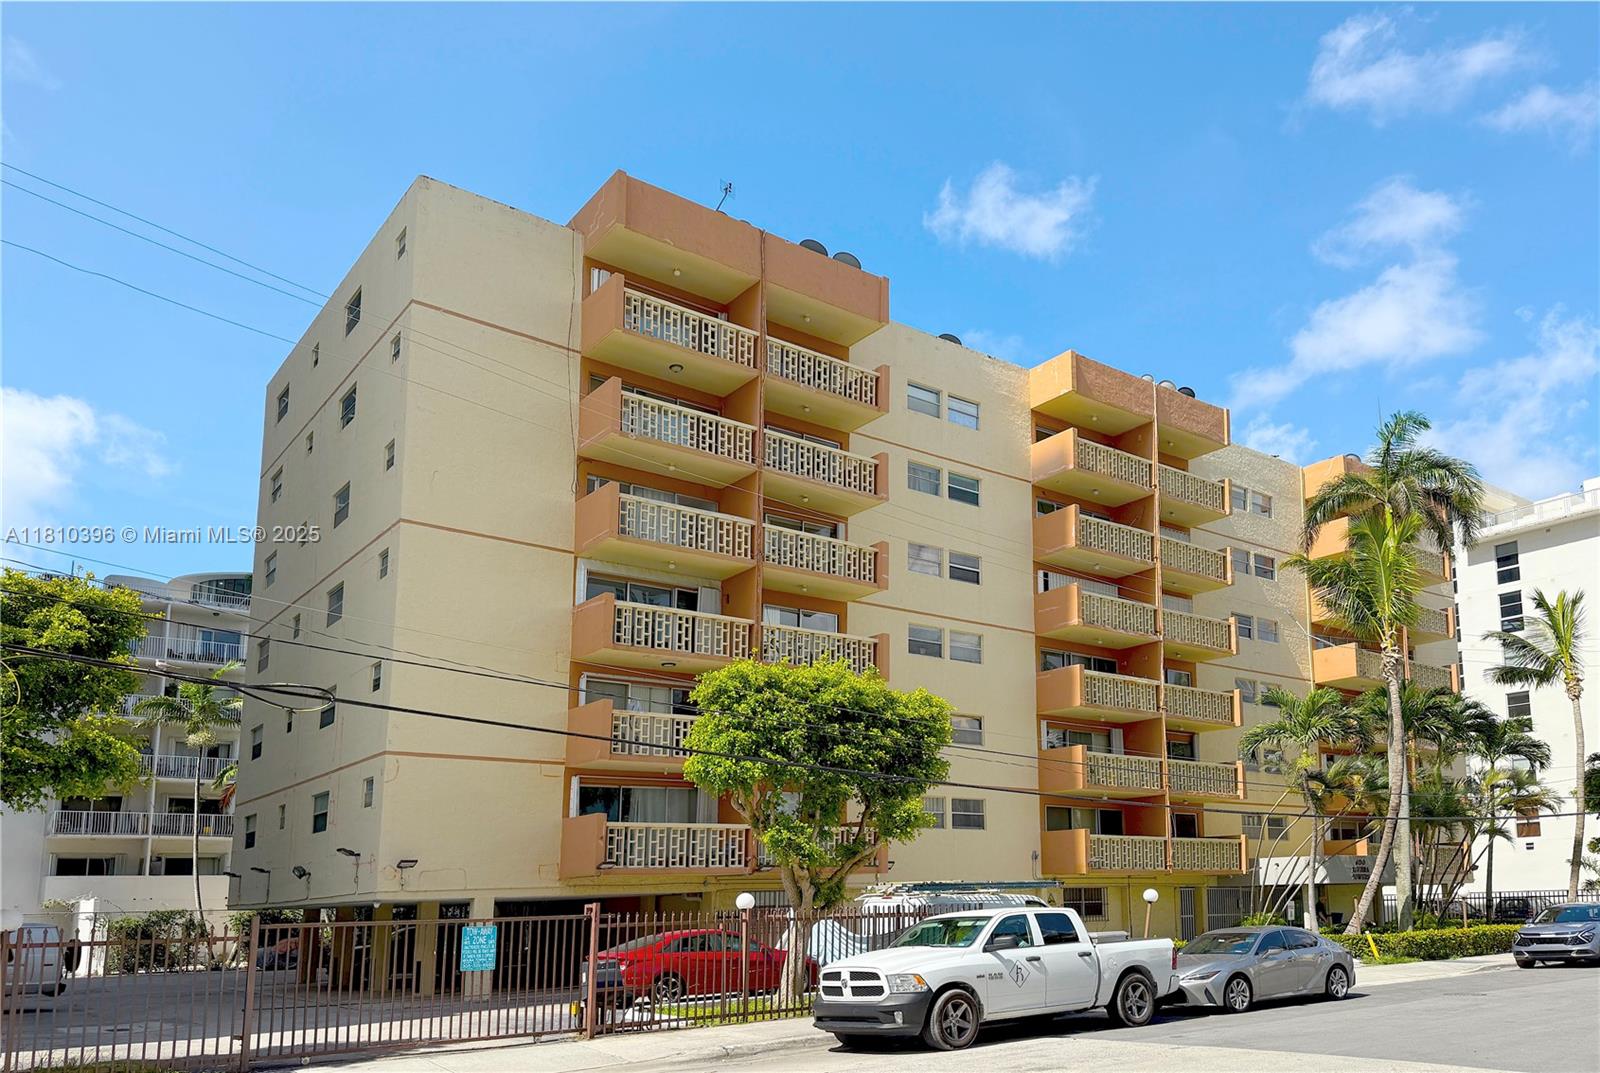
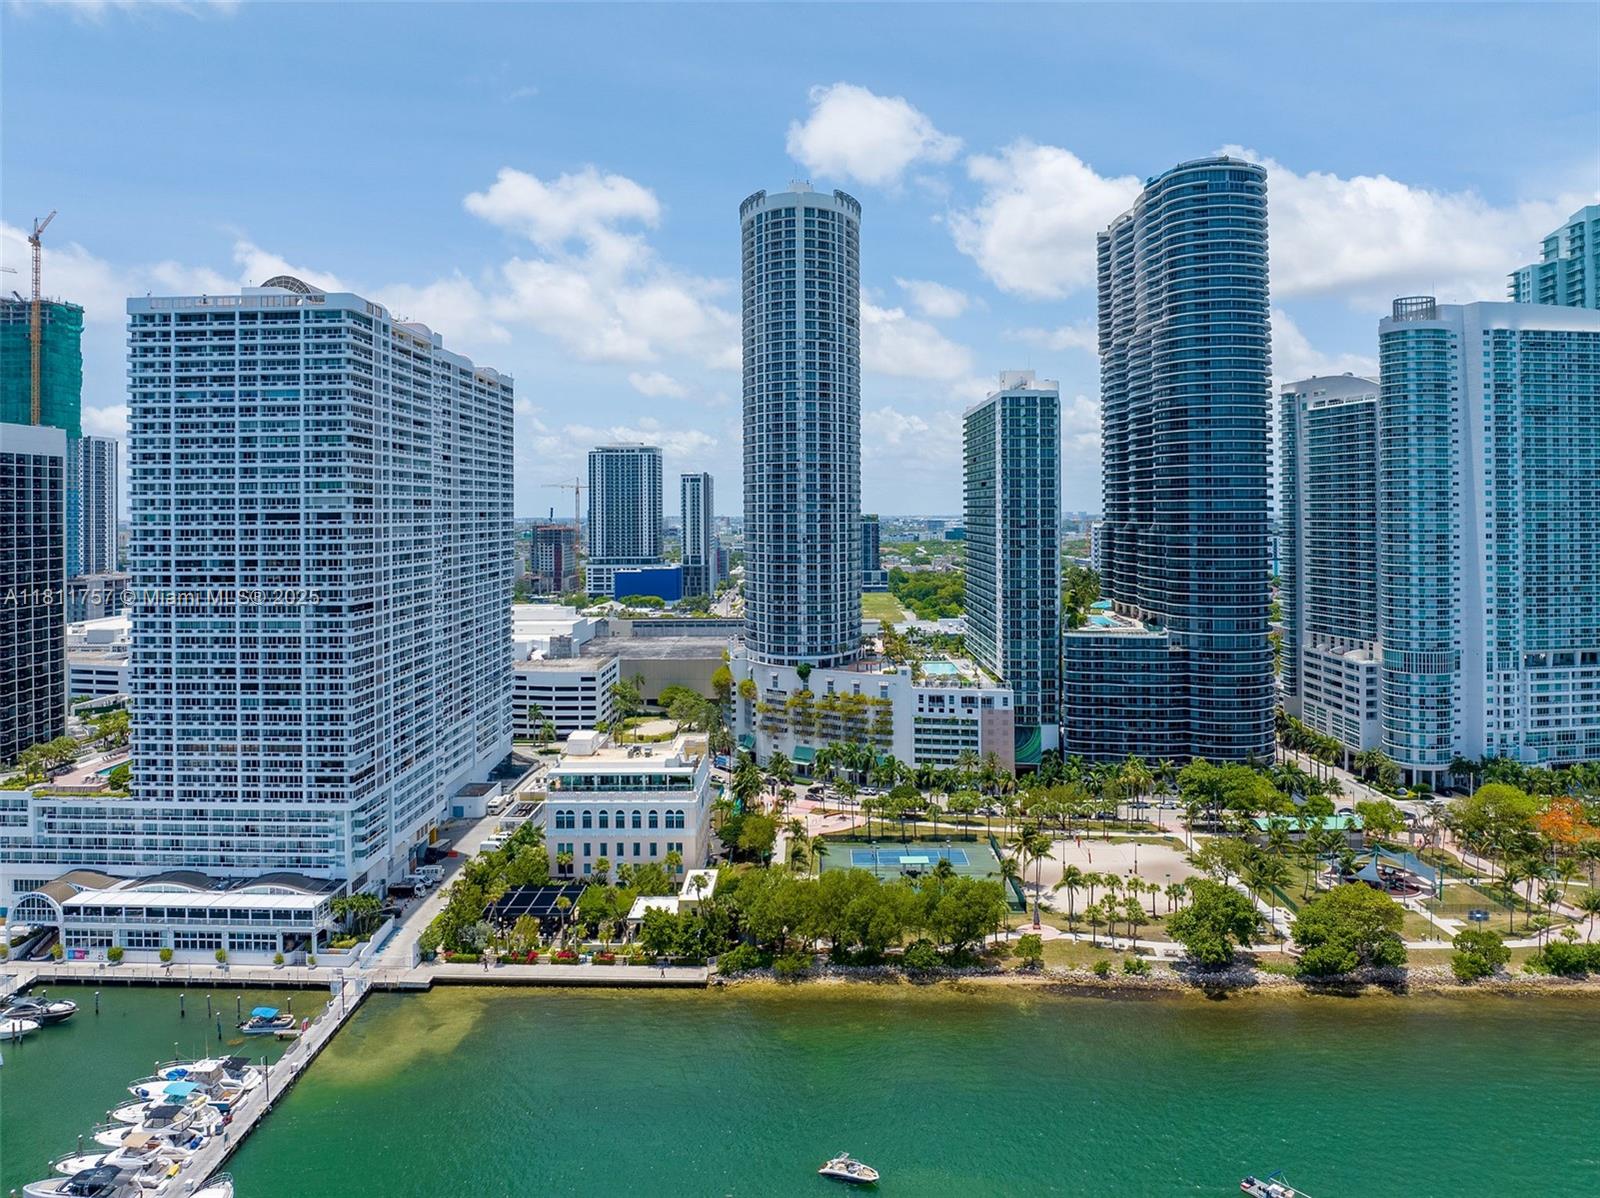
Active
$285,000
1
bds
|
1
ba
|
728
sqft
|
built
1974
600 NE 25th St, Miami, FL 33137
$-998
Cash flow
-18.3%
Cash-on-Cash Return
2.1%
Cap rate
0.8%
Rent to Value Ratio
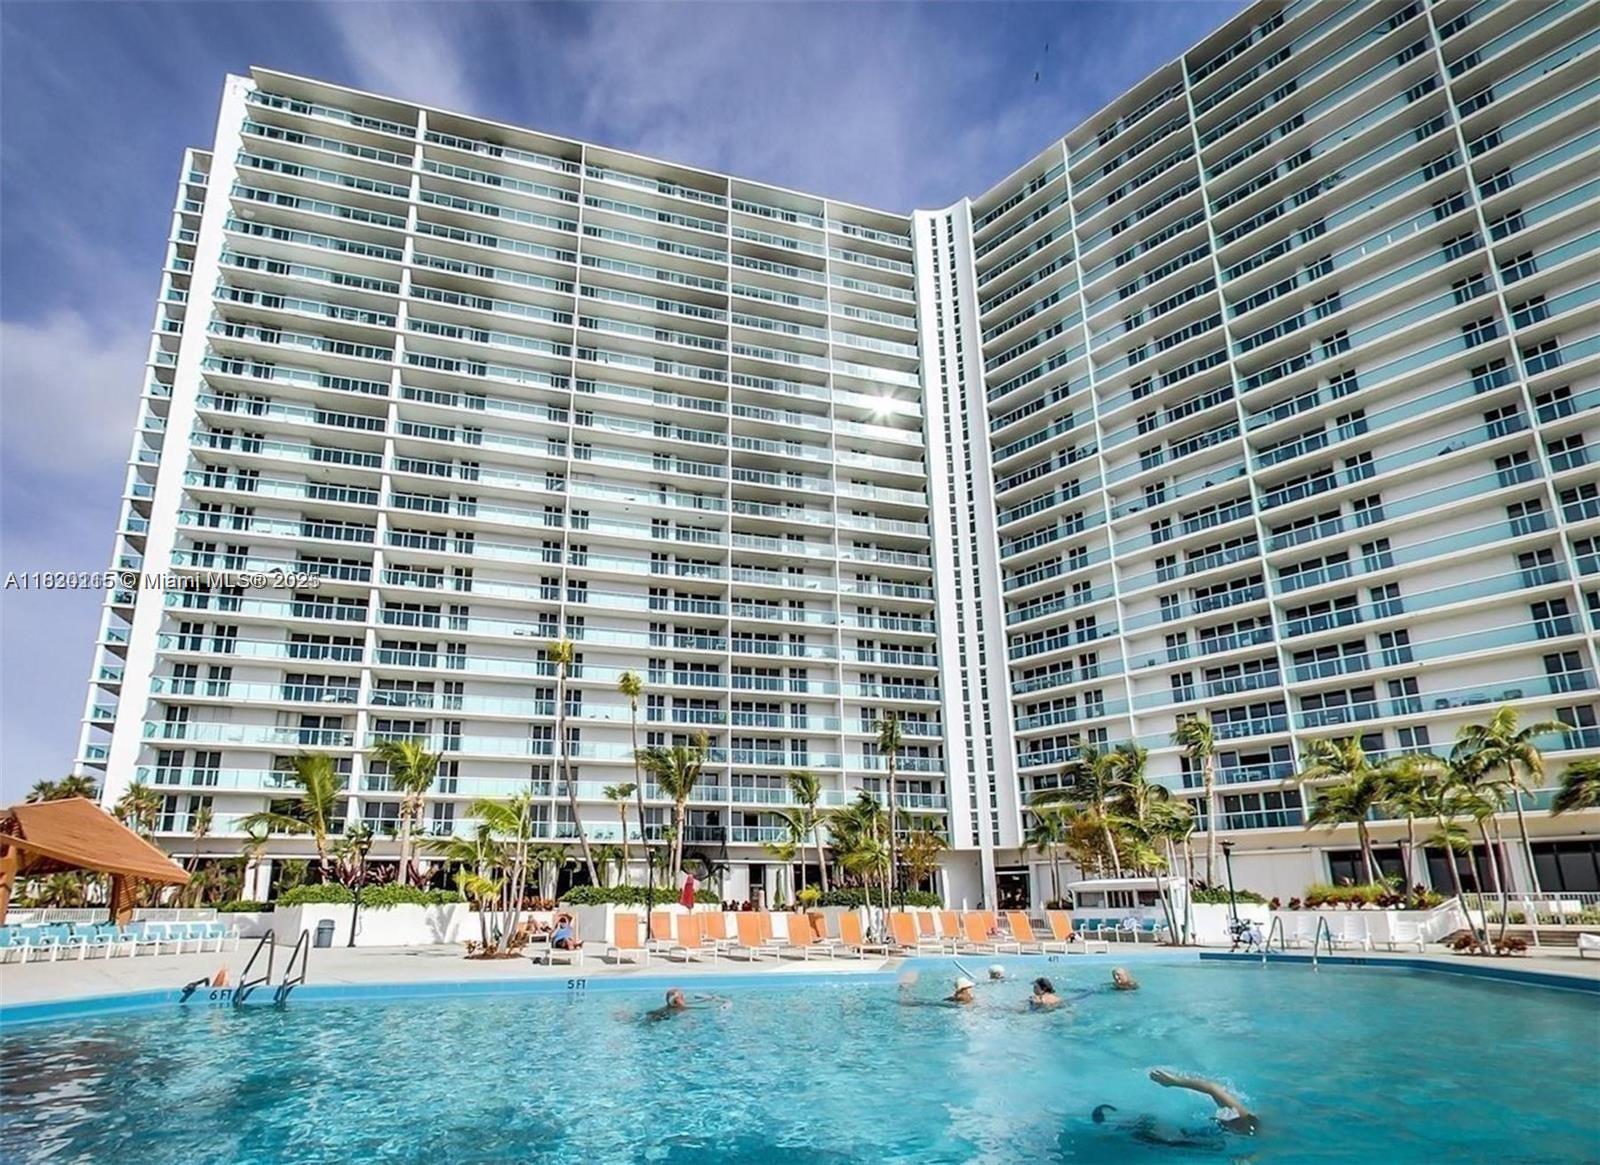
Active
$2,389,000
3
bds
|
5
ba
|
3,774
sqft
|
built
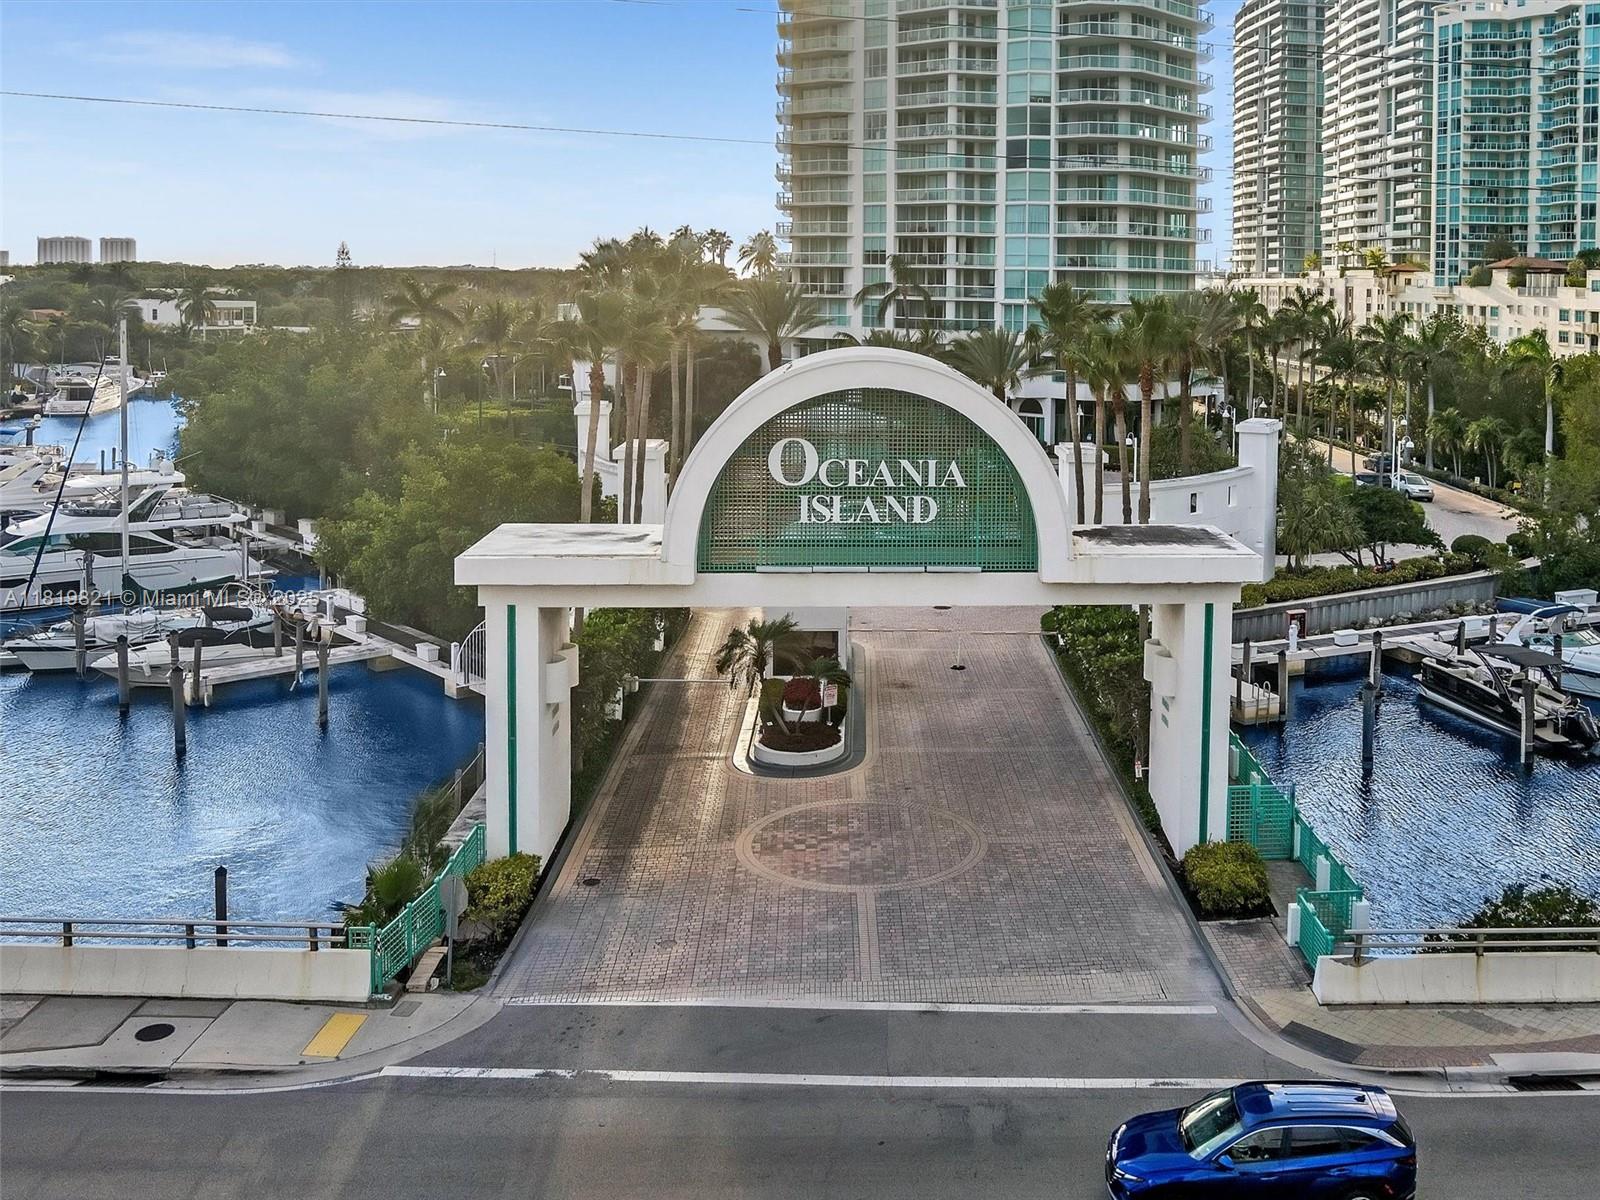
2002
16500 Collins Ave, Sunny Isles Beach, FL 33160
$-10,683
Cash flow
-23.3%
Cash-on-Cash Return
0.9%
Cap rate
0.4%
Rent to Value Ratio
Active
$1,165,000
3
bds
|
4
ba
|
1,776
sqft
|
built
1972
15430 SW 260th St, Homestead, FL 33032
$-4,223
Cash flow
-18.9%
Cash-on-Cash Return
1.9%
Cap rate
0.3%
Rent to Value Ratio
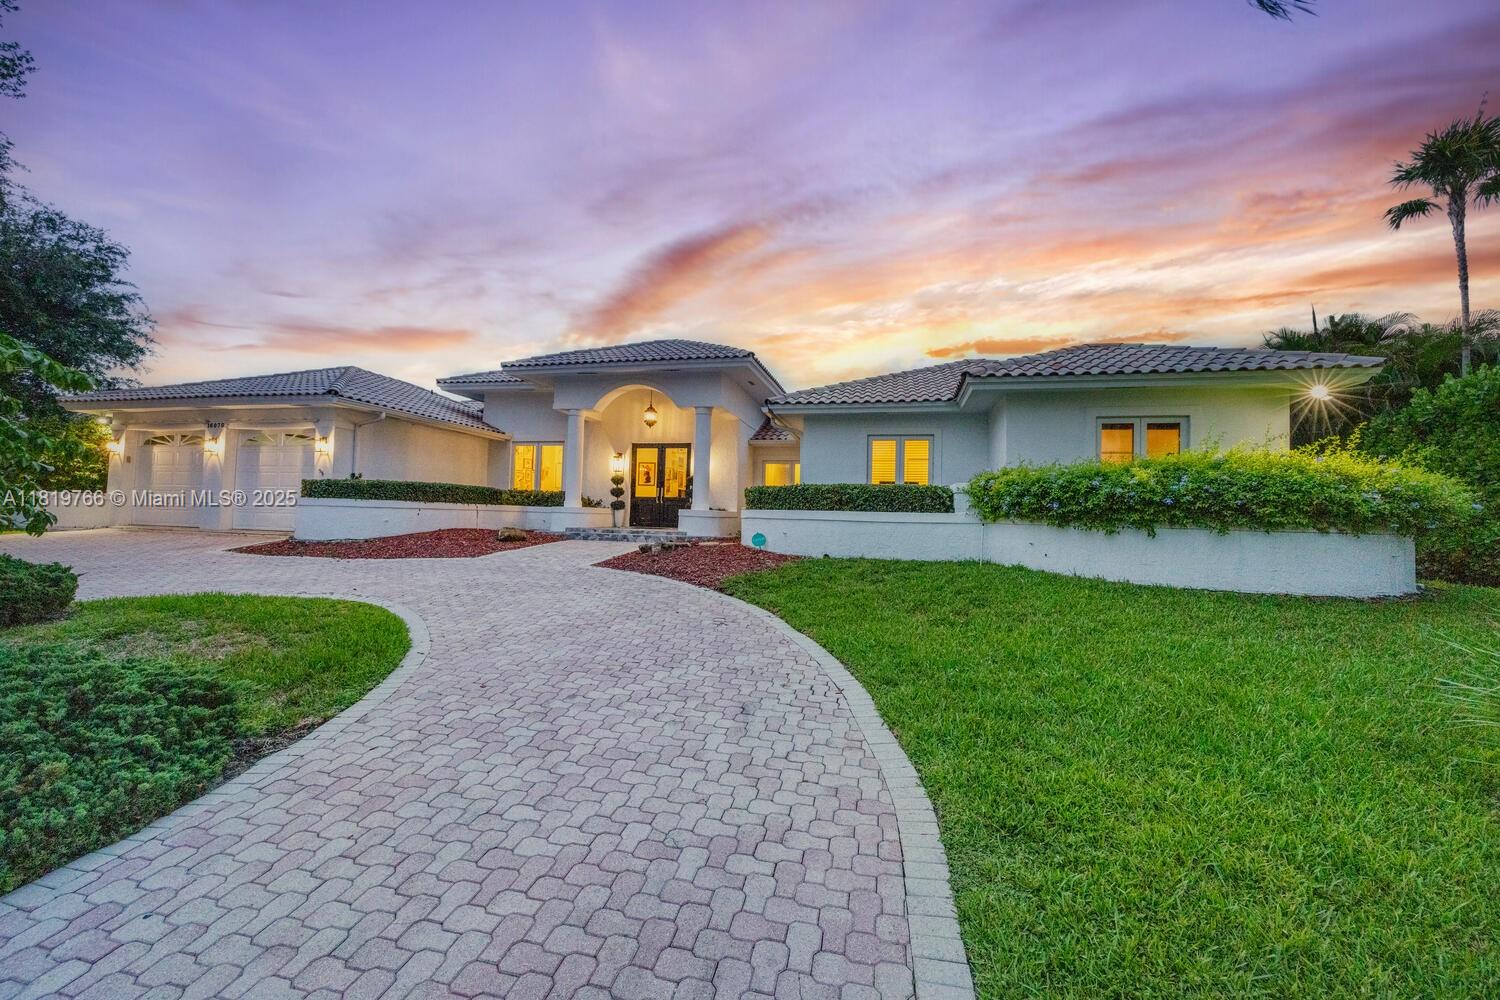
Active
$2,099,000
5
bds
|
5
ba
|
3,426
sqft
|
built
1990
16070 SW 77th Ct, Palmetto Bay, FL 33157
$-5,516
Cash flow
-13.7%
Cash-on-Cash Return
3.1%
Cap rate
0.4%
Rent to Value Ratio
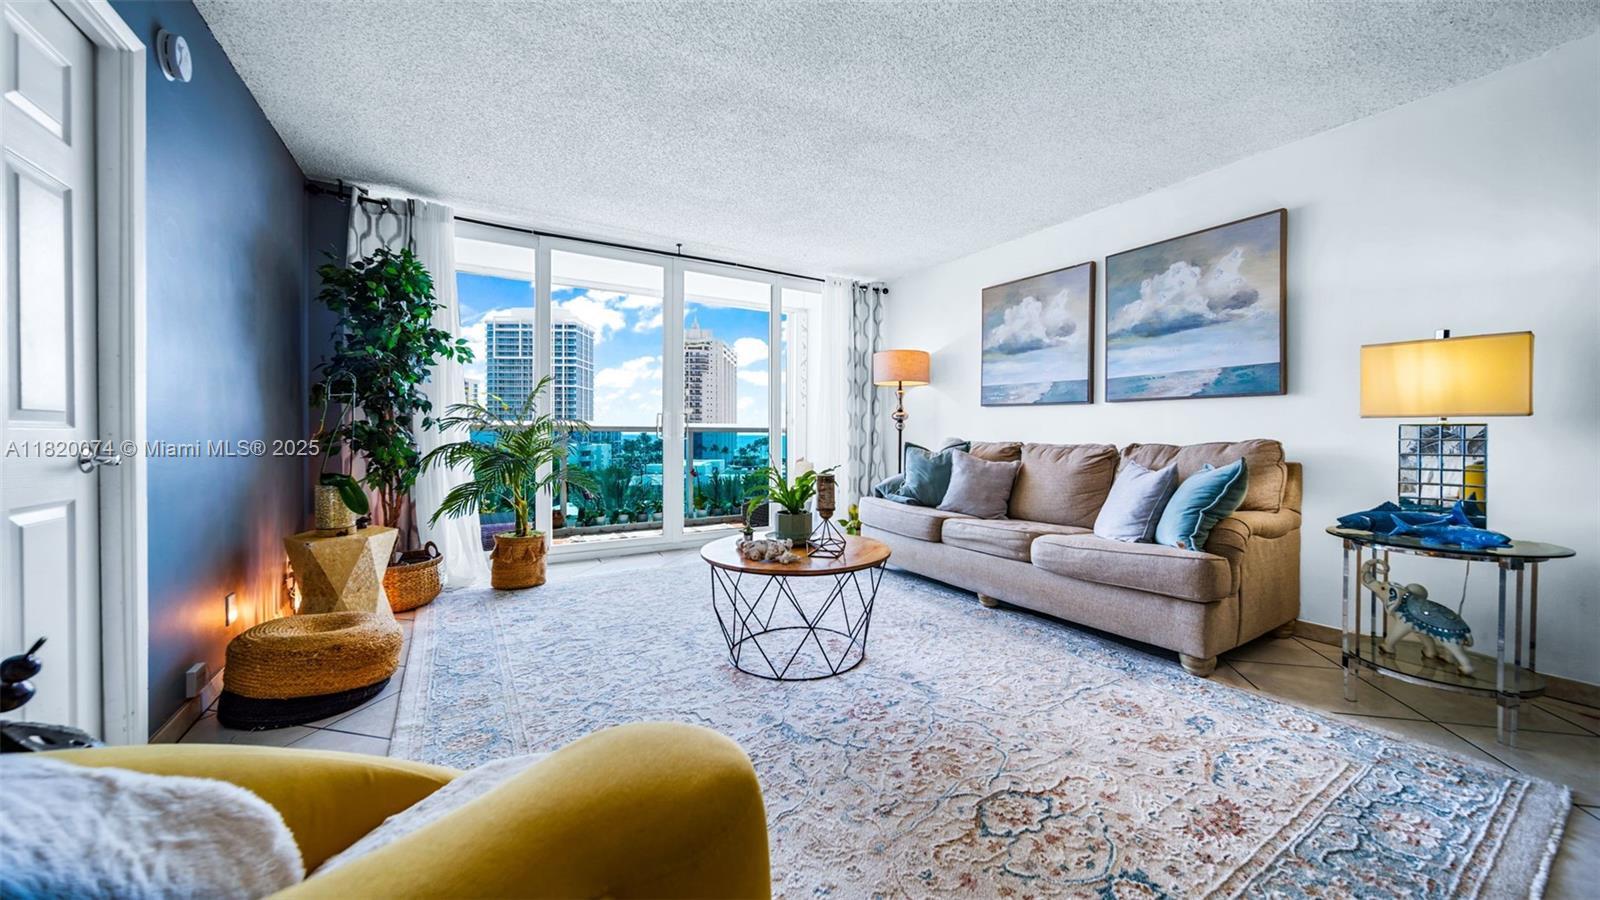
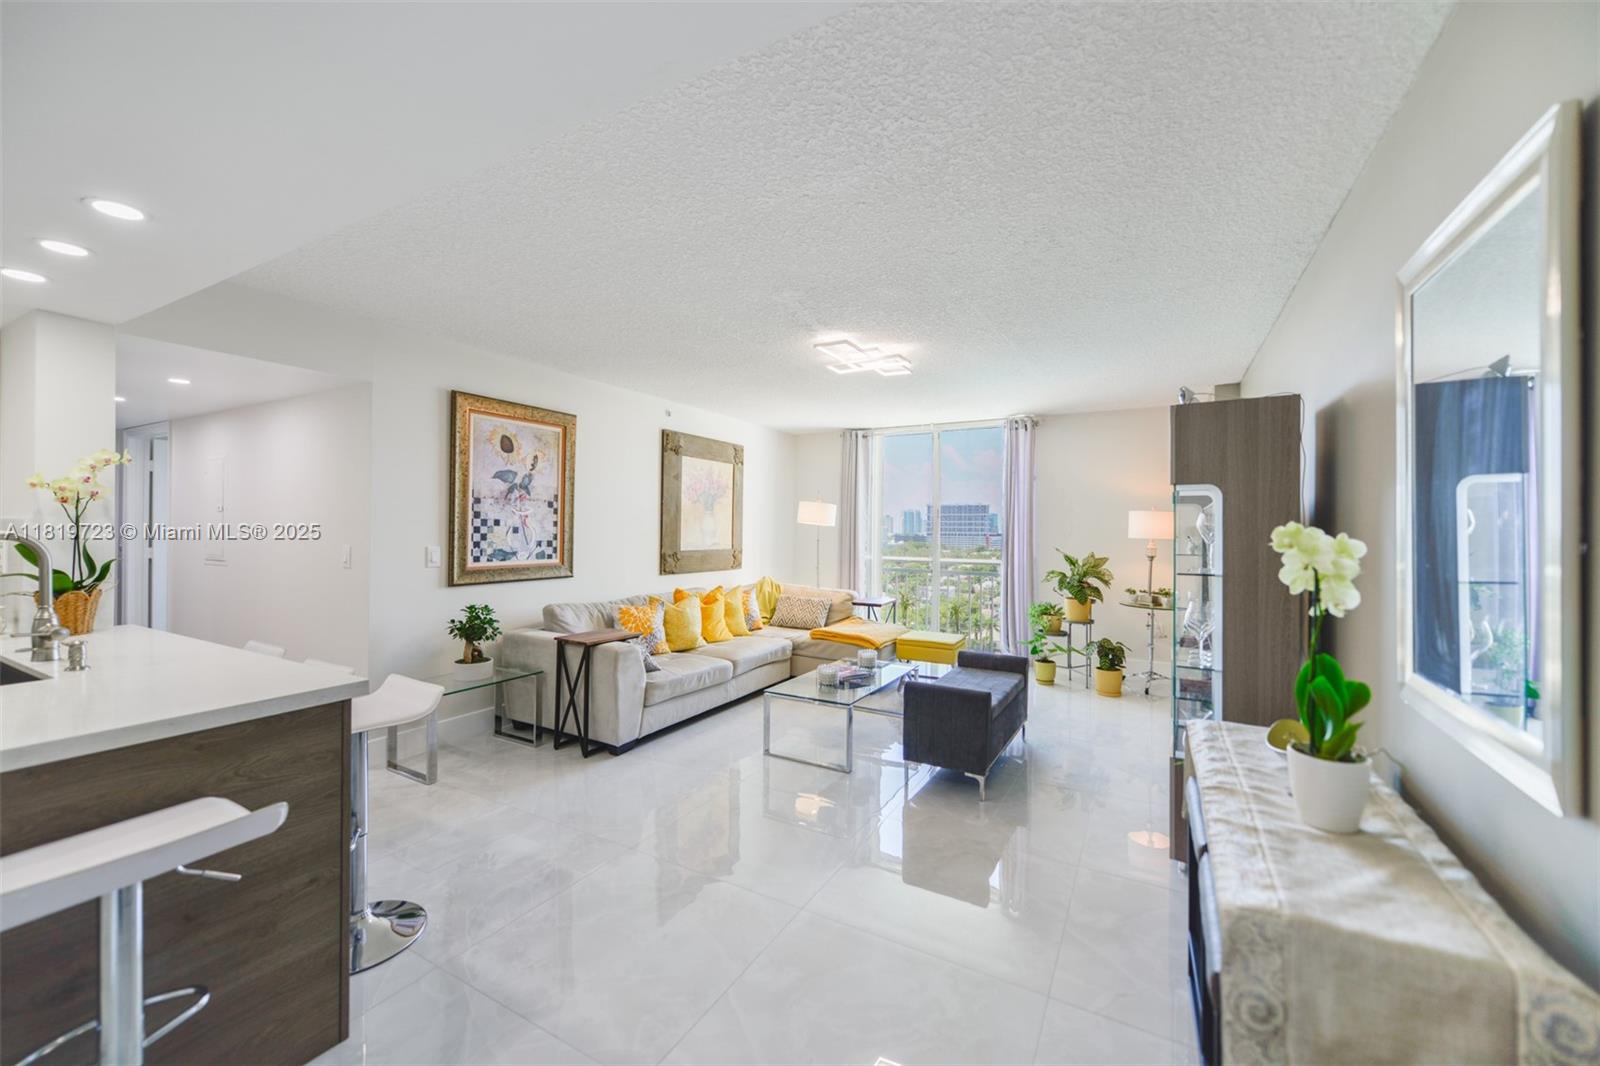
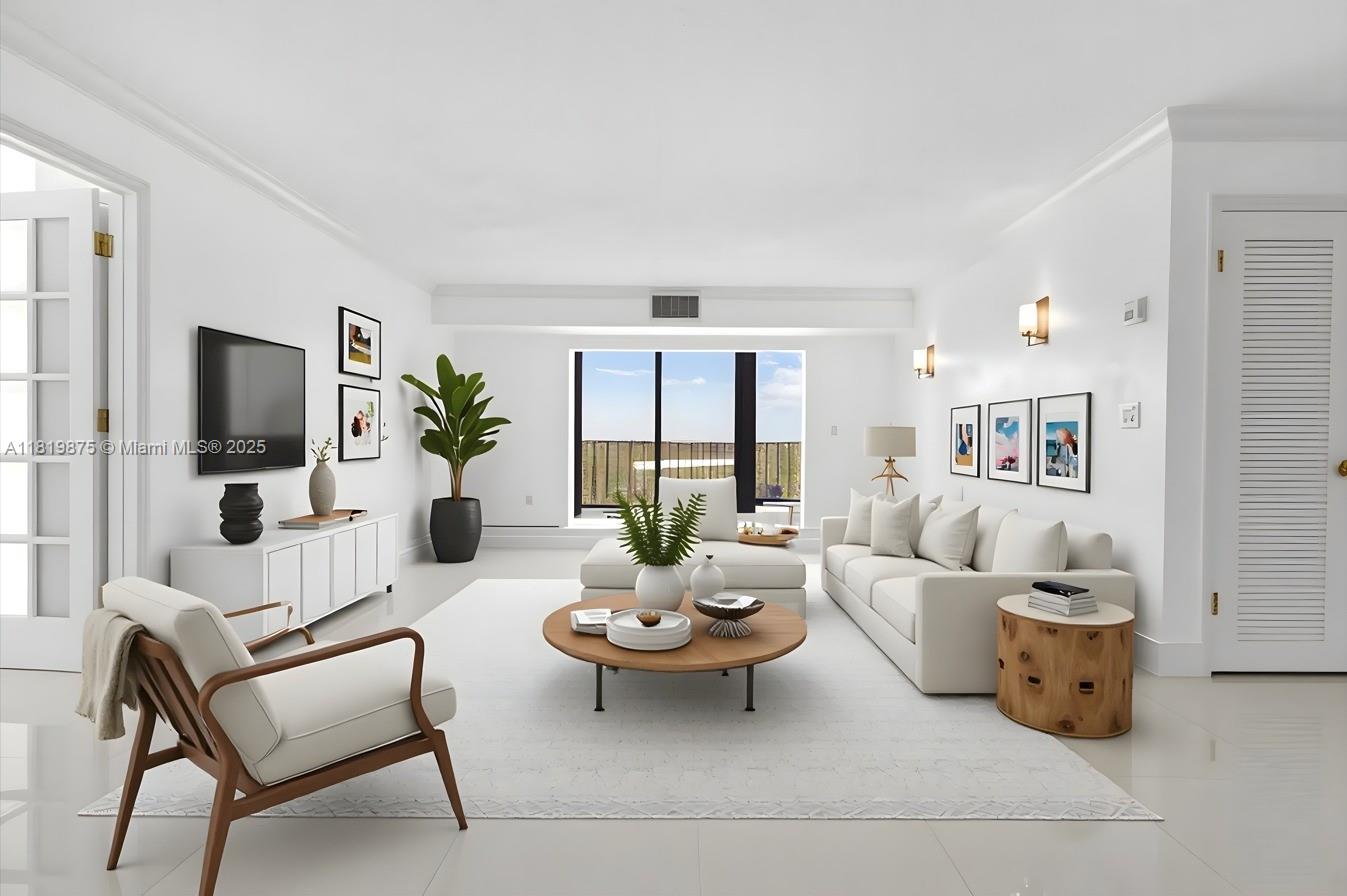
Active
$530,000
1
bds
|
1
ba
|
636
sqft
|
built
2020
3900 Biscayne Blvd, Miami, FL 33137
$-1,090
Cash flow
-10.7%
Cash-on-Cash Return
3.8%
Cap rate
0.8%
Rent to Value Ratio
Active
$997,000
8
bds
|
7
ba
|
4,272
sqft
|
built
1955
236 E 56th St, Hialeah, FL 33013
$-2,779
Cash flow
-14.5%
Cash-on-Cash Return
2.9%
Cap rate
0.5%
Rent to Value Ratio
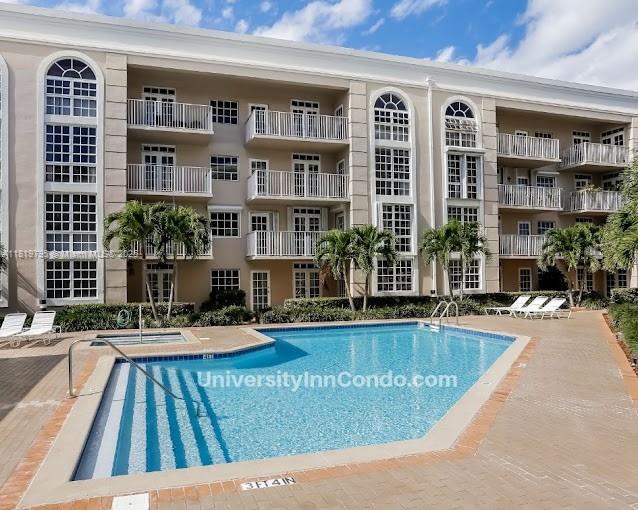
Active
$499,900
1
bds
|
2
ba
|
991
sqft
|
built
1975
100 Bayview Dr, Sunny Isles Beach, FL 33160
$-2,254
Cash flow
-23.5%
Cash-on-Cash Return
0.9%
Cap rate
0.6%
Rent to Value Ratio
Active
$215,000
1
bds
|
1
ba
|
709
sqft
|
built
1968
10816 SW 88th St, Miami, FL 33176
$-409
Cash flow
-9.9%
Cash-on-Cash Return
4.0%
Cap rate
0.9%
Rent to Value Ratio
Active
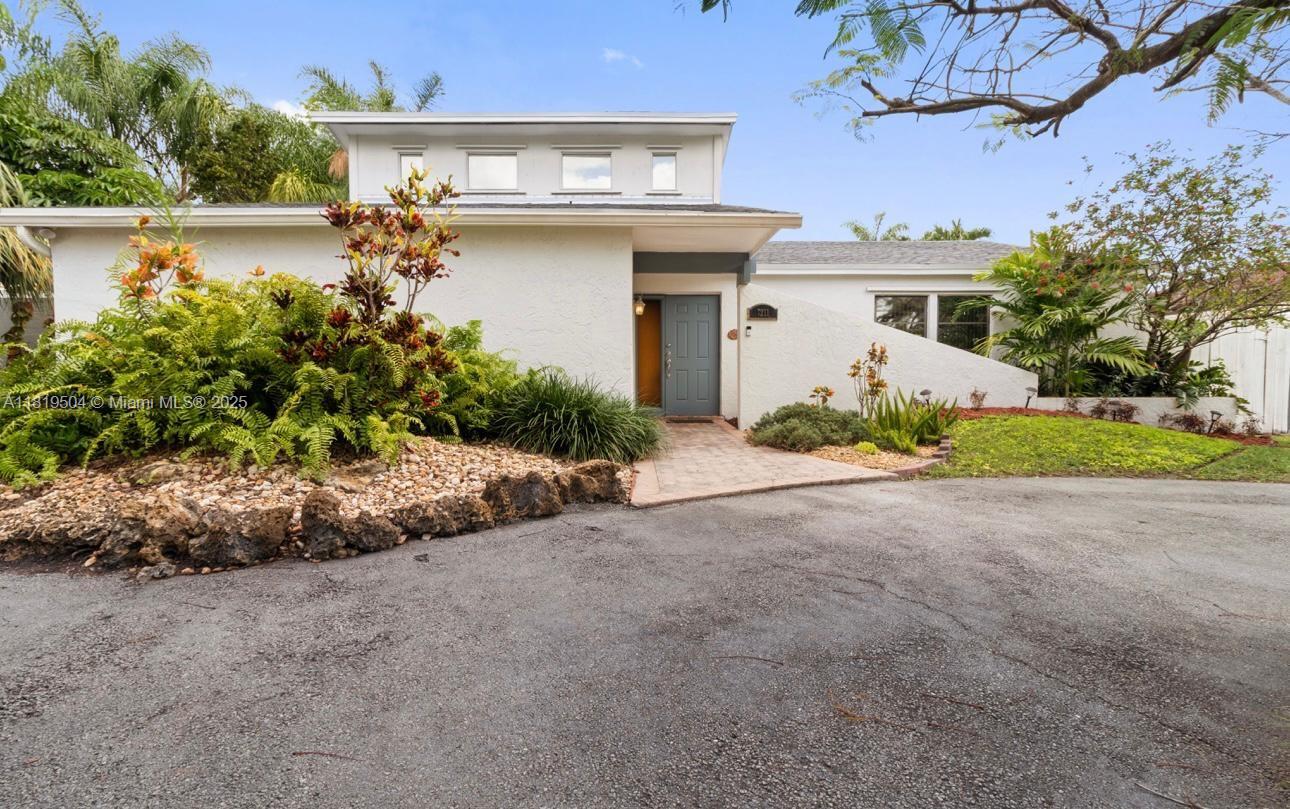
$790,000
3
bds
|
2
ba
|
1,990
sqft
|
built
1978
7211 SW 100th Ct, Miami, FL 33173
$-1,740
Cash flow
-11.5%
Cash-on-Cash Return
3.6%
Cap rate
0.5%
Rent to Value Ratio
Active
$400,000
1
bds
|
2
ba
|
810
sqft
|
built
2000
8888 Collins Ave, Surfside, FL 33154
$-1,431
Cash flow
-18.7%
Cash-on-Cash Return
2.0%
Cap rate
0.6%
Rent to Value Ratio
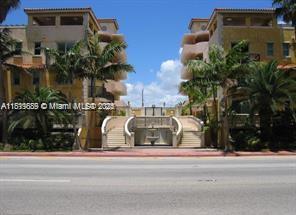
Active
$399,000
1
bds
|
2
ba
|
910
sqft
|
built
1968
6770 Indian Creek Dr, Miami Beach, FL 33141
$-1,312
Cash flow
-17.2%
Cash-on-Cash Return
2.3%
Cap rate
0.8%
Rent to Value Ratio
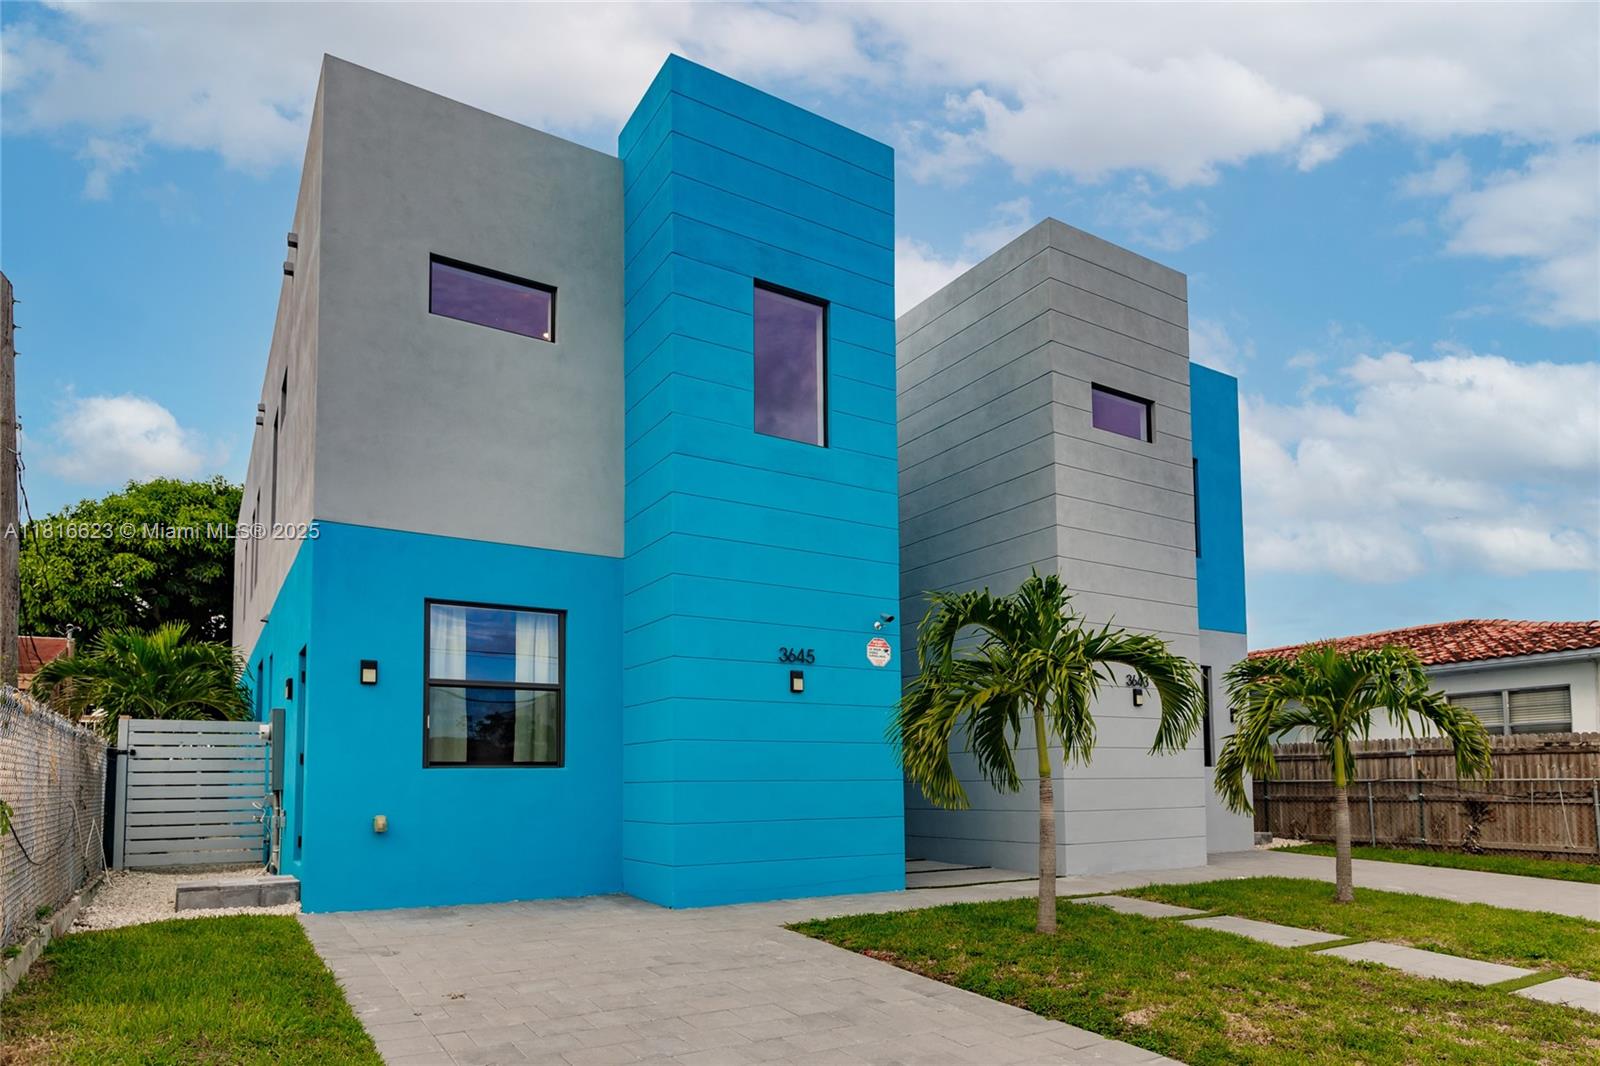
Active
$2,399,000
4
bds
|
0
ba
|
4,436
sqft
|
built
2021
3645 SW 3rd St, Miami, FL 33135
$-11,246
Cash flow
-24.5%
Cash-on-Cash Return
0.7%
Cap rate
0.2%
Rent to Value Ratio
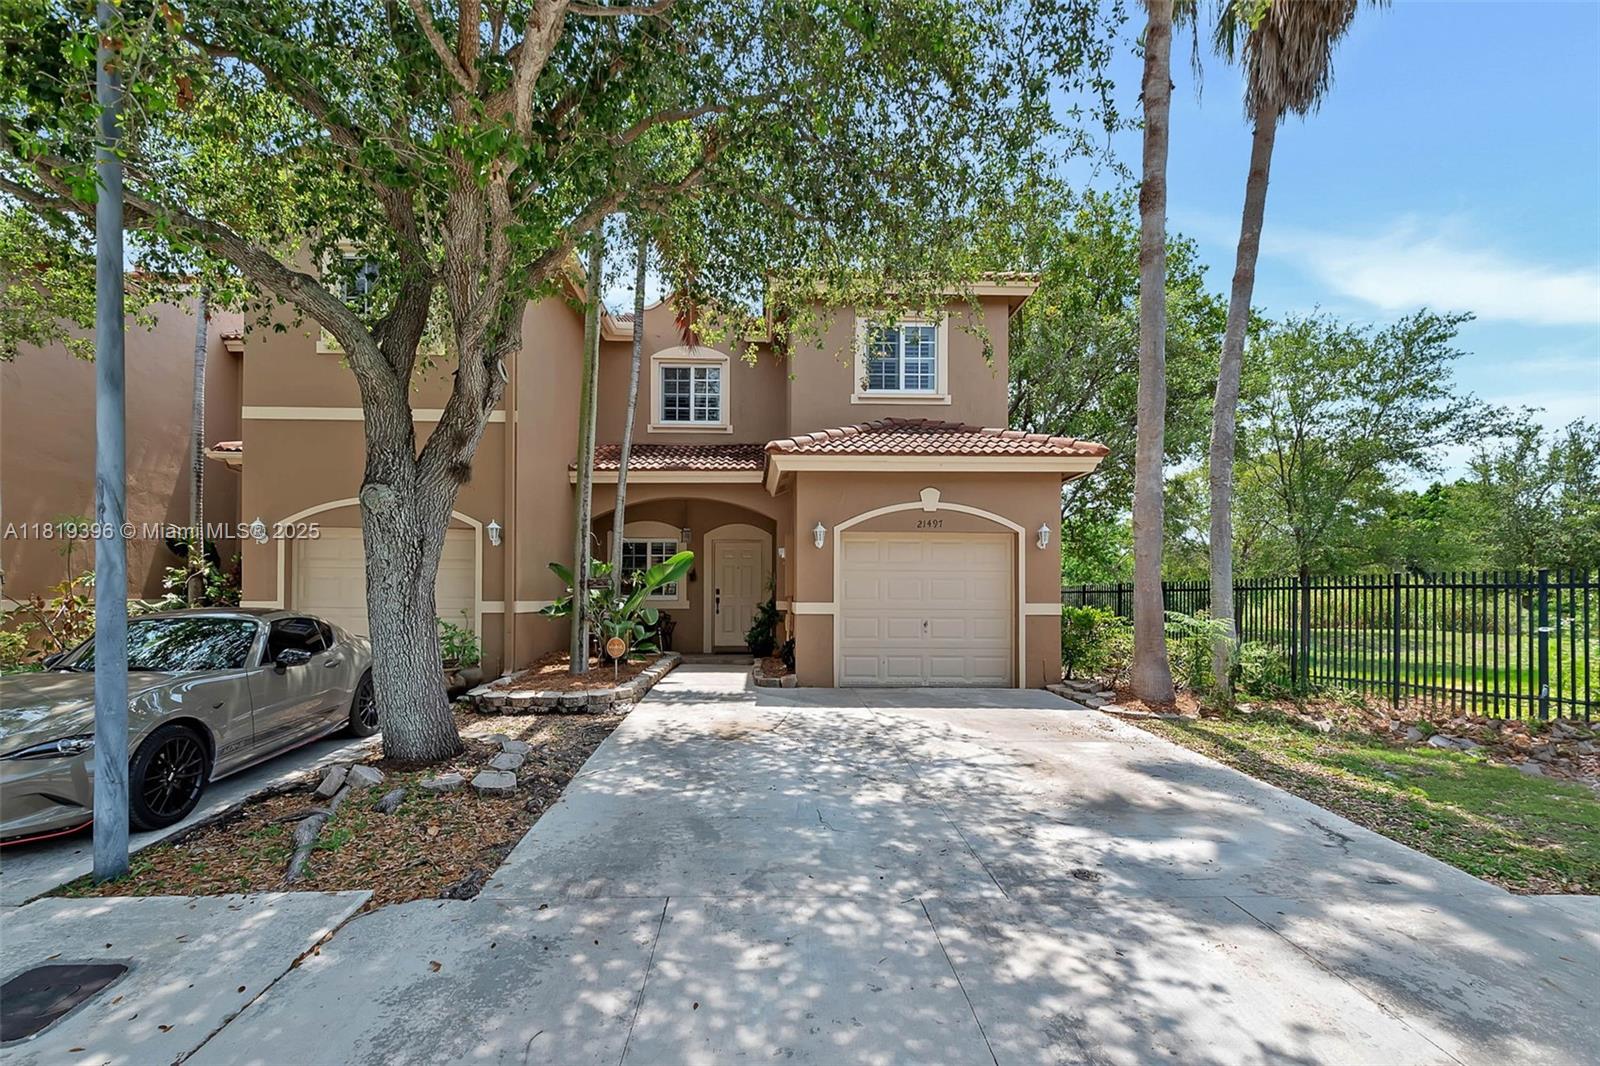
Active
$499,000
3
bds
|
3
ba
|
1,504
sqft
|
built
2005
21497 SW 85th Ave, Cutler Bay, FL 33189
$-1,231
Cash flow
-12.9%
Cash-on-Cash Return
3.3%
Cap rate
0.6%
Rent to Value Ratio
Active
$299,900
1
bds
|
1
ba
|
775
sqft
|
built
1983
650 NE 64th St, Miami, FL 33138
$-1,132
Cash flow
-19.7%
Cash-on-Cash Return
1.8%
Cap rate
0.8%
Rent to Value Ratio
Active
$530,000
2
bds
|
2
ba
|
1,085
sqft
|
built
2003
3000 Coral Way, Coral Gables, FL 33145
$-1,938
Cash flow
-19.1%
Cash-on-Cash Return
1.9%
Cap rate
0.6%
Rent to Value Ratio
Active
$635,000
3
bds
|
2
ba
|
1,435
sqft
|
built
1988
12548 SW 210th St, Miami, FL 33177
$-740
Cash flow
-6.1%
Cash-on-Cash Return
4.9%
Cap rate
0.6%
Rent to Value Ratio
Active
$465,564
2
bds
|
2
ba
|
840
sqft
|
built
1990
1280 S Alhambra Cir, Coral Gables, FL 33146
$-1,586
Cash flow
-17.8%
Cash-on-Cash Return
2.2%
Cap rate
0.6%
Rent to Value Ratio

Active
$2,299,000
5
bds
|
6
ba
|
4,067
sqft
|
built
2021
10459 NW 68th Ter, Doral, FL 33178
$-7,898
Cash flow
-17.9%
Cash-on-Cash Return
2.2%
Cap rate
0.5%
Rent to Value Ratio
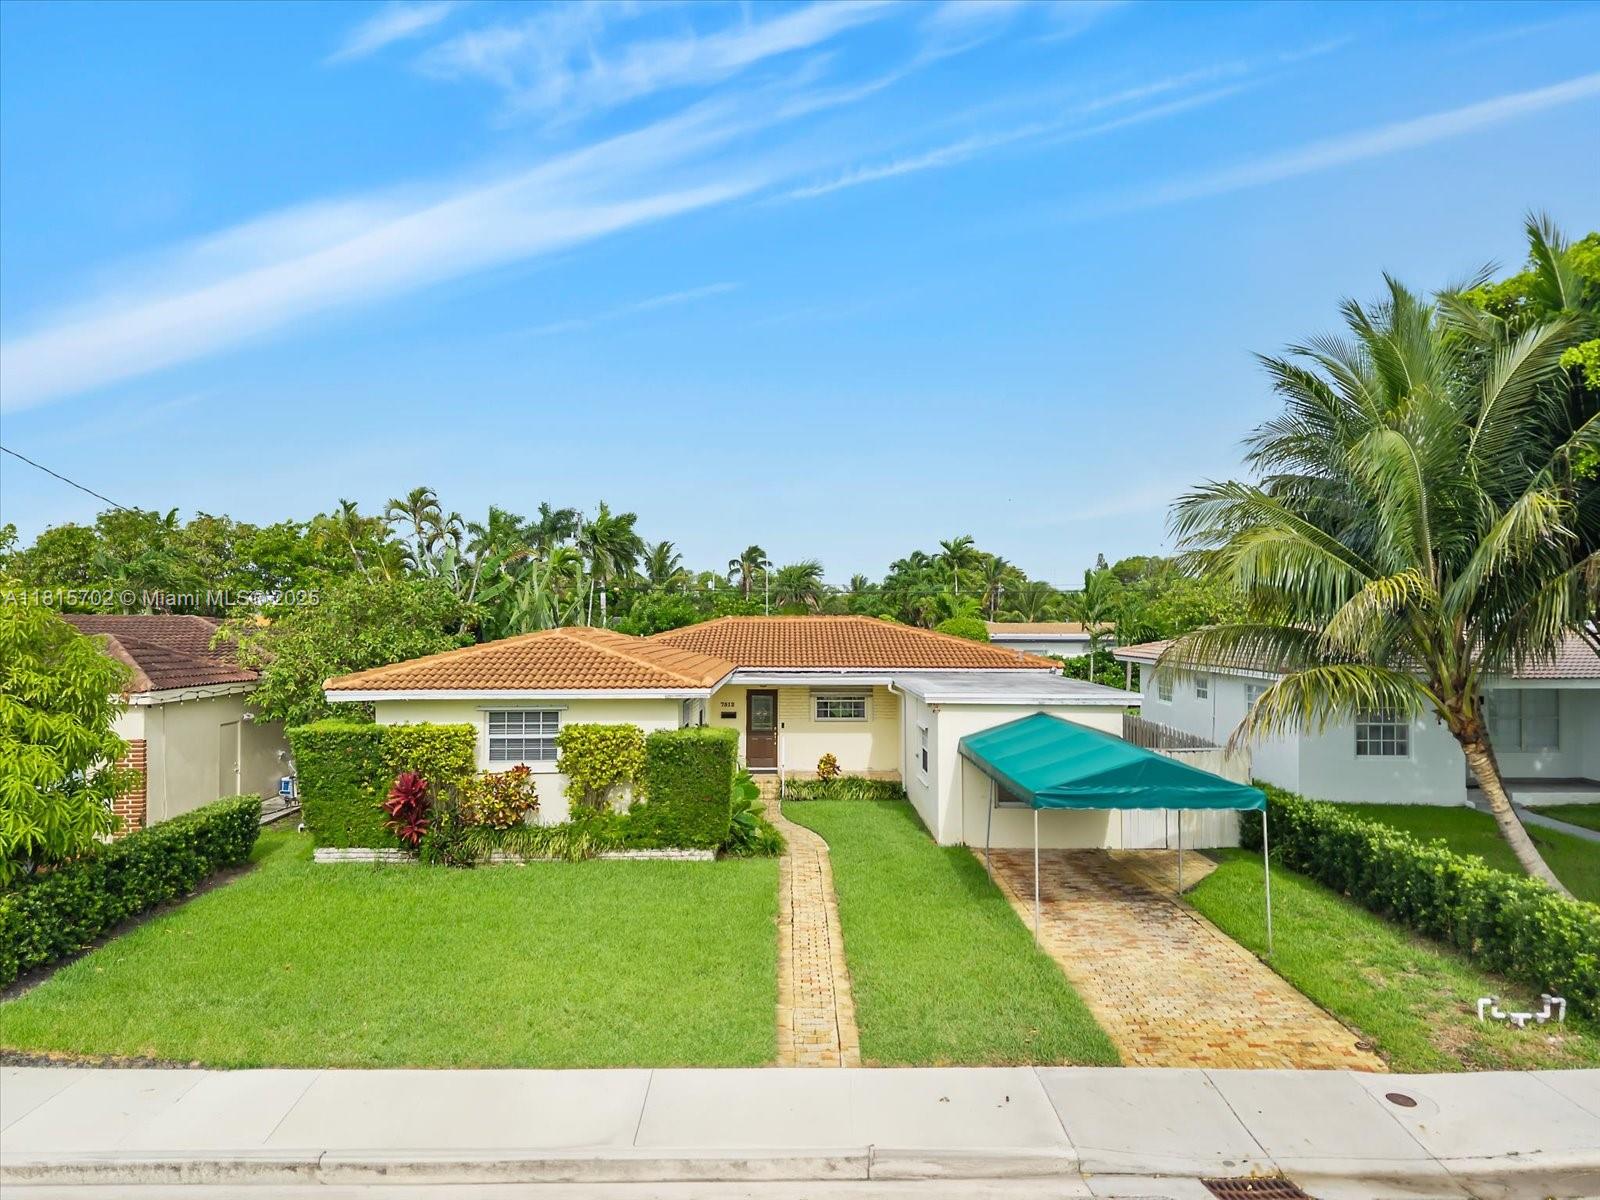
Active
$950,000
3
bds
|
2
ba
|
1,571
sqft
|
built
1951
7512 Mutiny Ave, North Bay Village, FL 33141
$-2,091
Cash flow
-11.5%
Cash-on-Cash Return
3.6%
Cap rate
0.7%
Rent to Value Ratio
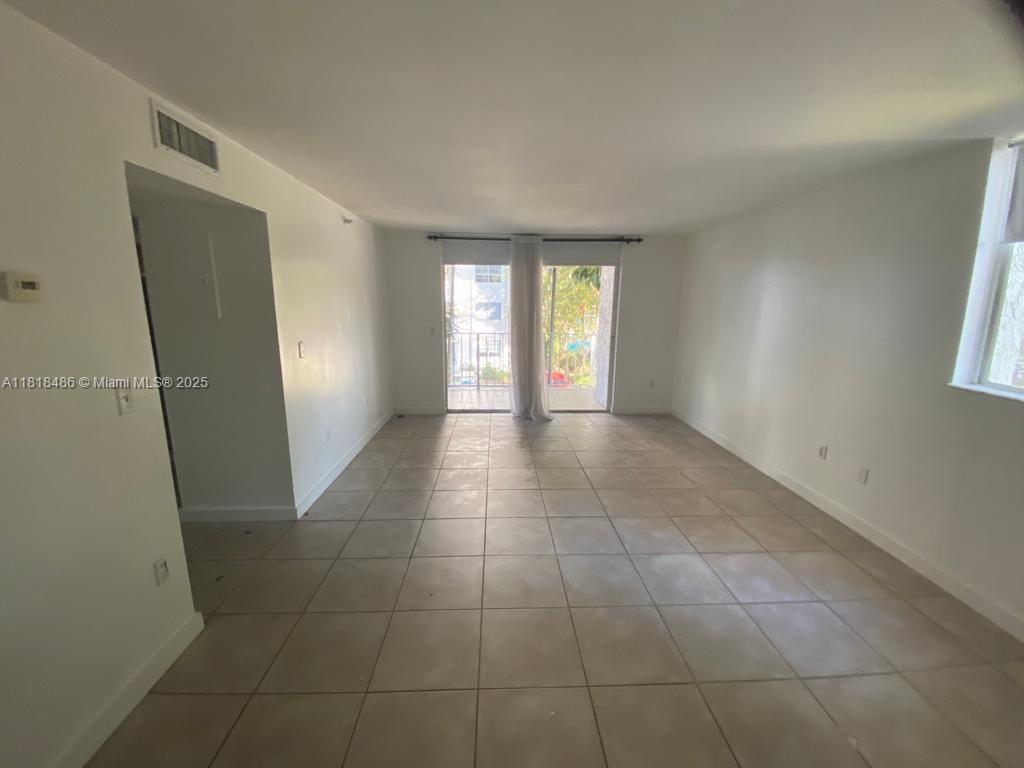
Active
$295,000
bds
|
1
ba
|
508
sqft
|
built
2007
1750 N Bayshore Dr, Miami, FL 33132
$-772
Cash flow
-13.7%
Cash-on-Cash Return
3.1%
Cap rate
0.8%
Rent to Value Ratio
Active
$820,000
2
bds
|
2
ba
|
1,231
sqft
|
built
1974
77 Crandon Blvd, Key Biscayne, FL 33149
$-2,912
Cash flow
-18.5%
Cash-on-Cash Return
2.0%
Cap rate
0.6%
Rent to Value Ratio
Active
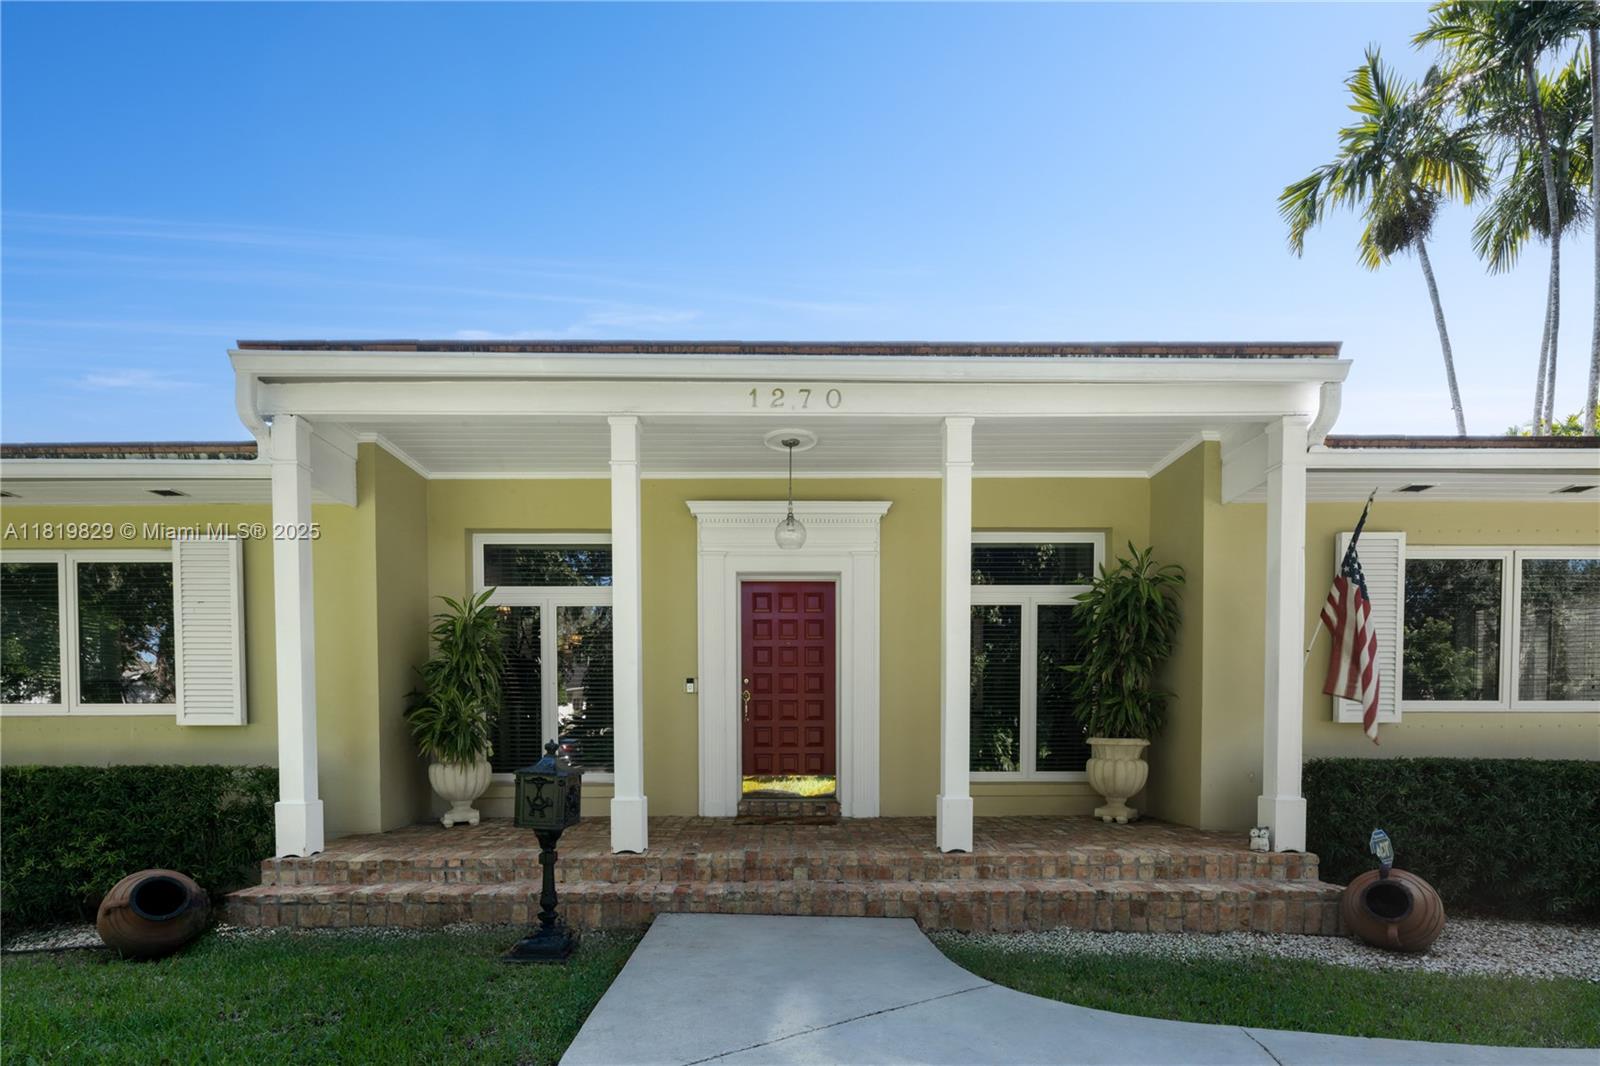
$2,995,000
5
bds
|
4
ba
|
3,568
sqft
|
built
1948
1270 Mariola Ct, Coral Gables, FL 33134
$-10,696
Cash flow
-18.6%
Cash-on-Cash Return
2.0%
Cap rate
0.3%
Rent to Value Ratio
Active
$280,000
2
bds
|
2
ba
|
974
sqft
|
built
1982
9688 Fontainebleau Blvd, Miami, FL 33172
$-402
Cash flow
-7.5%
Cash-on-Cash Return
4.6%
Cap rate
0.9%
Rent to Value Ratio
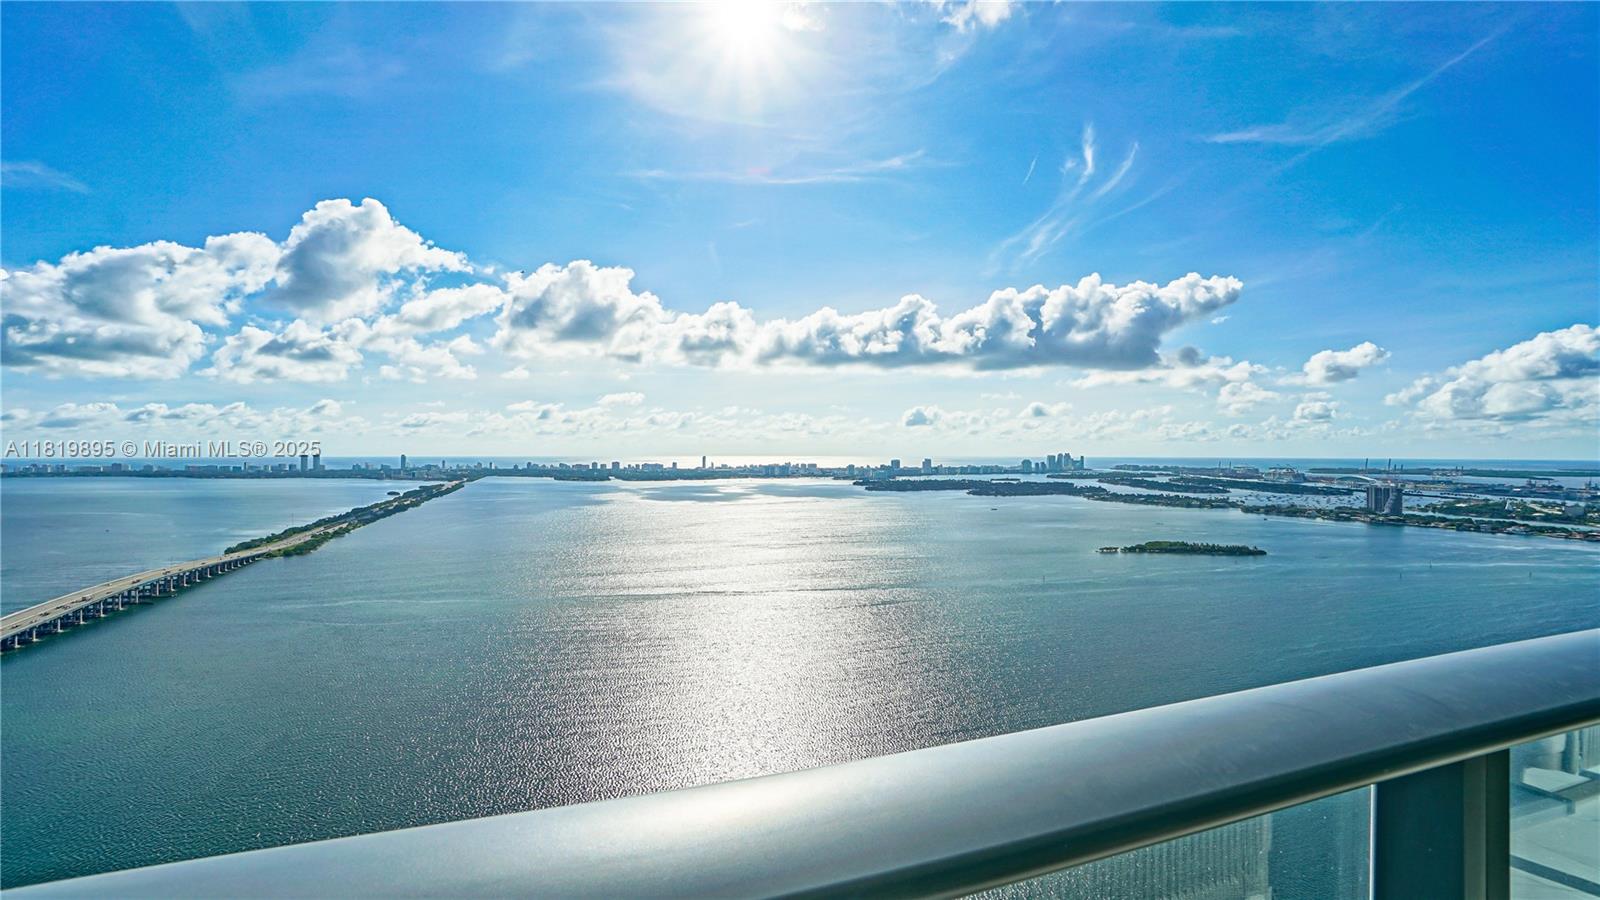
Active
$2,150,000
3
bds
|
4
ba
|
1,634
sqft
|
built
2018
3131 NE 7th Ave, Miami, FL 33137
$-8,000
Cash flow
-19.4%
Cash-on-Cash Return
1.8%
Cap rate
0.5%
Rent to Value Ratio
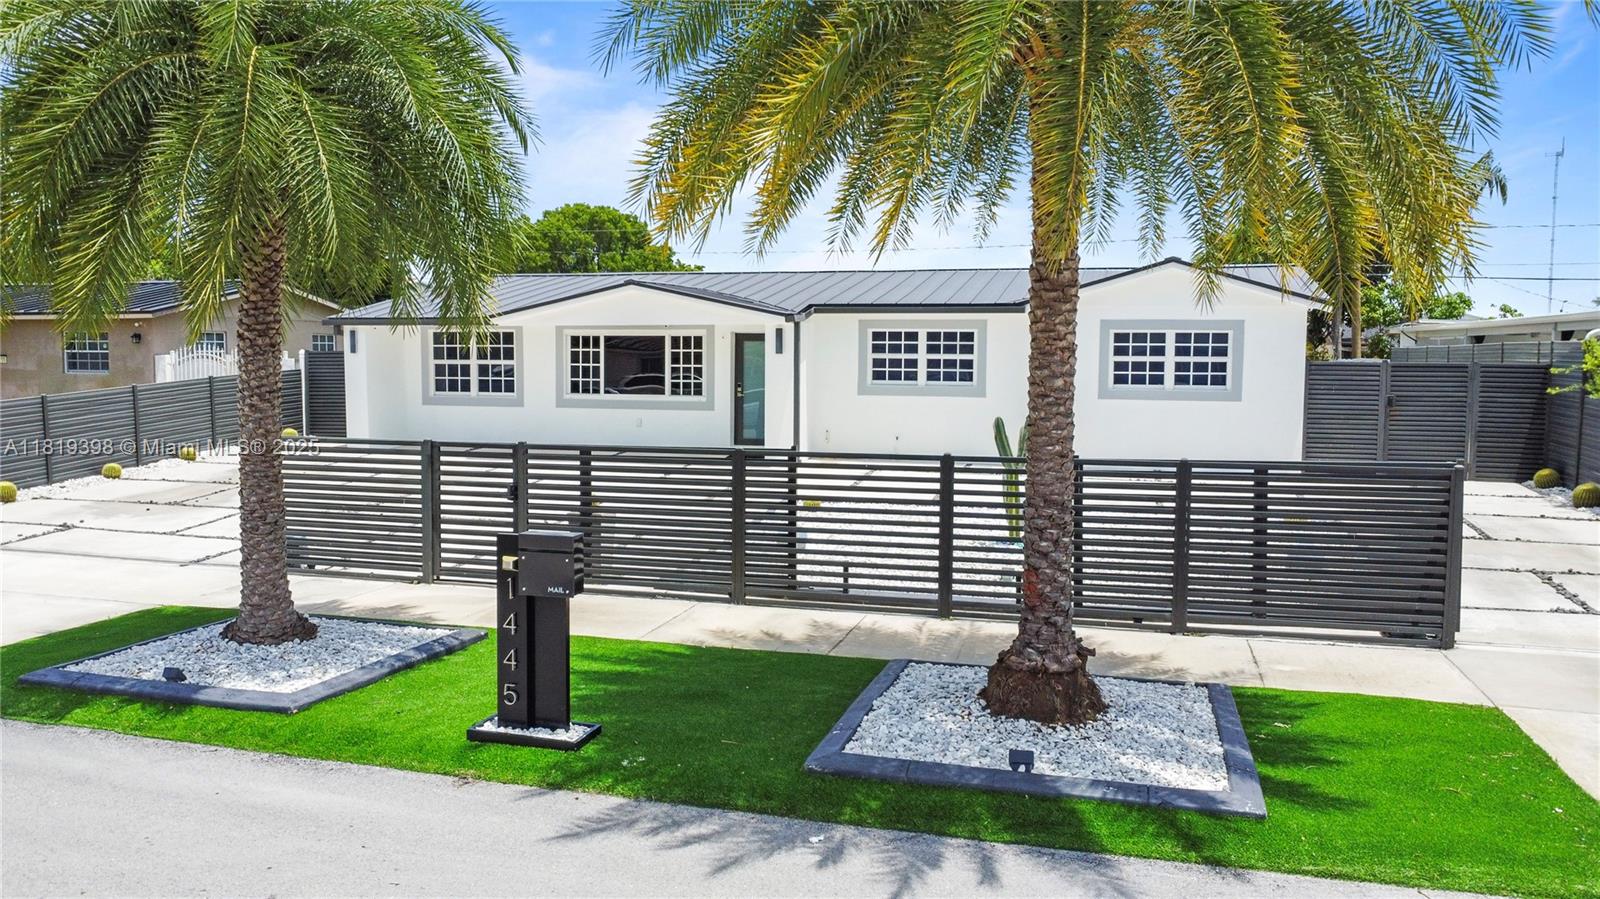
Active
$624,900
3
bds
|
2
ba
|
1,350
sqft
|
built
1965
1445 NW 195th St, Miami, FL 33169
$-1,463
Cash flow
-12.2%
Cash-on-Cash Return
3.5%
Cap rate
0.5%
Rent to Value Ratio
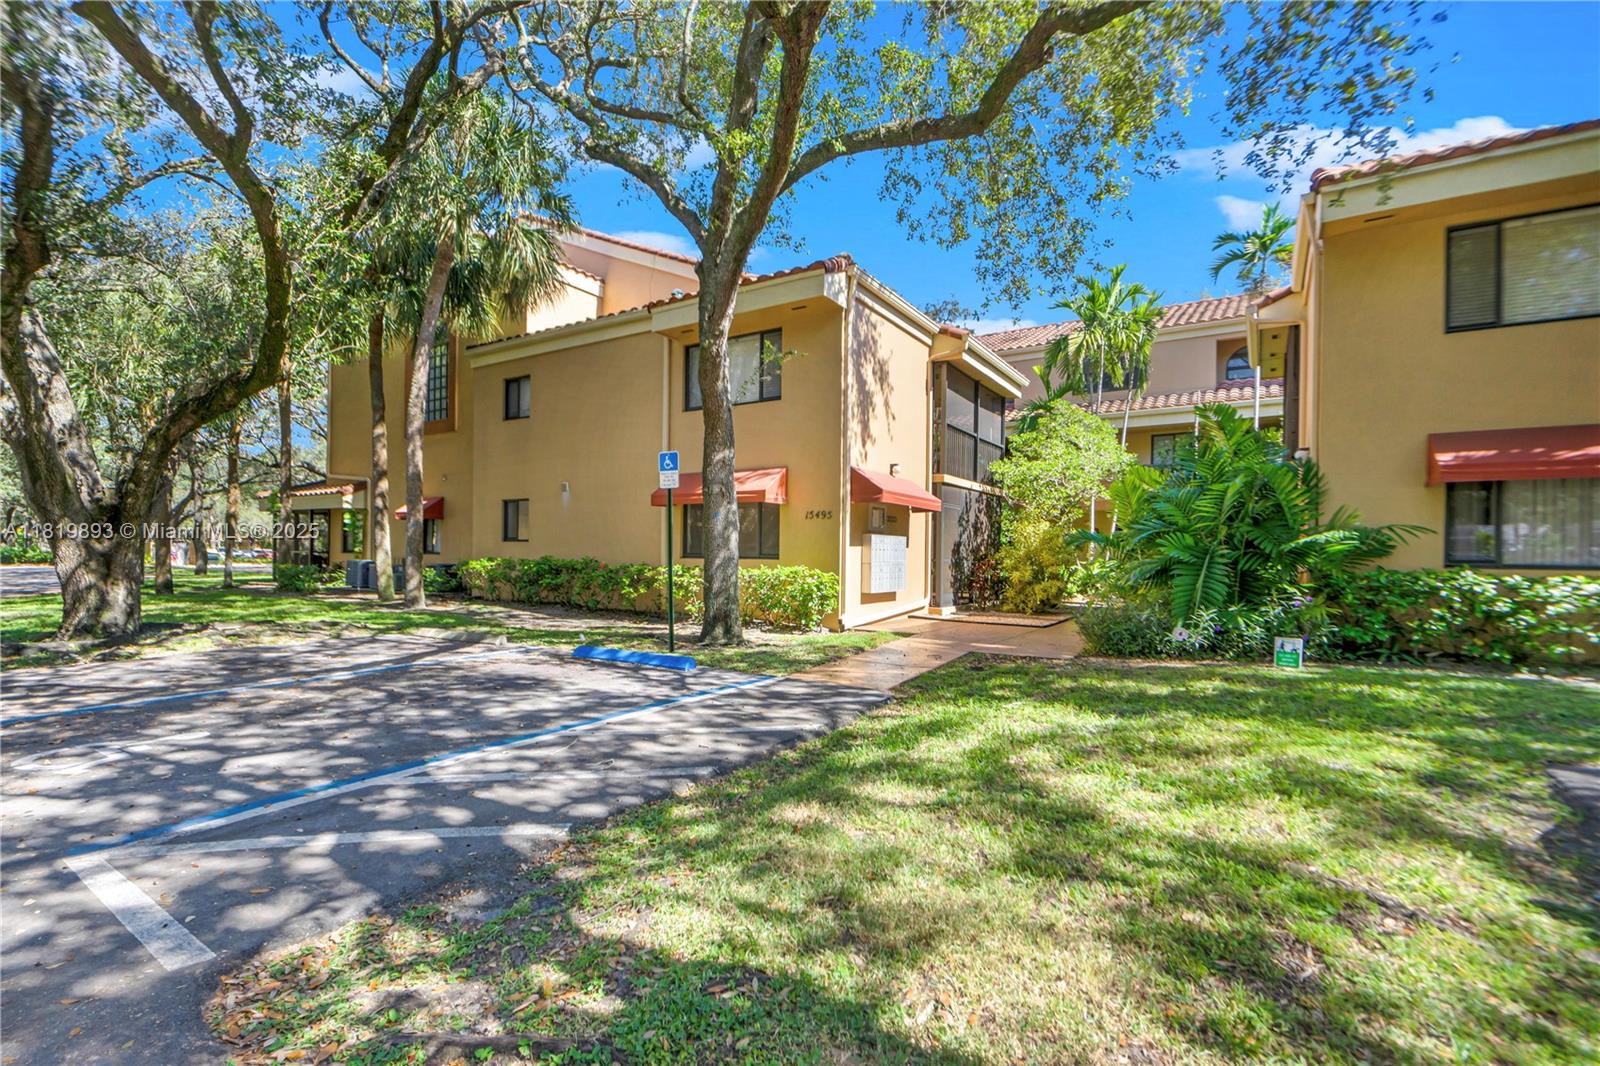
Active
$319,000
1
bds
|
1
ba
|
640
sqft
|
built
1986
15495 Miami Lakeway N, Miami Lakes, FL 33014
$-1,000
Cash flow
-16.4%
Cash-on-Cash Return
2.5%
Cap rate
0.6%
Rent to Value Ratio
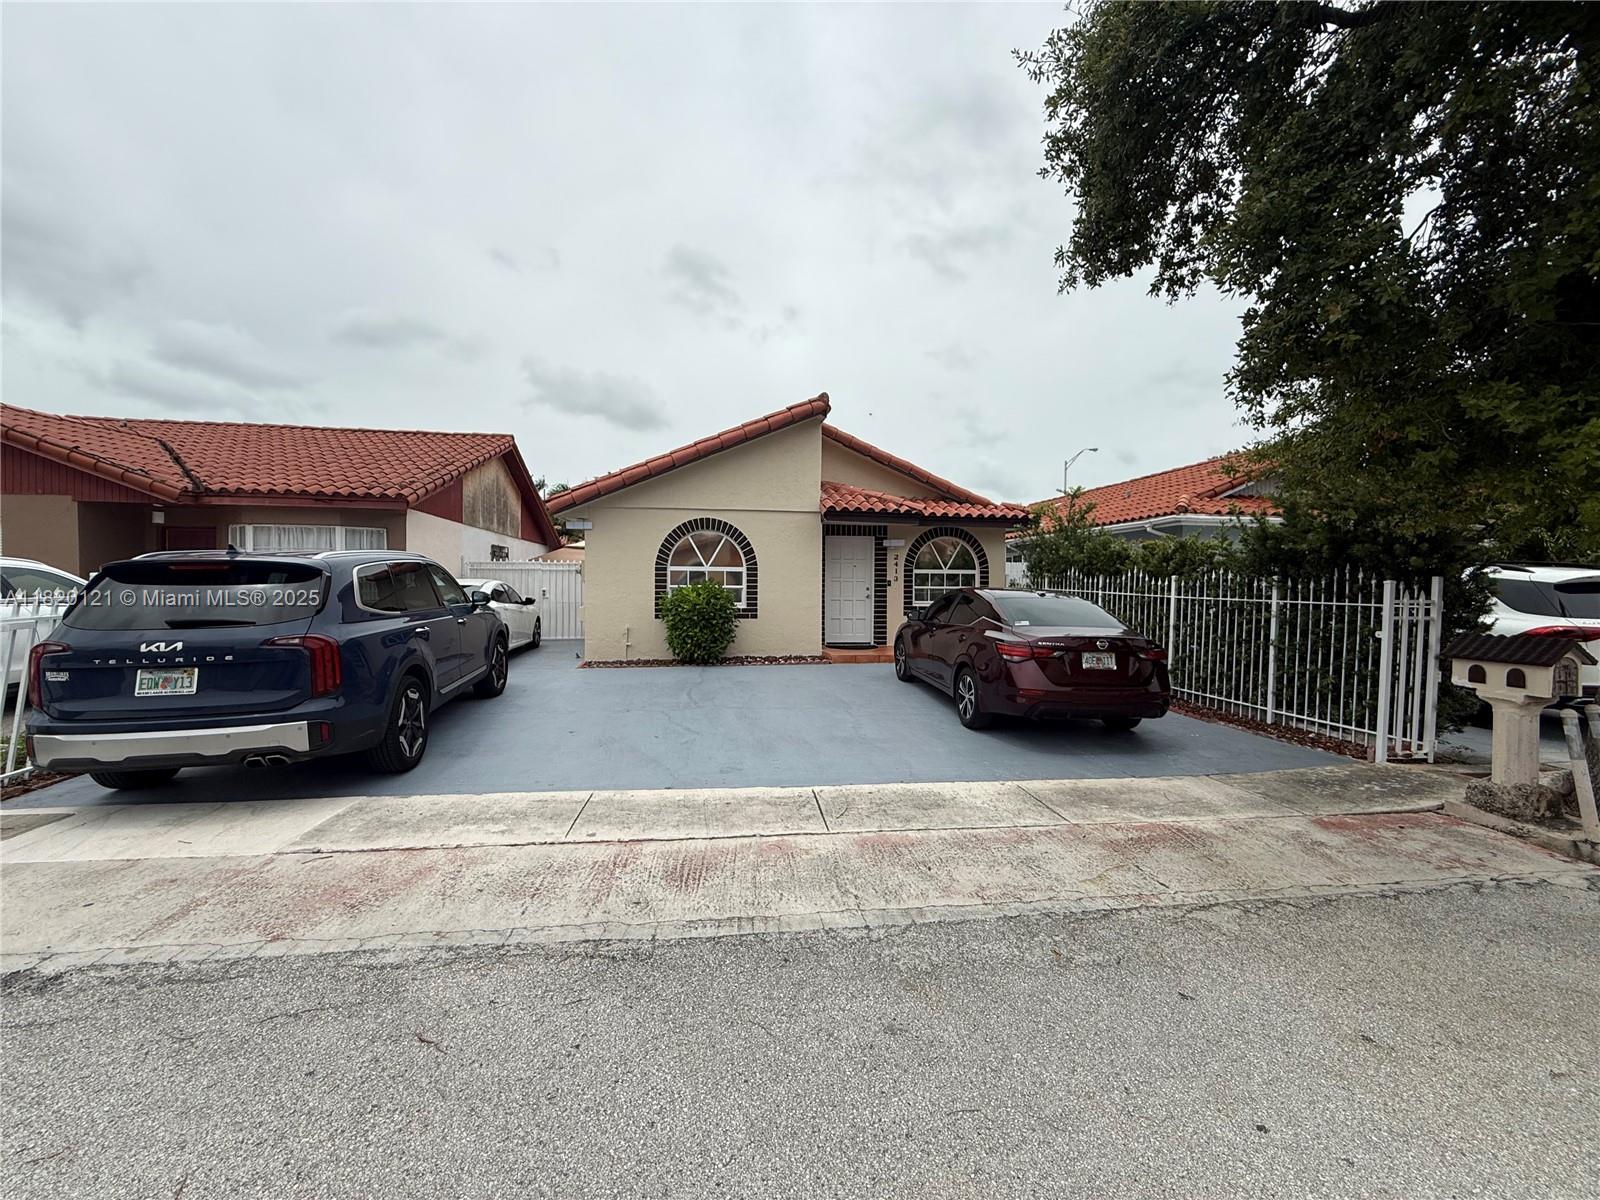
Active under contract
$525,000
2
bds
|
2
ba
|
1,378
sqft
|
built
1990
2413 W 73rd Pl, Hialeah, FL 33016
$-973
Cash flow
-9.7%
Cash-on-Cash Return
4.1%
Cap rate
0.6%
Rent to Value Ratio
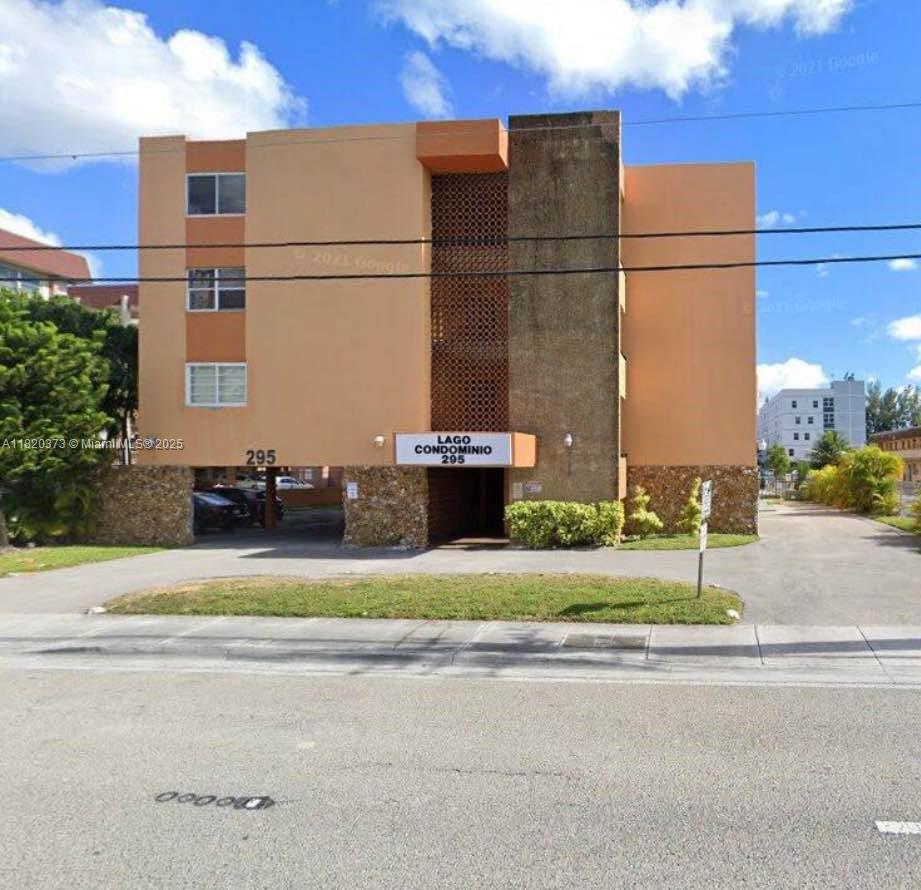
Active
$270,000
2
bds
|
1
ba
|
840
sqft
|
built
1973
295 NW 72nd Ave, Miami, FL 33126
$-460
Cash flow
-8.9%
Cash-on-Cash Return
4.2%
Cap rate
0.8%
Rent to Value Ratio

Active
$560,000
3
bds
|
3
ba
|
1,670
sqft
|
built
2007
12995 SW 133rd St, Miami, FL 33186
$-1,788
Cash flow
-16.7%
Cash-on-Cash Return
2.5%
Cap rate
0.5%
Rent to Value Ratio
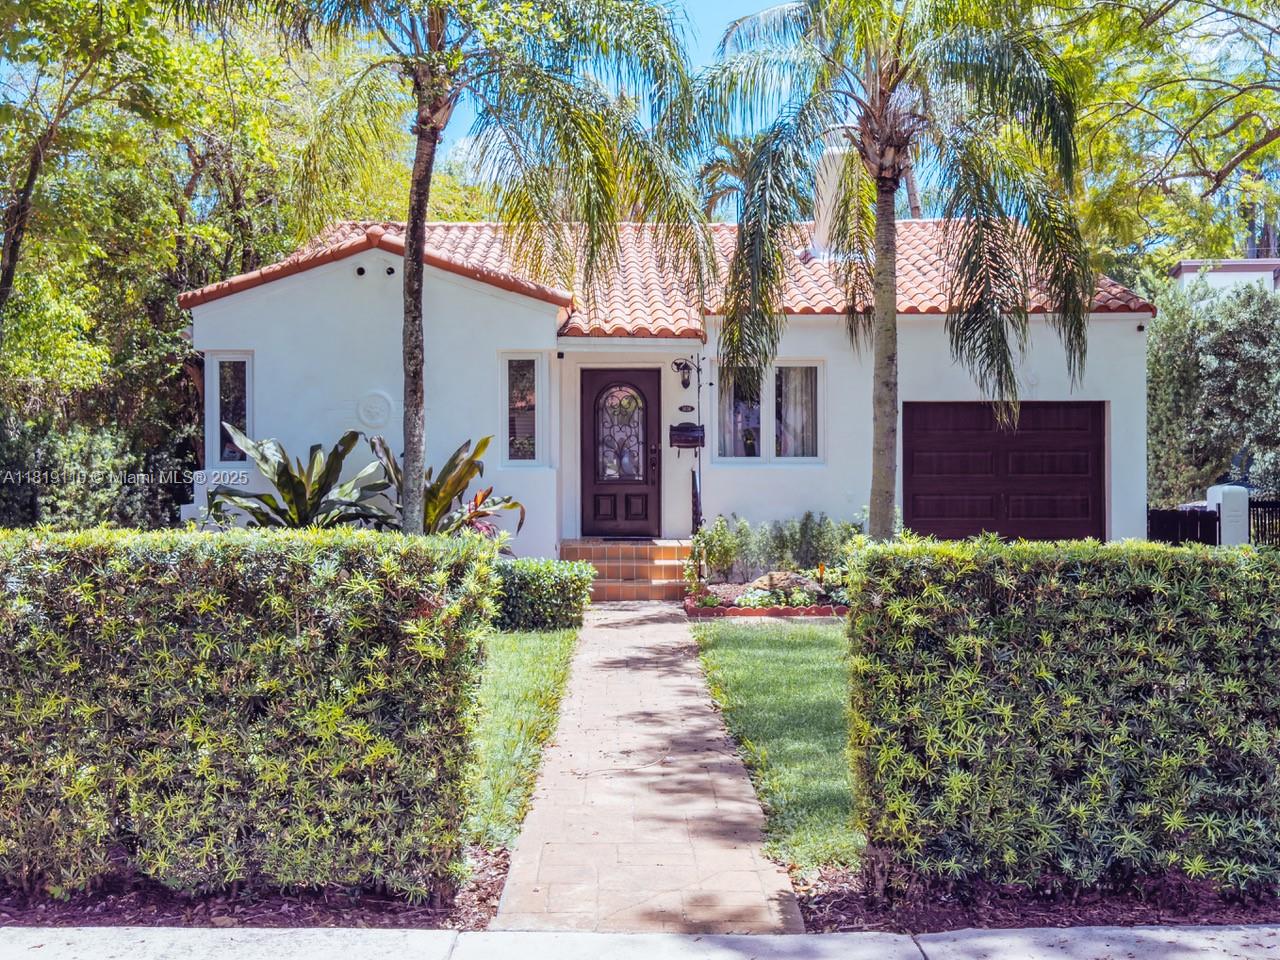
Active
$1,325,000
2
bds
|
2
ba
|
1,148
sqft
|
built
1937
1036 Palermo Ave, Coral Gables, FL 33134
$-4,489
Cash flow
-17.7%
Cash-on-Cash Return
2.2%
Cap rate
0.4%
Rent to Value Ratio

Active
$775,000
4
bds
|
3
ba
|
2,080
sqft
|
built
2004
16419 SW 84th St, Miami, FL 33193
$-1,730
Cash flow
-11.6%
Cash-on-Cash Return
3.6%
Cap rate
0.5%
Rent to Value Ratio
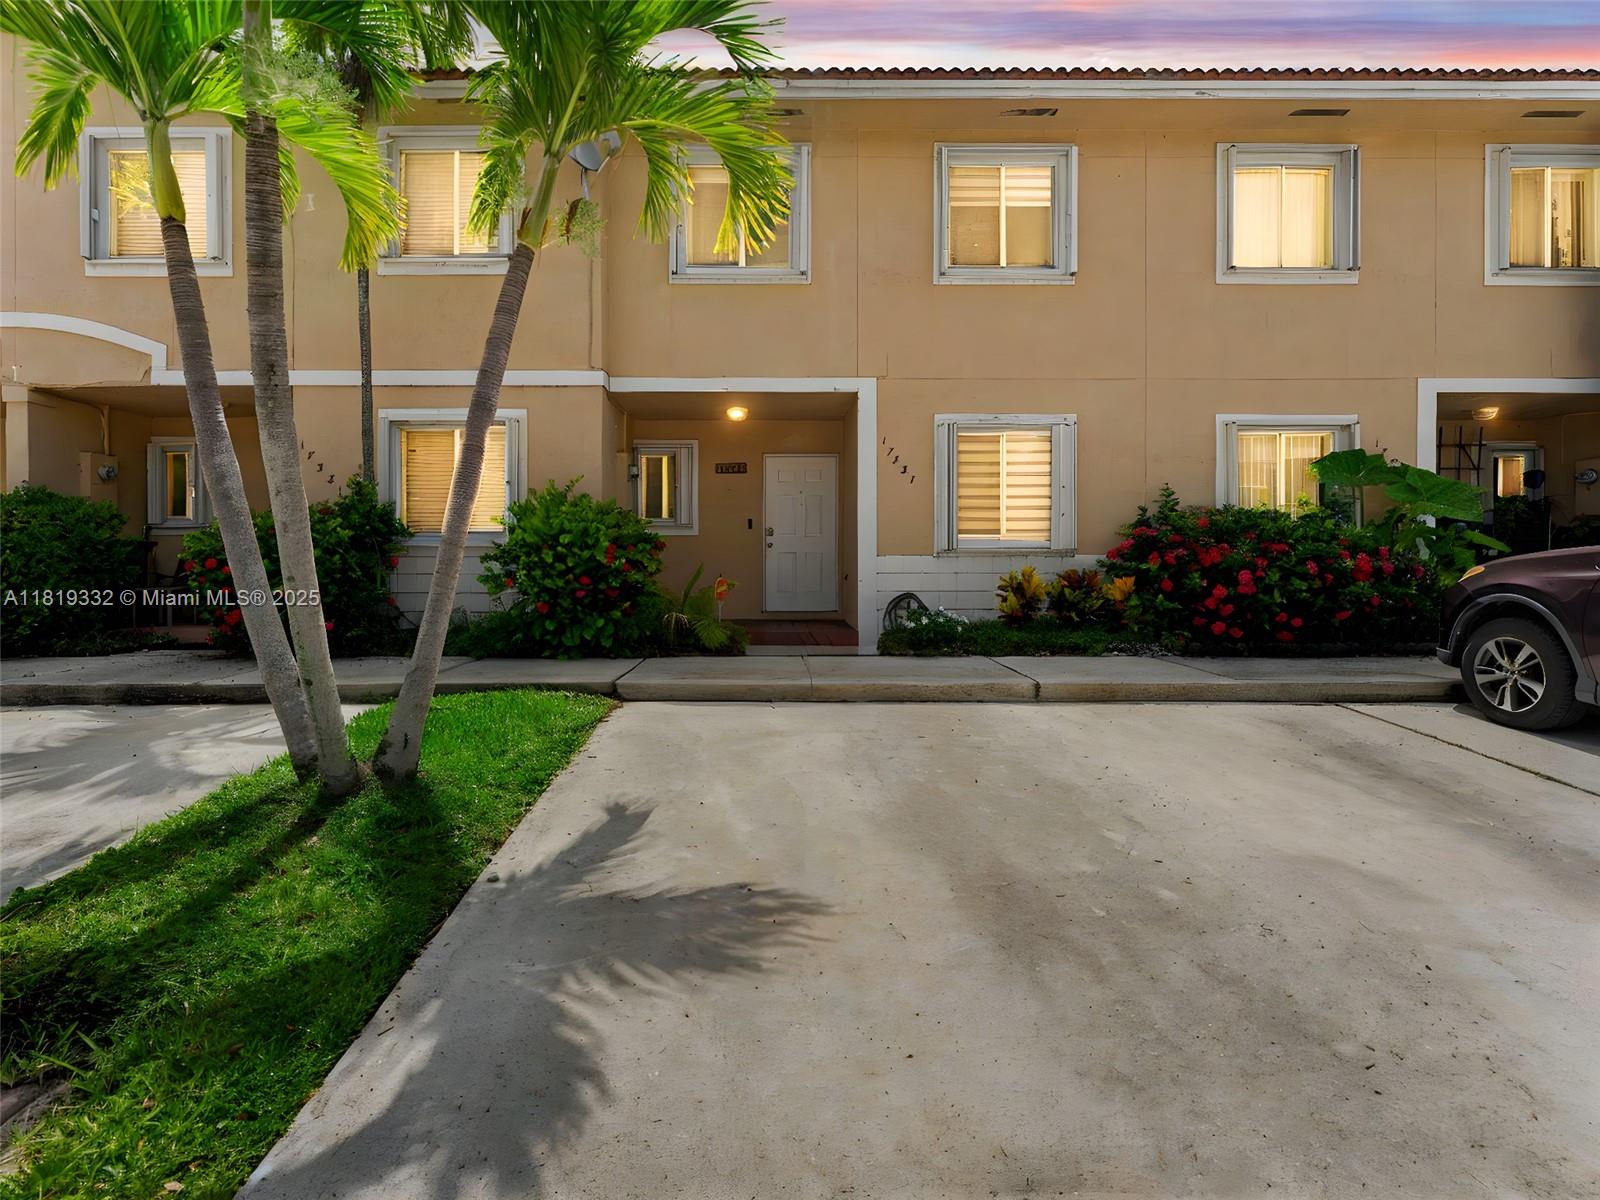
Active
$420,000
3
bds
|
3
ba
|
1,270
sqft
|
built
1995
17337 SW 140th Ct, Miami, FL 33177
$-864
Cash flow
-10.7%
Cash-on-Cash Return
3.8%
Cap rate
0.7%
Rent to Value Ratio
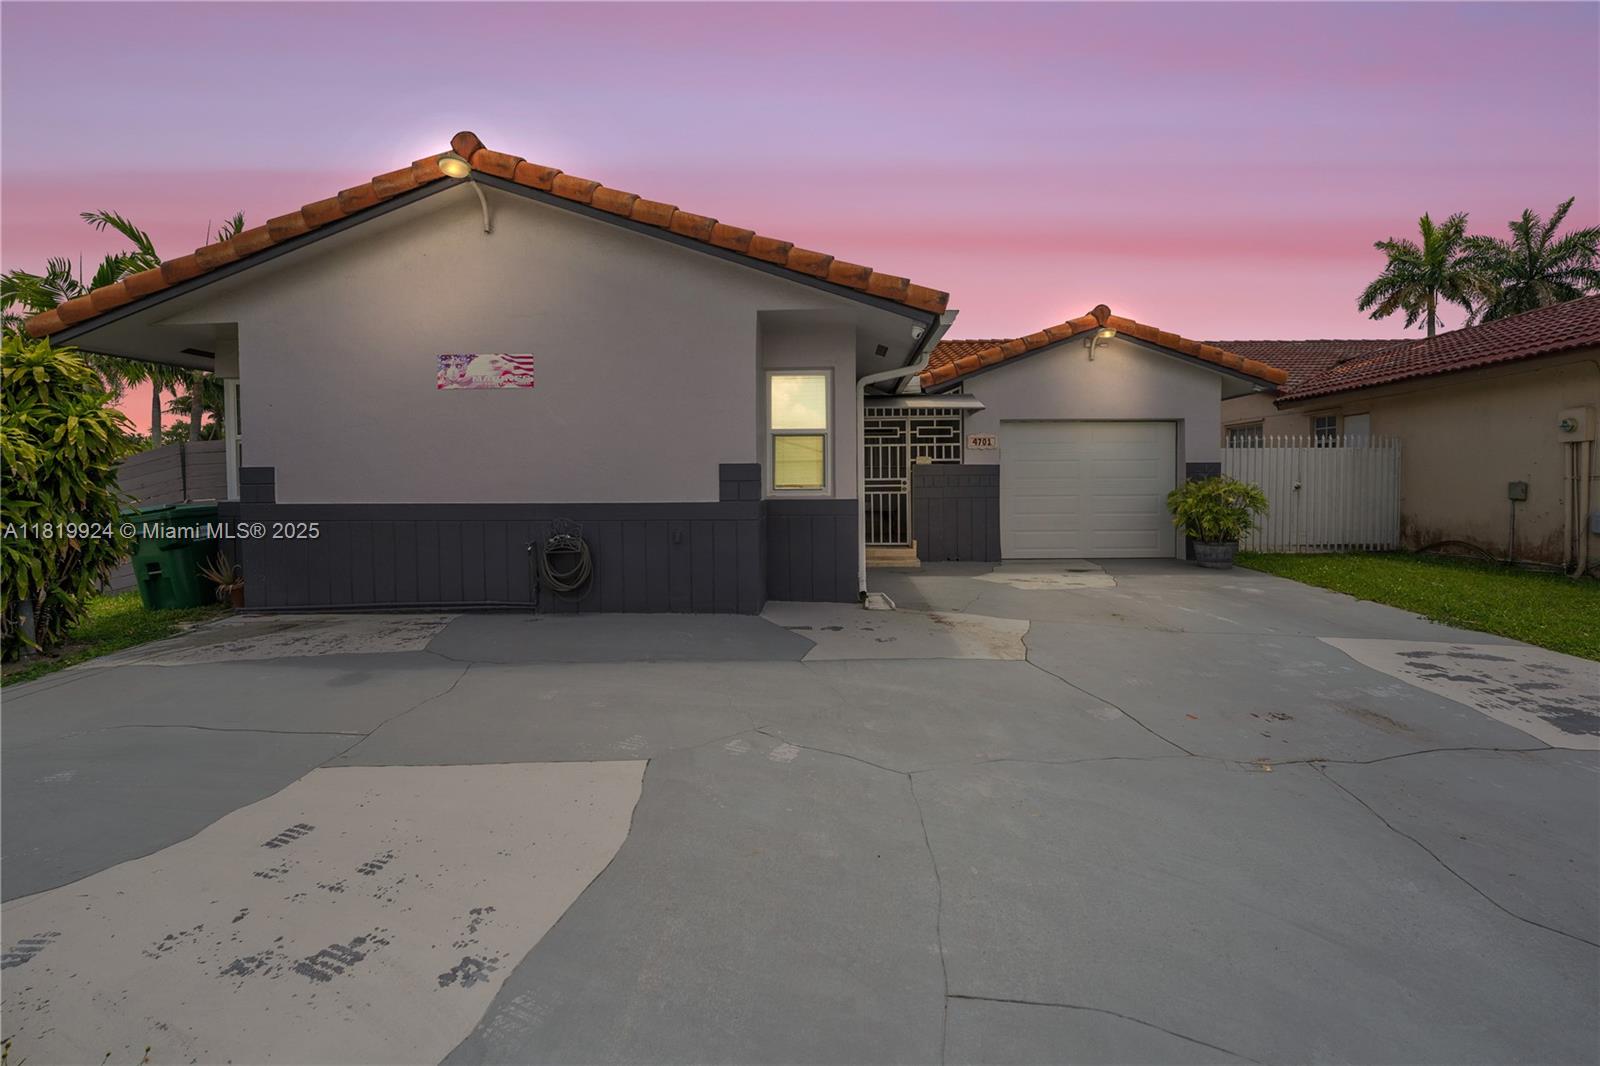
Pending
$599,000
3
bds
|
2
ba
|
1,546
sqft
|
built
1989
4701 SW 142nd Ct, Miami, FL 33175
$-691
Cash flow
-6.0%
Cash-on-Cash Return
4.9%
Cap rate
0.7%
Rent to Value Ratio
Pending
$430,000
2
bds
|
3
ba
|
980
sqft
|
built
2000
11438 NW 62nd Ter, Doral, FL 33178
$-1,003
Cash flow
-12.2%
Cash-on-Cash Return
3.5%
Cap rate
0.7%
Rent to Value Ratio
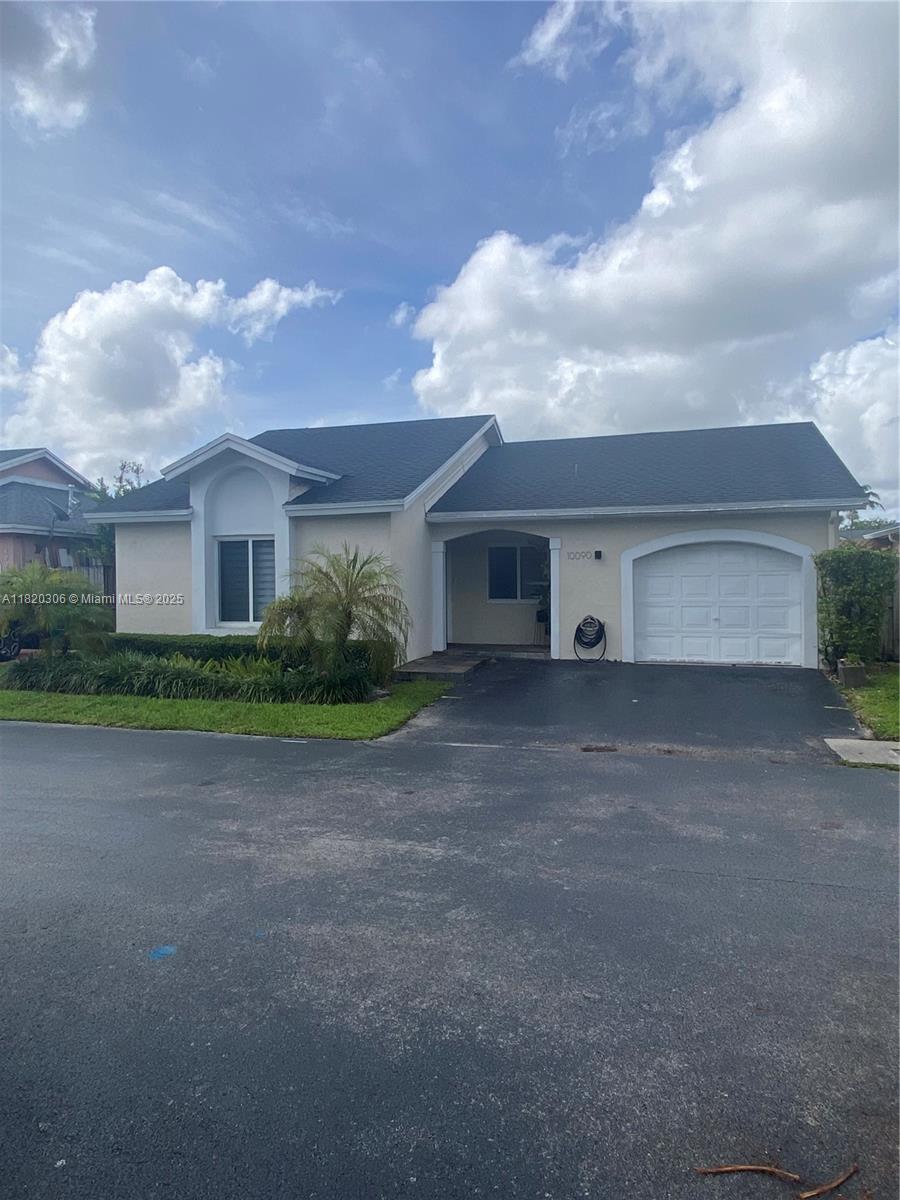
Active
$650,000
3
bds
|
2
ba
|
1,064
sqft
|
built
1989
10090 NW 57th St, Doral, FL 33178
$-2,136
Cash flow
-17.1%
Cash-on-Cash Return
2.3%
Cap rate
0.5%
Rent to Value Ratio
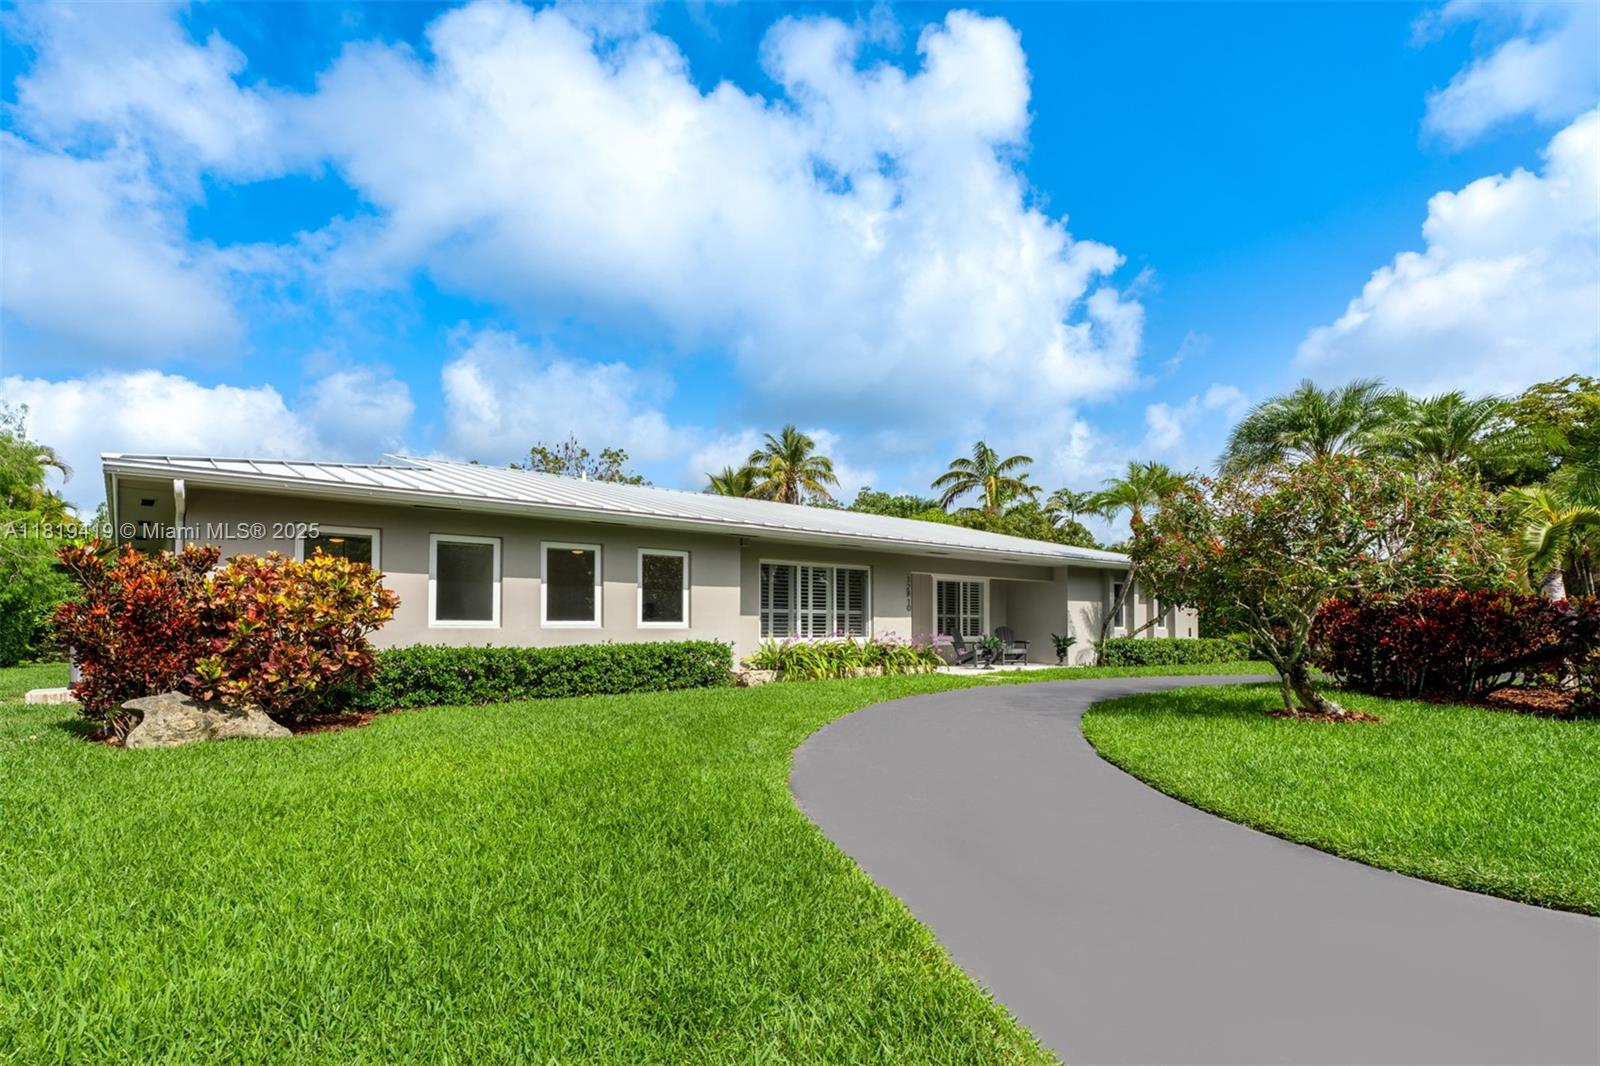
Active
$1,795,000
4
bds
|
3
ba
|
2,623
sqft
|
built
1966
12810 SW 70th Ave, Pinecrest, FL 33156
$-4,715
Cash flow
-13.7%
Cash-on-Cash Return
3.1%
Cap rate
0.5%
Rent to Value Ratio
Active
$297,000
1
bds
|
2
ba
|
1,125
sqft
|
built
1972
9367 Fontainebleau Blvd, Miami, FL 33172
$-841
Cash flow
-14.8%
Cash-on-Cash Return
2.9%
Cap rate
0.7%
Rent to Value Ratio