Miami Dade County Investment Properties for Sale
Browse homes for sale and investment properties in Miami Dade County. Refine your search by price, property type, or more.
Best cash flowing properties in Miami Dade County

Active
$240,000
3
bds
|
2
ba
|
1,200
sqft
|
built
1978
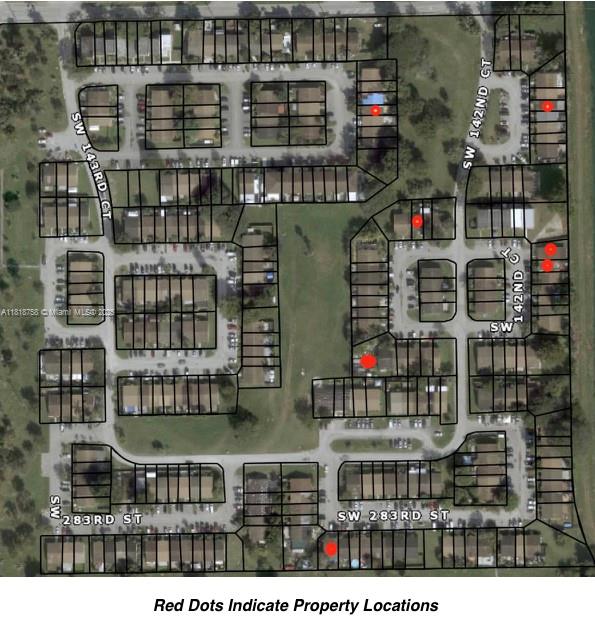
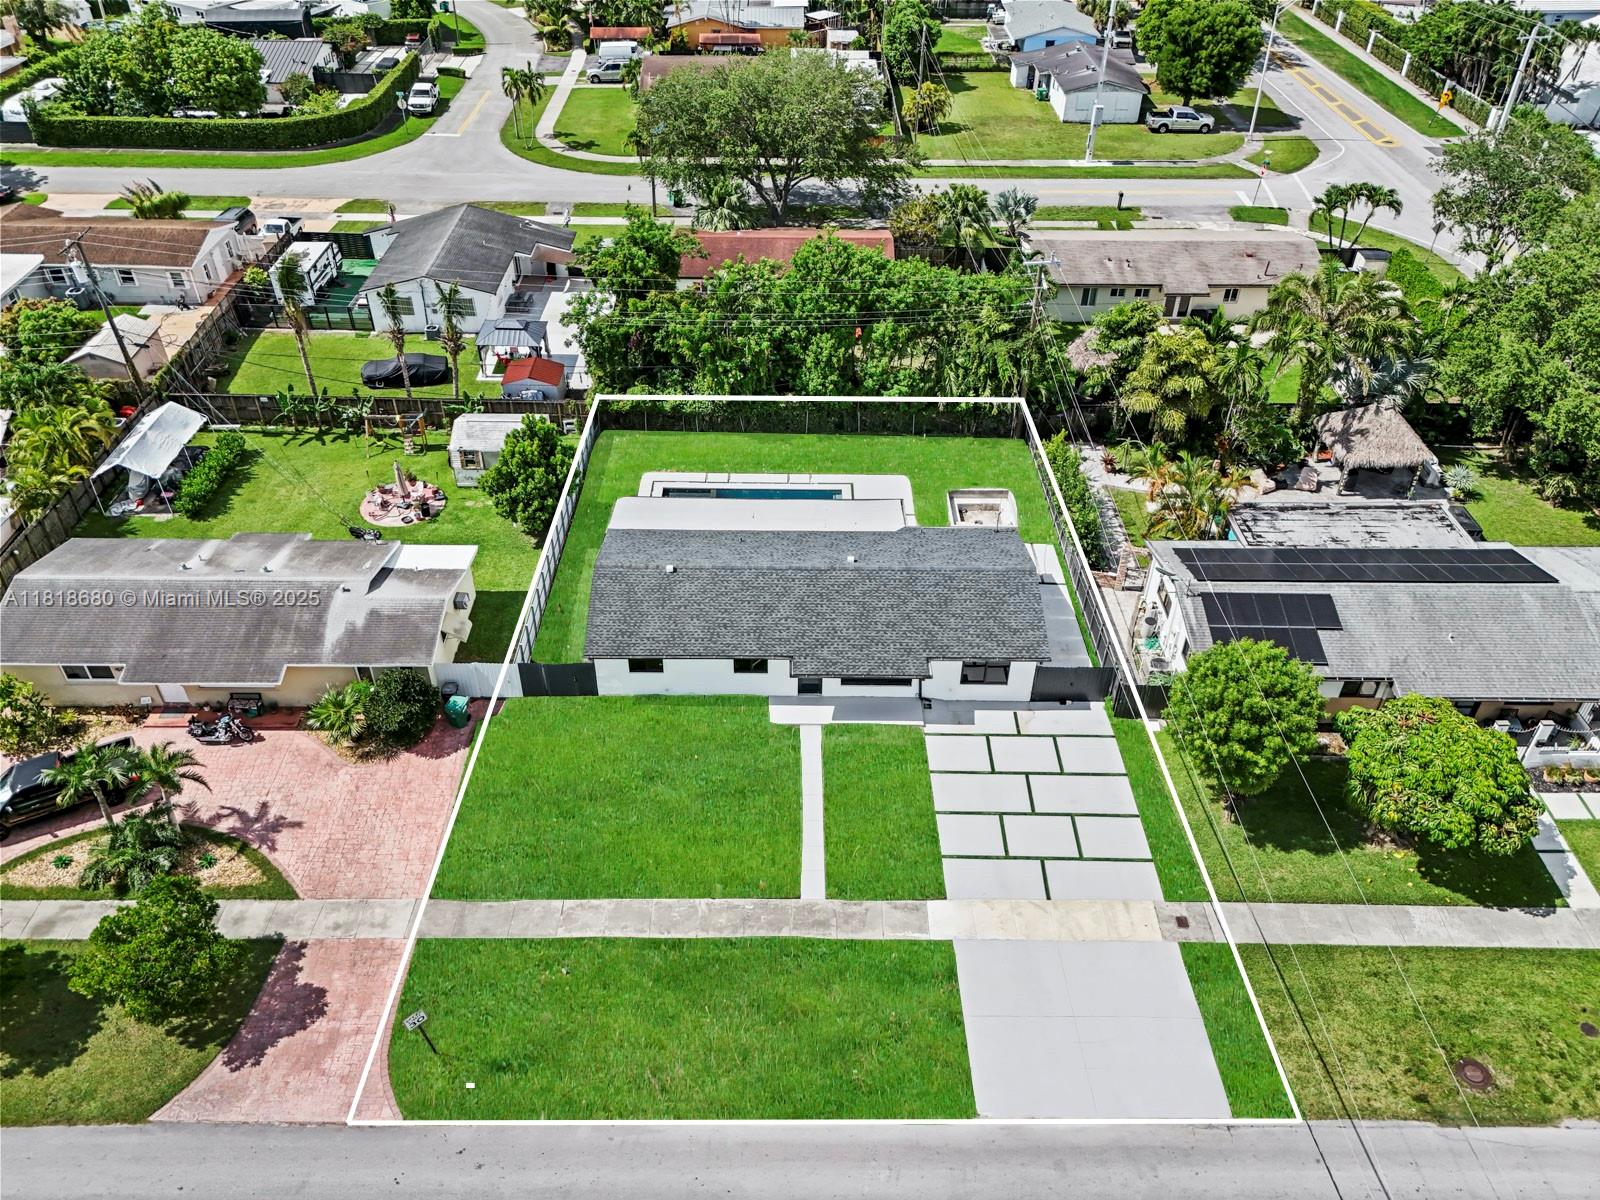
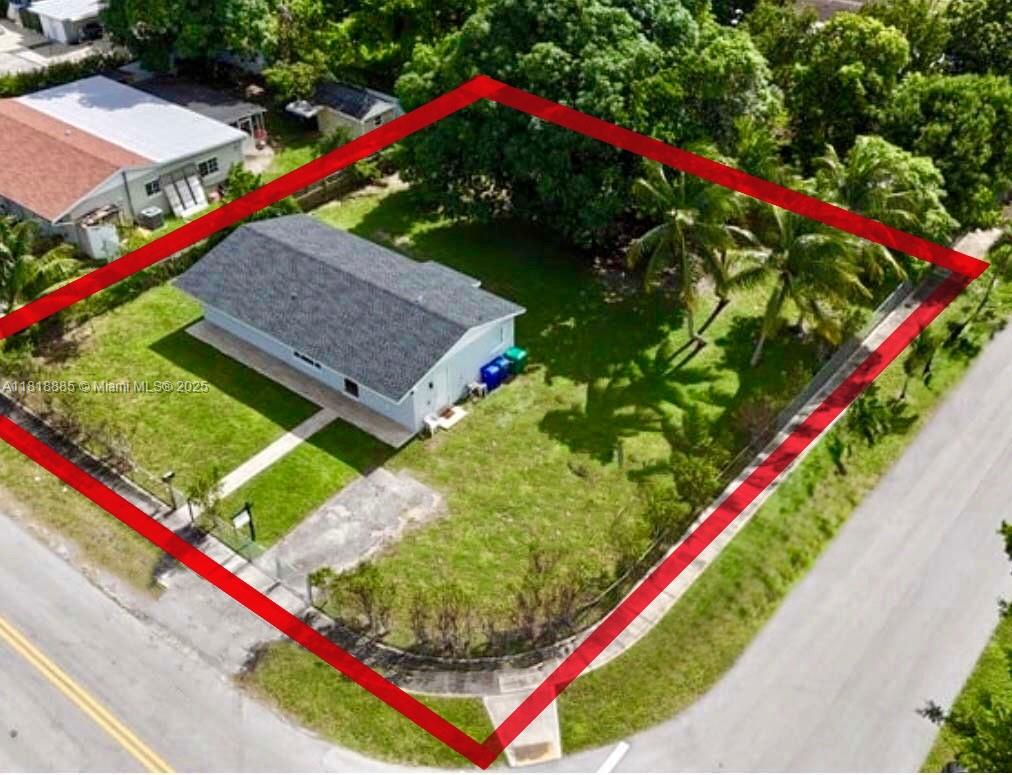
28152 SW 142nd Ct, Homestead, FL 33033
$96
Cash flow
2.1%
Cash-on-Cash Return
6.8%
Cap rate
1.0%
Rent to Value Ratio

Active
$195,000
1
bds
|
2
ba
|
920
sqft
|
built
1978
28133 SW 142nd Ct, Homestead, FL 33033
$50
Cash flow
1.3%
Cash-on-Cash Return
6.6%
Cap rate
1.0%
Rent to Value Ratio
10,000 out of 16,821 properties for sale in Miami Dade County
Limited Results Shown
Create a free account, or log in to reveal all property listings and enjoy the complete experience.
Active
$439,000
2
bds
|
2
ba
|
1,344
sqft
|
built
1971
1680 W 72nd St, Hialeah, FL 33014
$-998
Cash flow
-11.9%
Cash-on-Cash Return
3.6%
Cap rate
0.6%
Rent to Value Ratio
Active
$1,300,000
3
bds
|
3
ba
|
1,281
sqft
|
built
2016
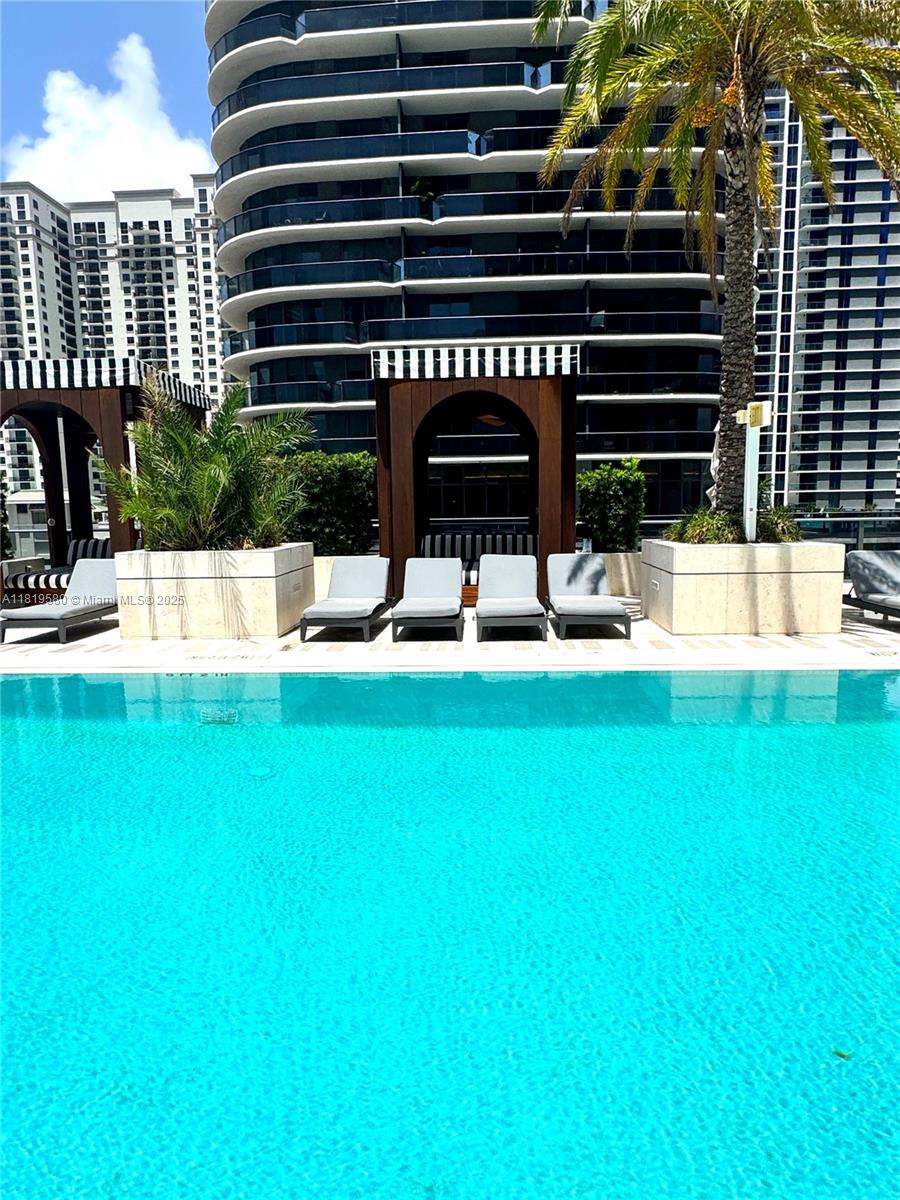
1300 S Miami Ave, Miami, FL 33130
$-5,114
Cash flow
-20.5%
Cash-on-Cash Return
1.6%
Cap rate
0.5%
Rent to Value Ratio
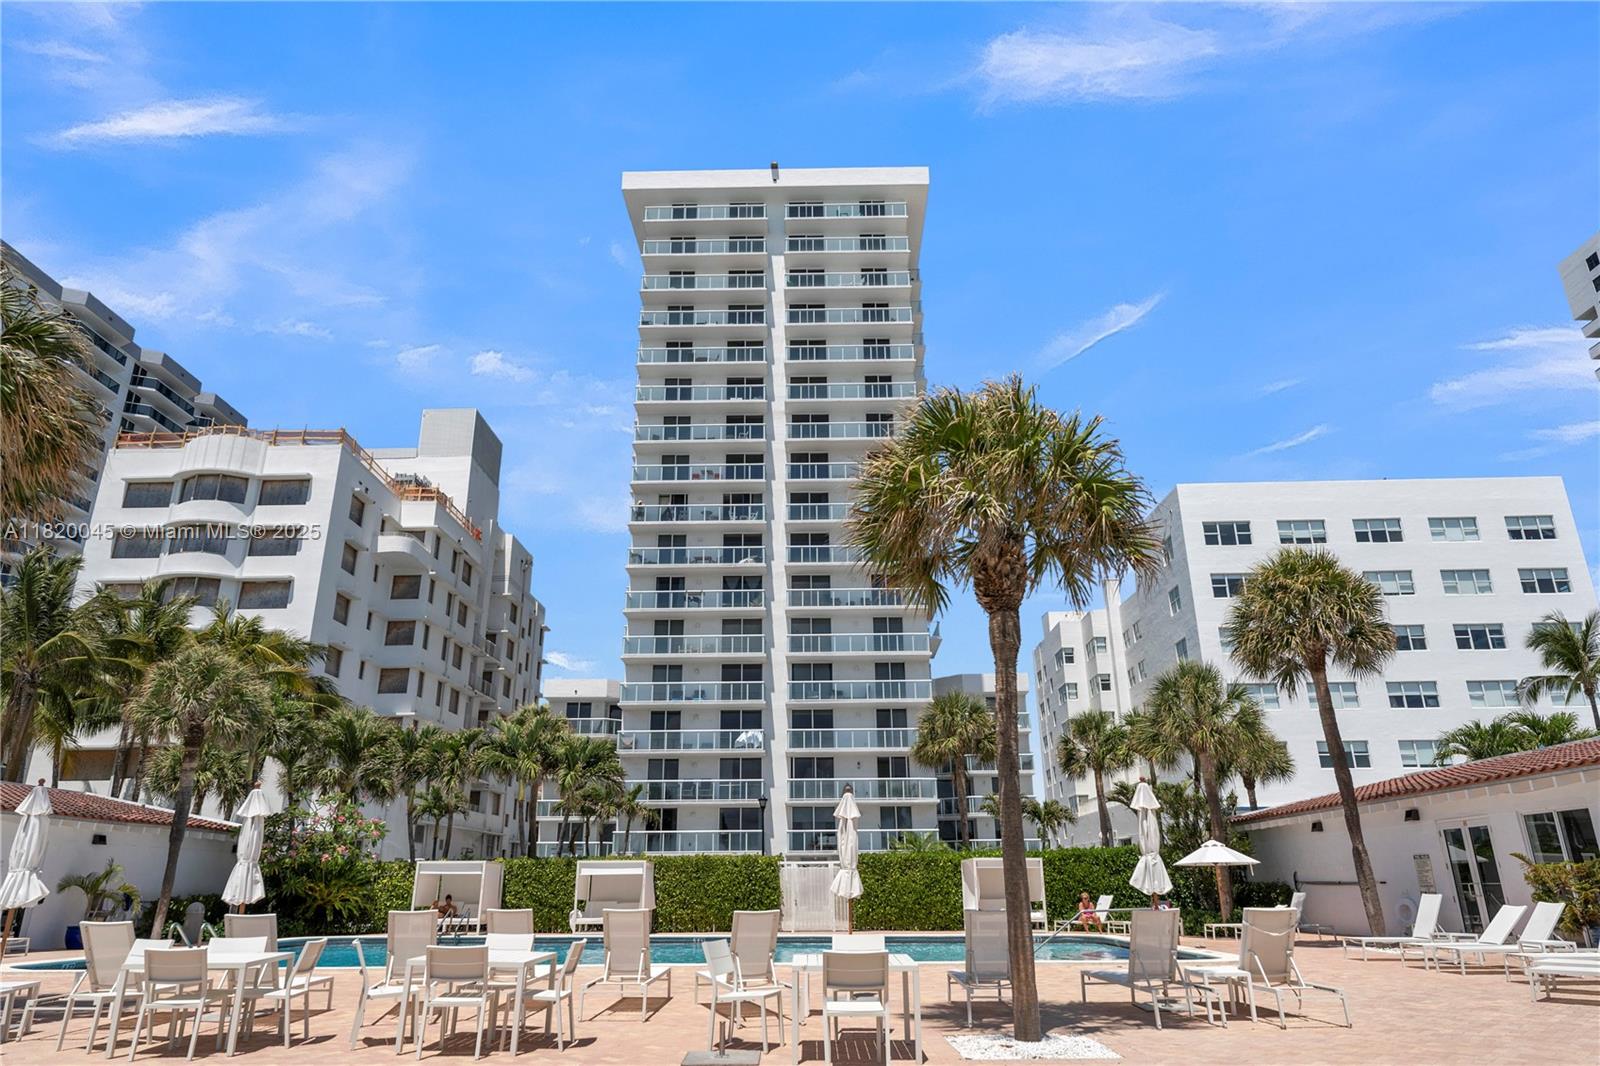
Active
$614,900
2
bds
|
2
ba
|
1,342
sqft
|
built
1965
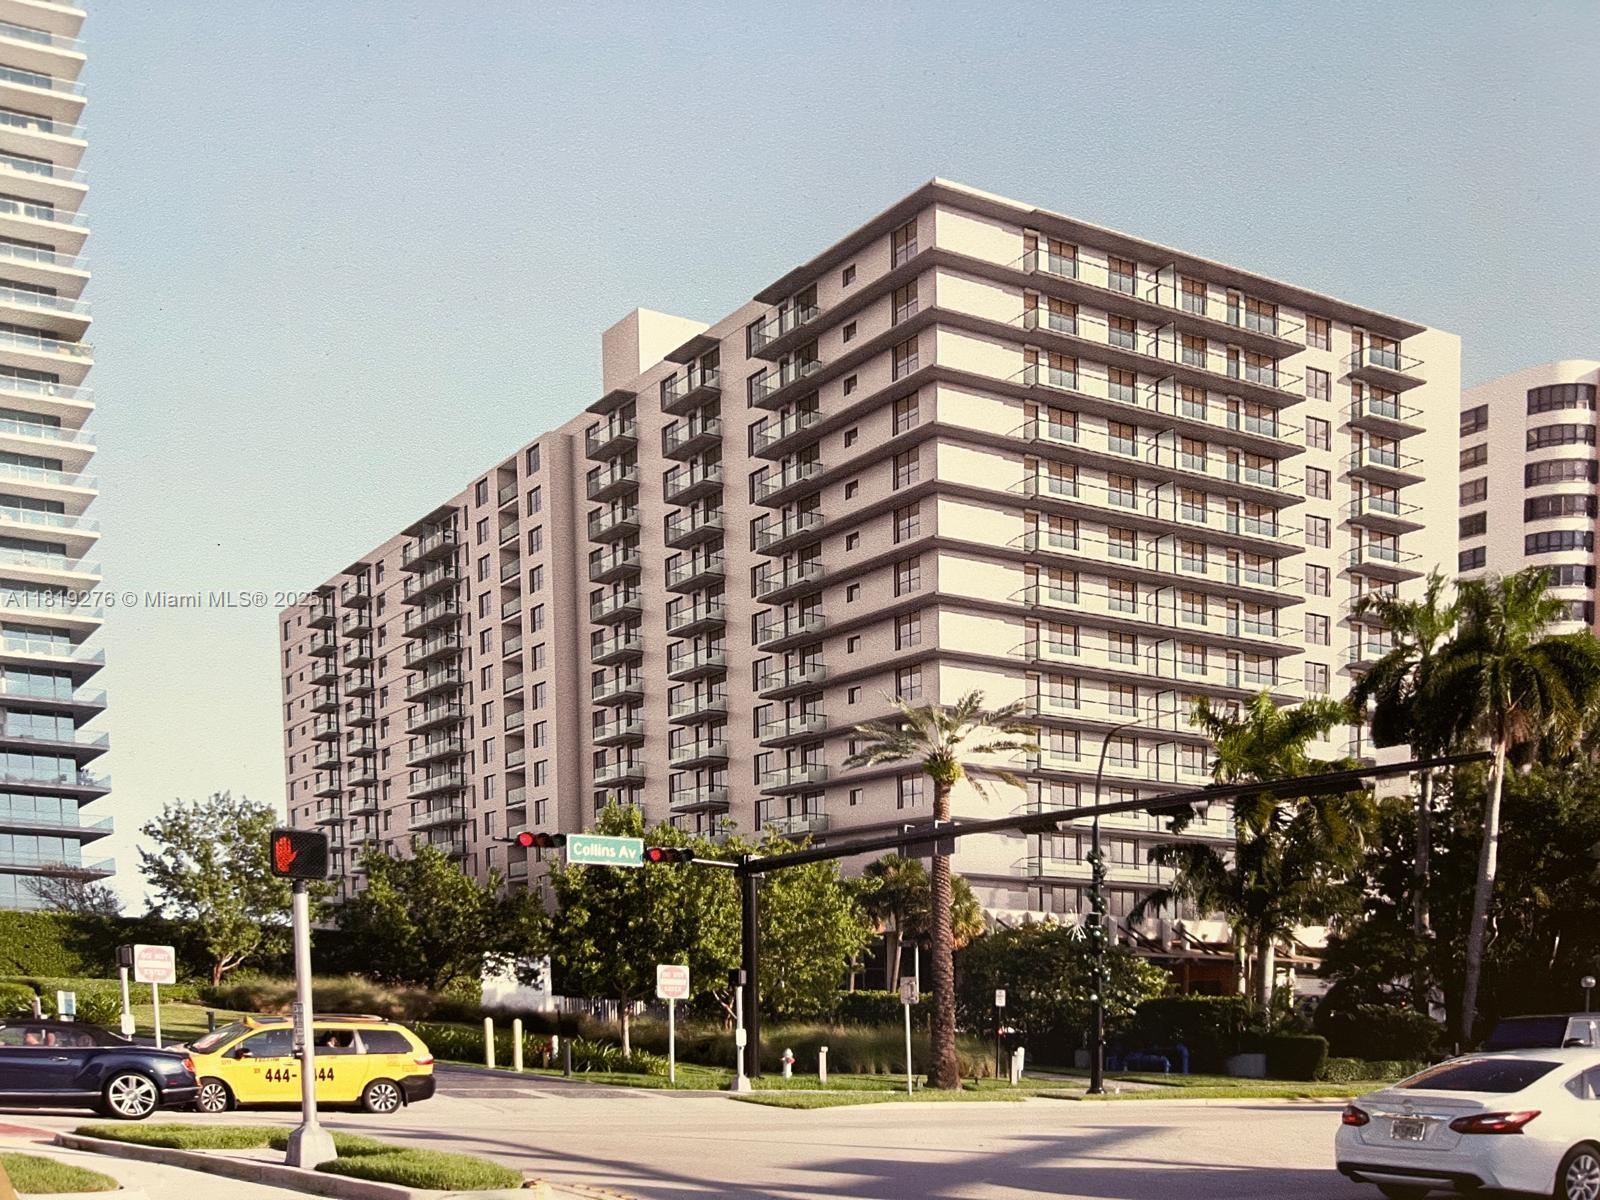
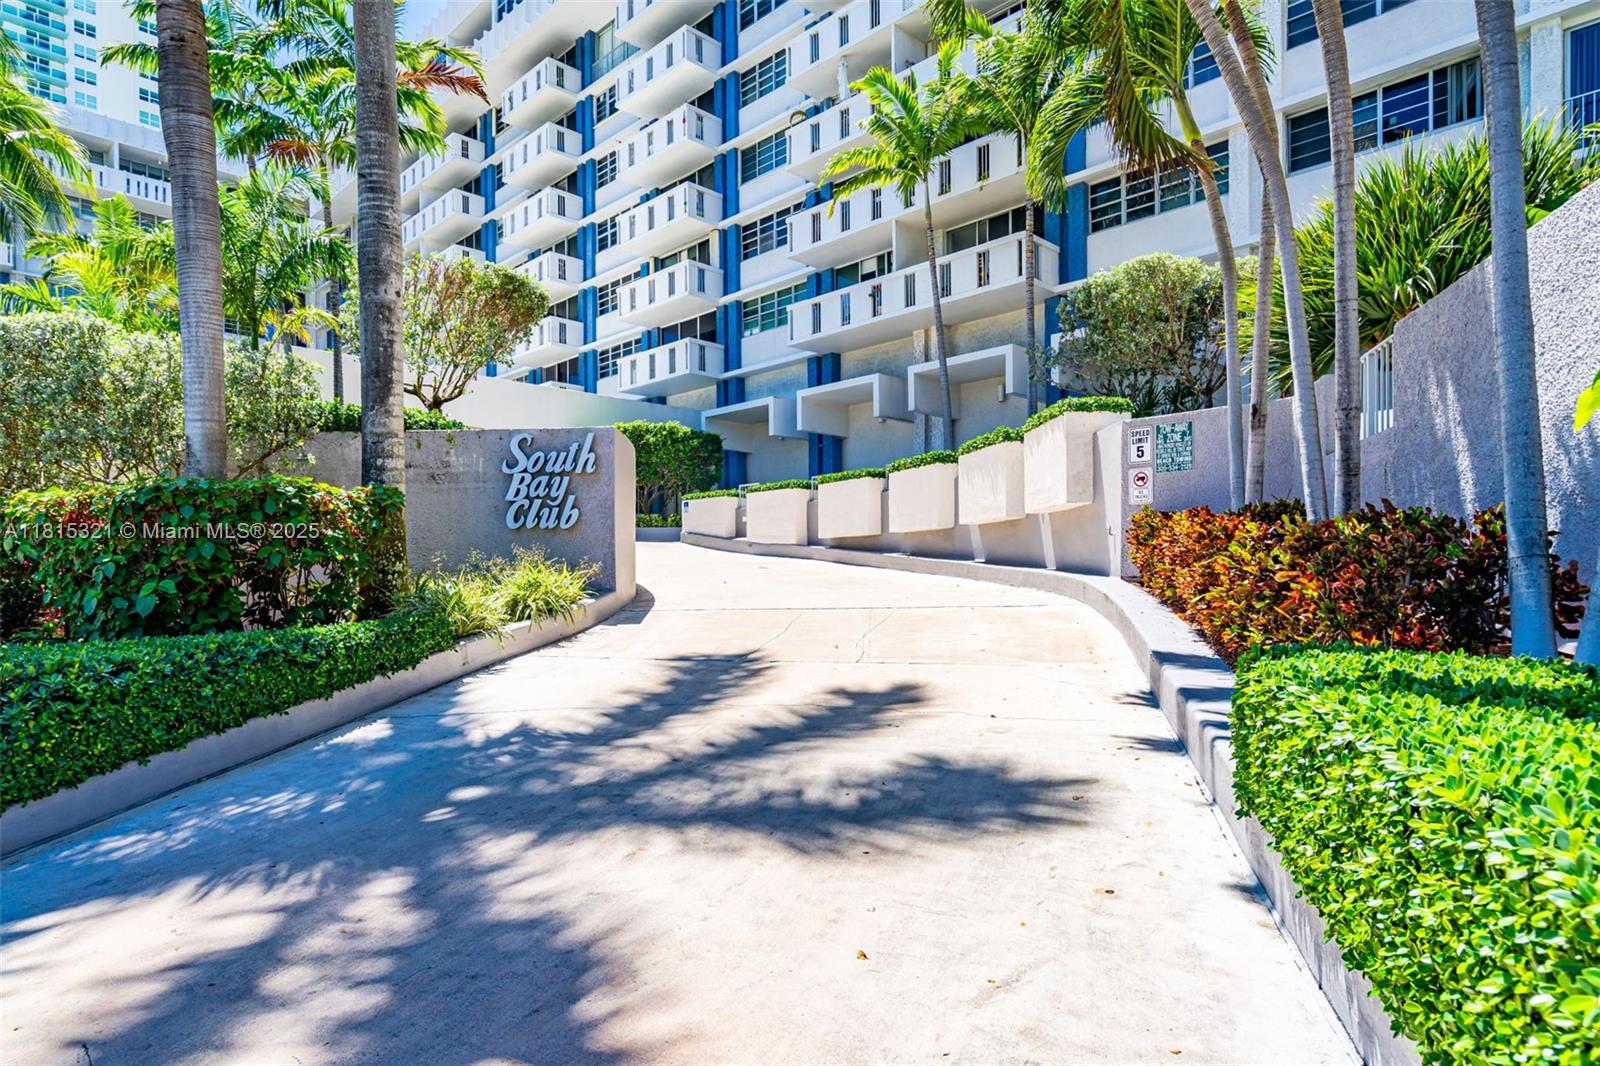
10185 Collins Ave, Bal Harbour, FL 33154
$-2,809
Cash flow
-23.8%
Cash-on-Cash Return
0.8%
Cap rate
0.7%
Rent to Value Ratio
Active
$1,420,000
2
bds
|
3
ba
|
2,020
sqft
|
built
1993
16445 Collins Ave, Sunny Isles Beach, FL 33160
$-5,888
Cash flow
-21.6%
Cash-on-Cash Return
1.3%
Cap rate
0.5%
Rent to Value Ratio
Active
$545,000
2
bds
|
2
ba
|
1,185
sqft
|
built
1983
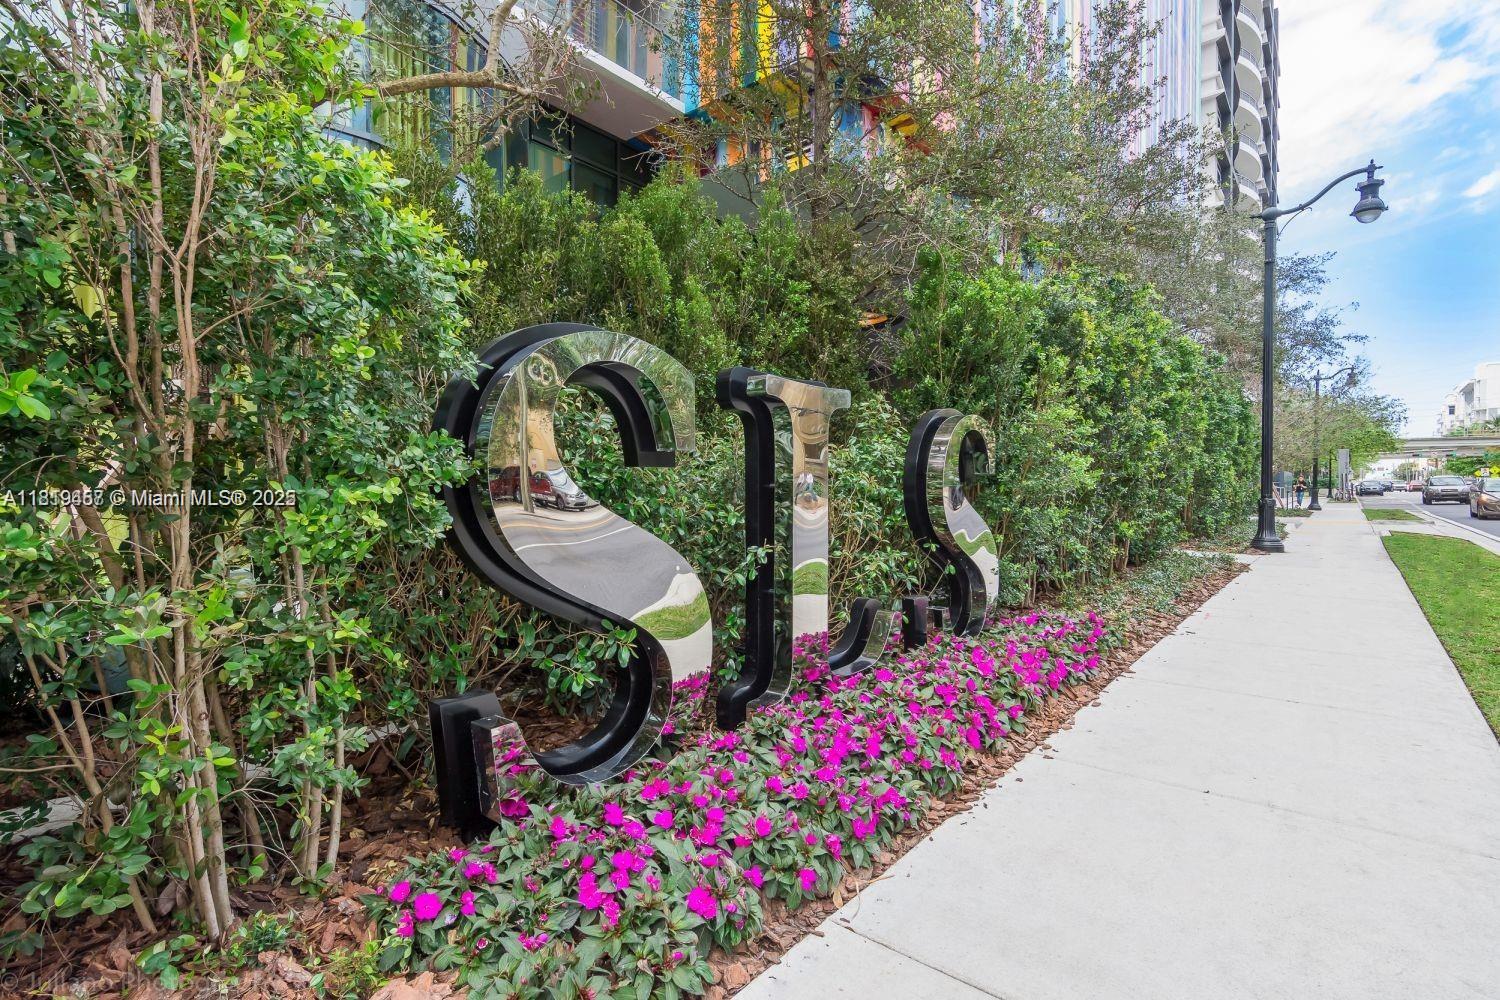
2457 Collins Ave, Miami Beach, FL 33140
$-2,964
Cash flow
-28.4%
Cash-on-Cash Return
-0.2%
Cap rate
0.5%
Rent to Value Ratio
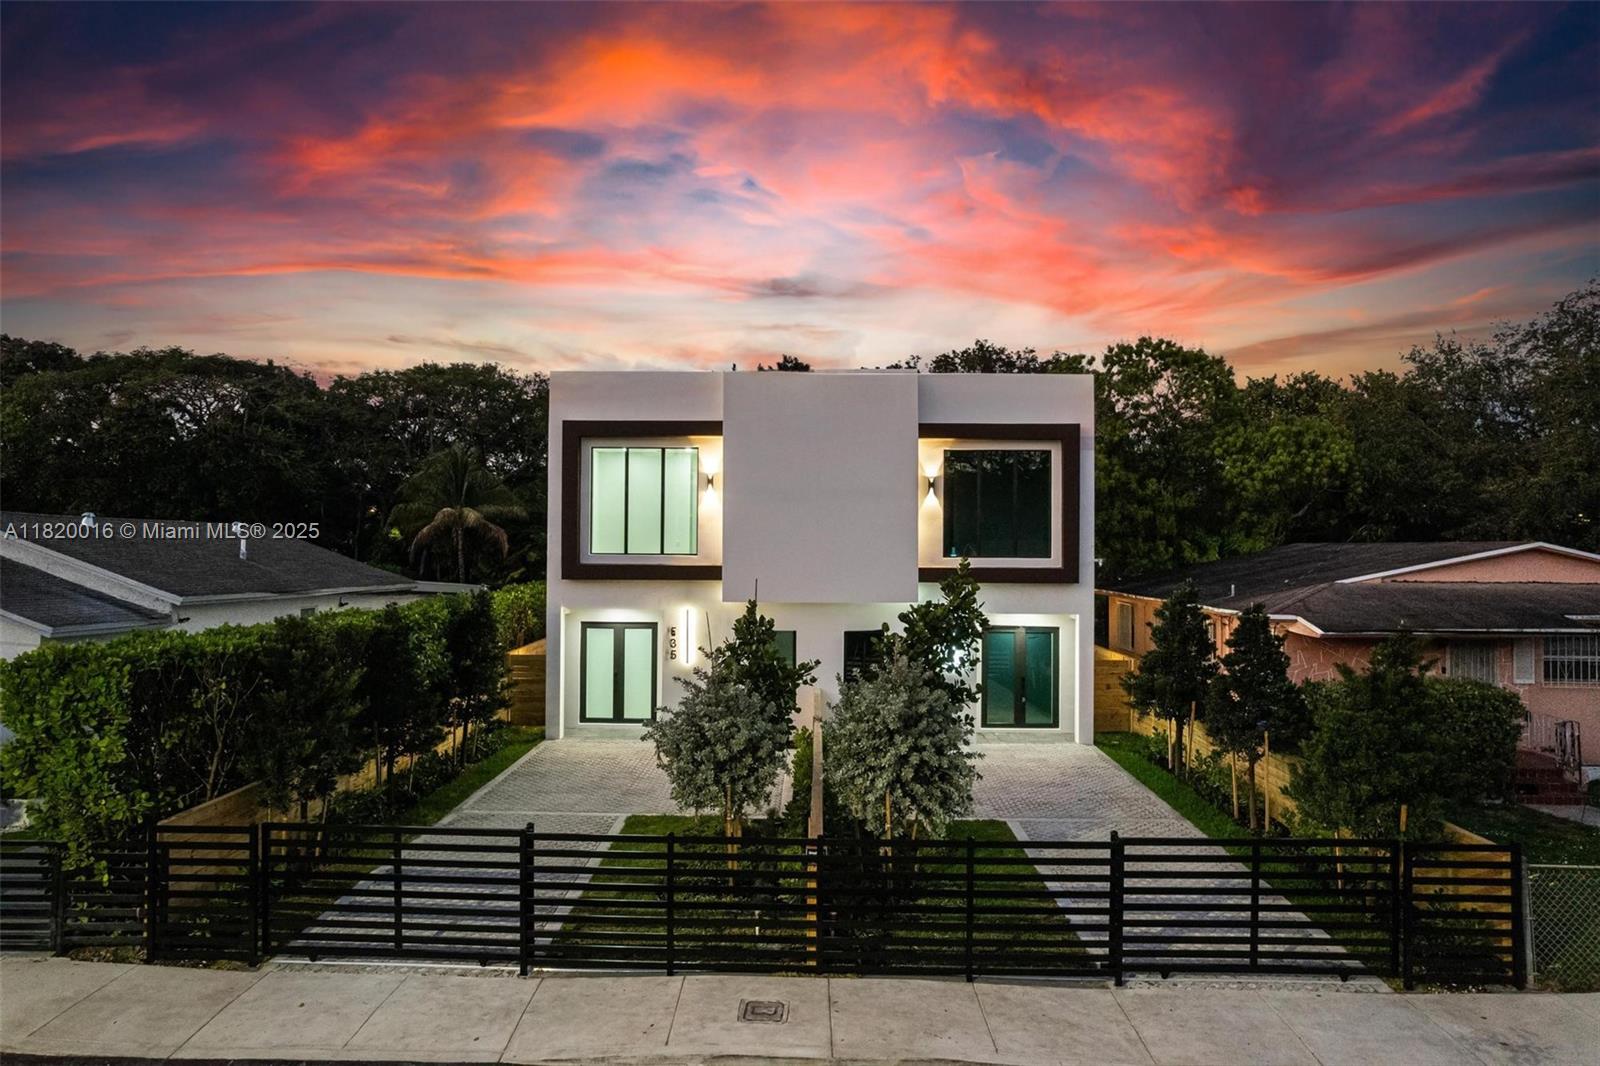
Active
$1,239,000
4
bds
|
3
ba
|
0
sqft
|
built
2025
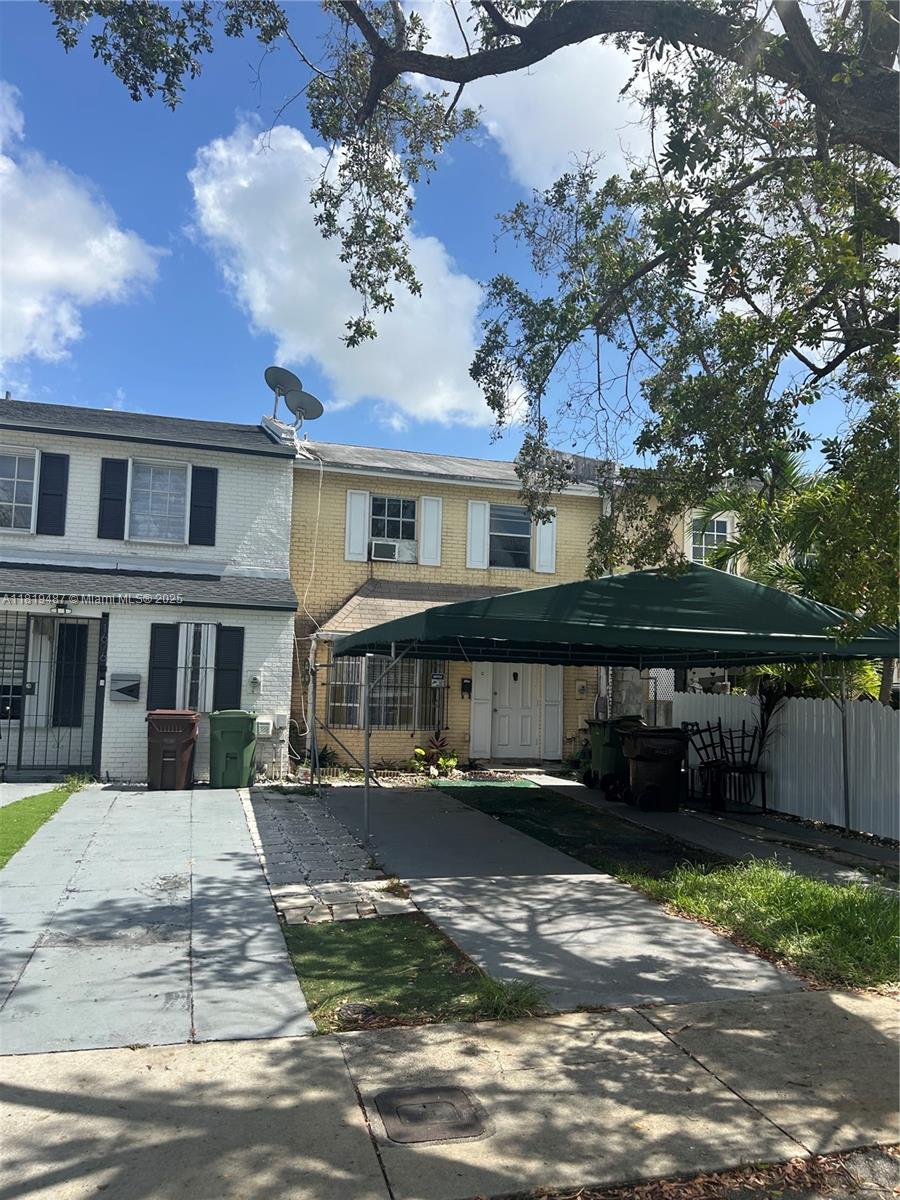
535 NW 52nd St, Miami, FL 33127
$-1,006
Cash flow
-4.2%
Cash-on-Cash Return
5.3%
Cap rate
0.7%
Rent to Value Ratio
Active
$330,000
2
bds
|
2
ba
|
968
sqft
|
built
1977
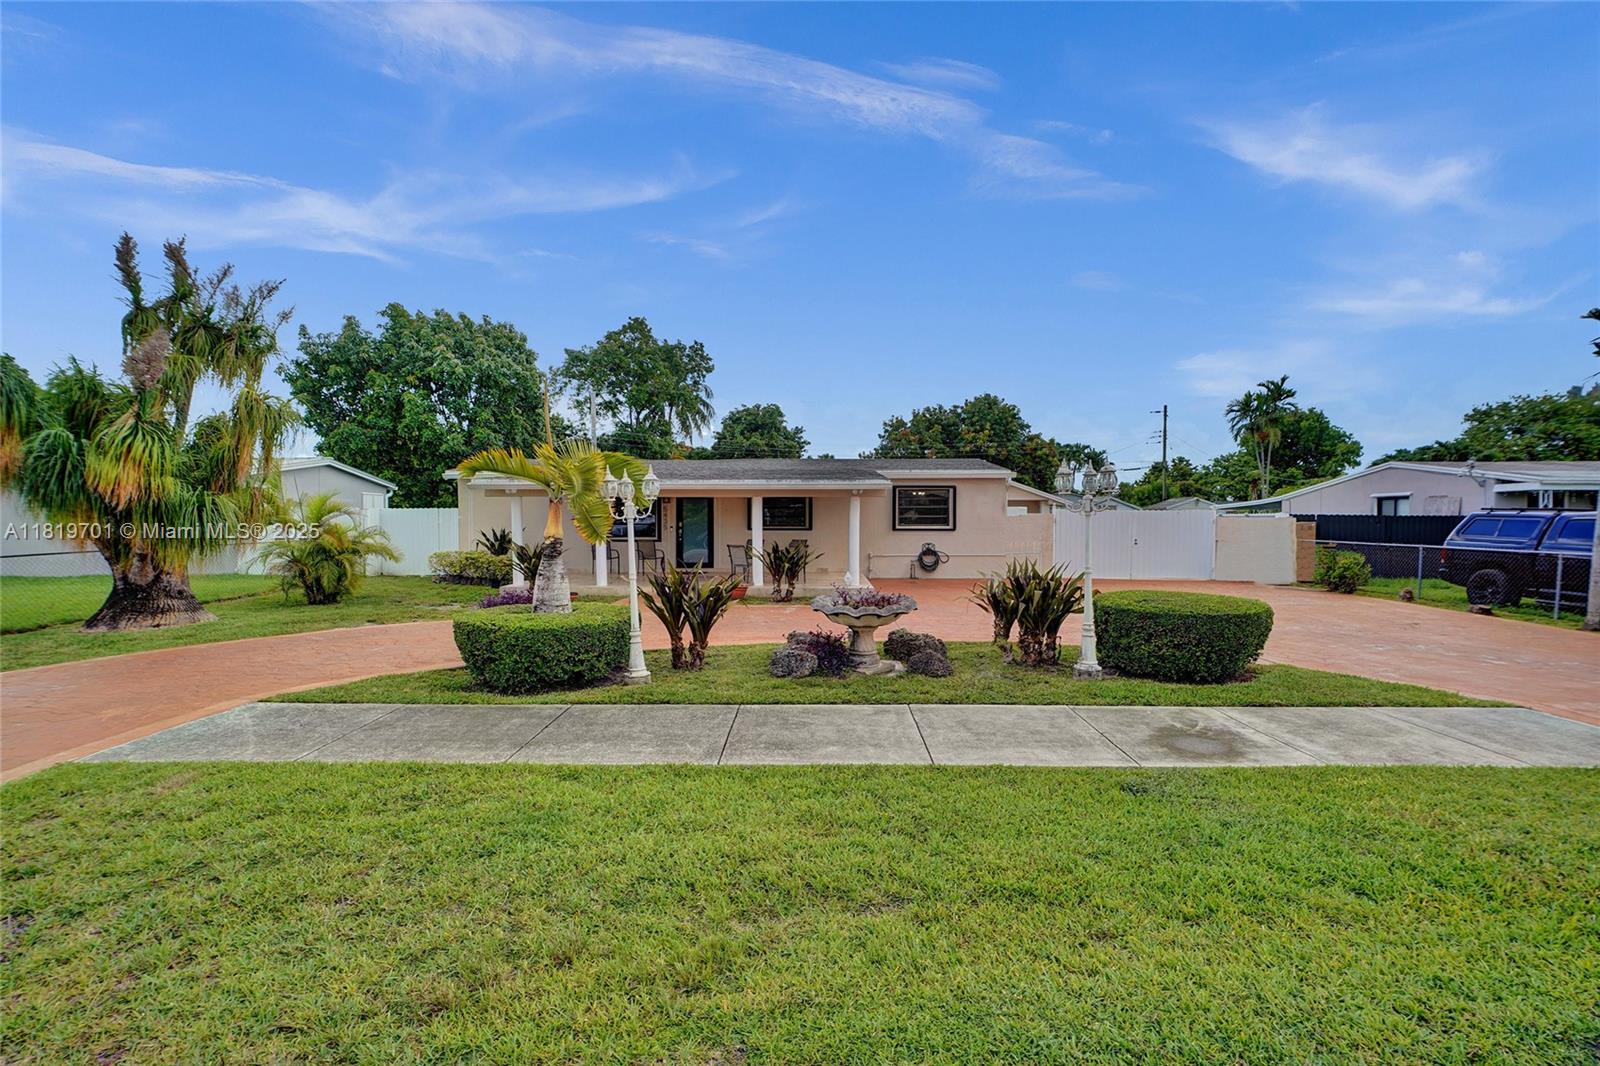
9301 SW 92nd Ave, Miami, FL 33176
$-1,153
Cash flow
-18.2%
Cash-on-Cash Return
2.1%
Cap rate
0.8%
Rent to Value Ratio
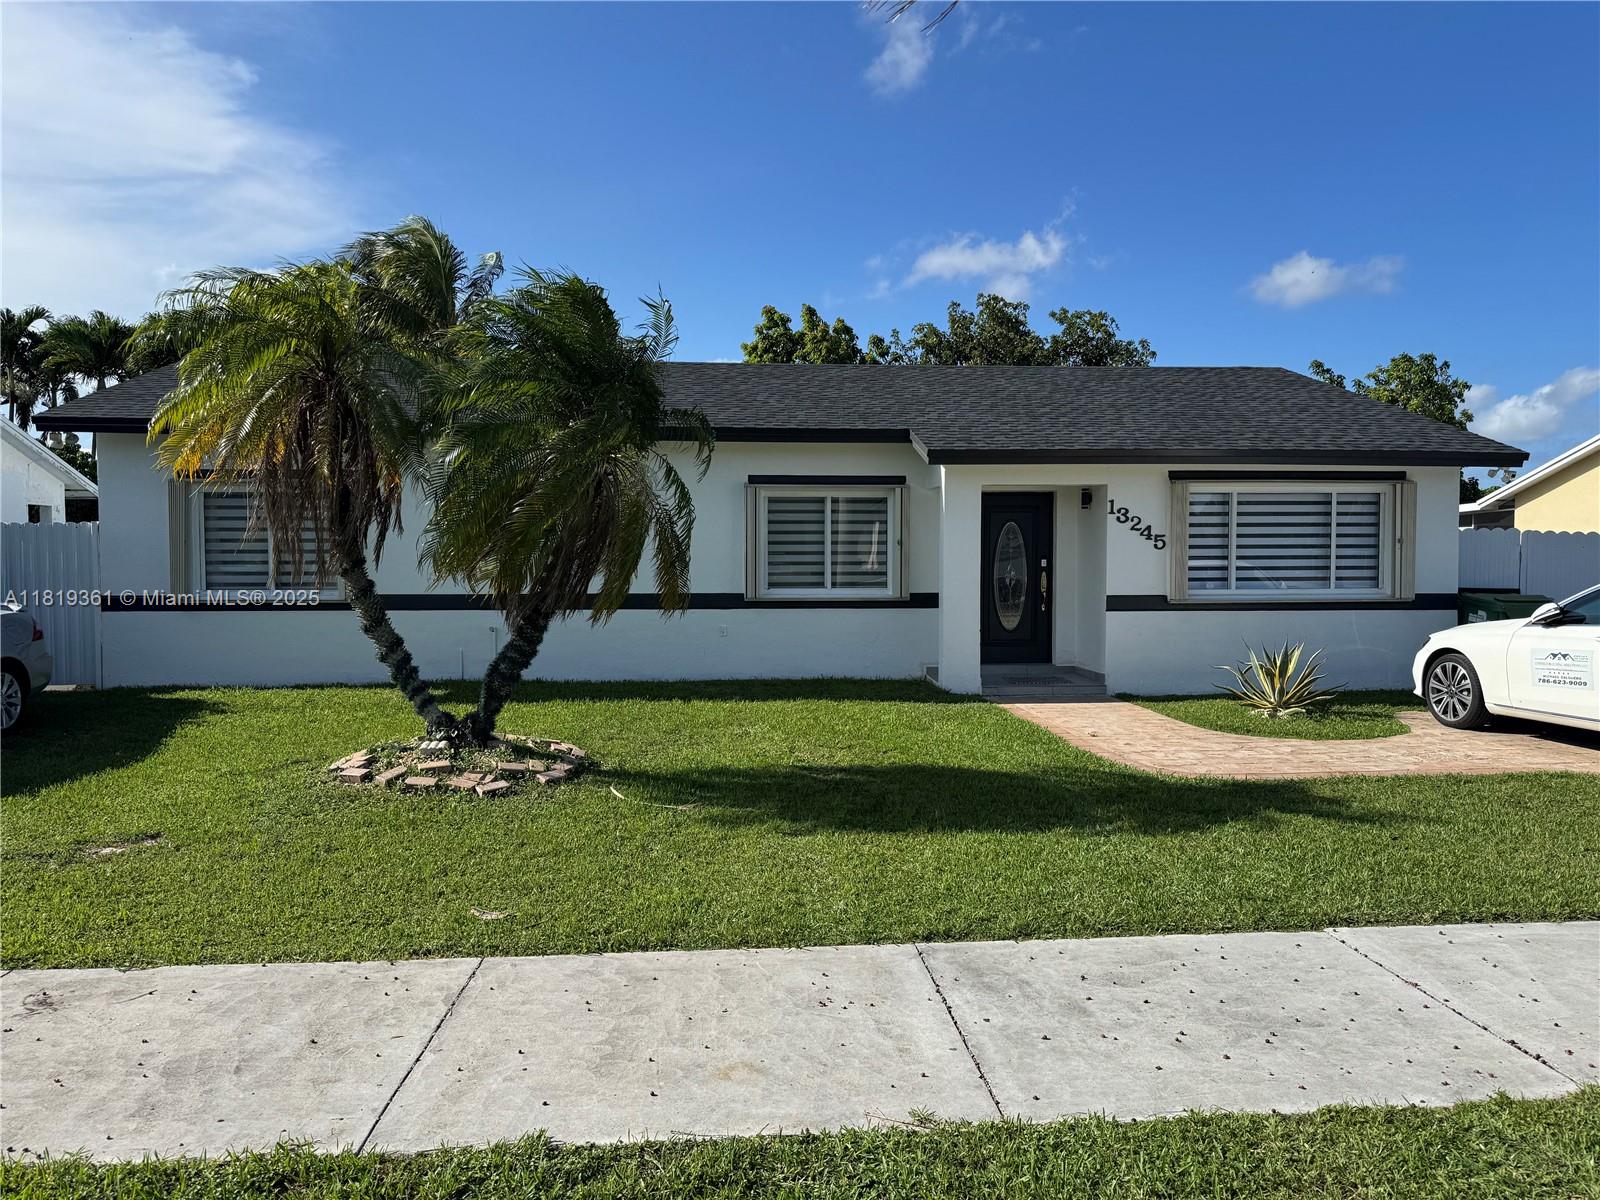
Active
$599,900
3
bds
|
2
ba
|
1,754
sqft
|
built
1994
13245 SW 253rd Ter, Homestead, FL 33032
$-1,509
Cash flow
-13.1%
Cash-on-Cash Return
3.3%
Cap rate
0.5%
Rent to Value Ratio
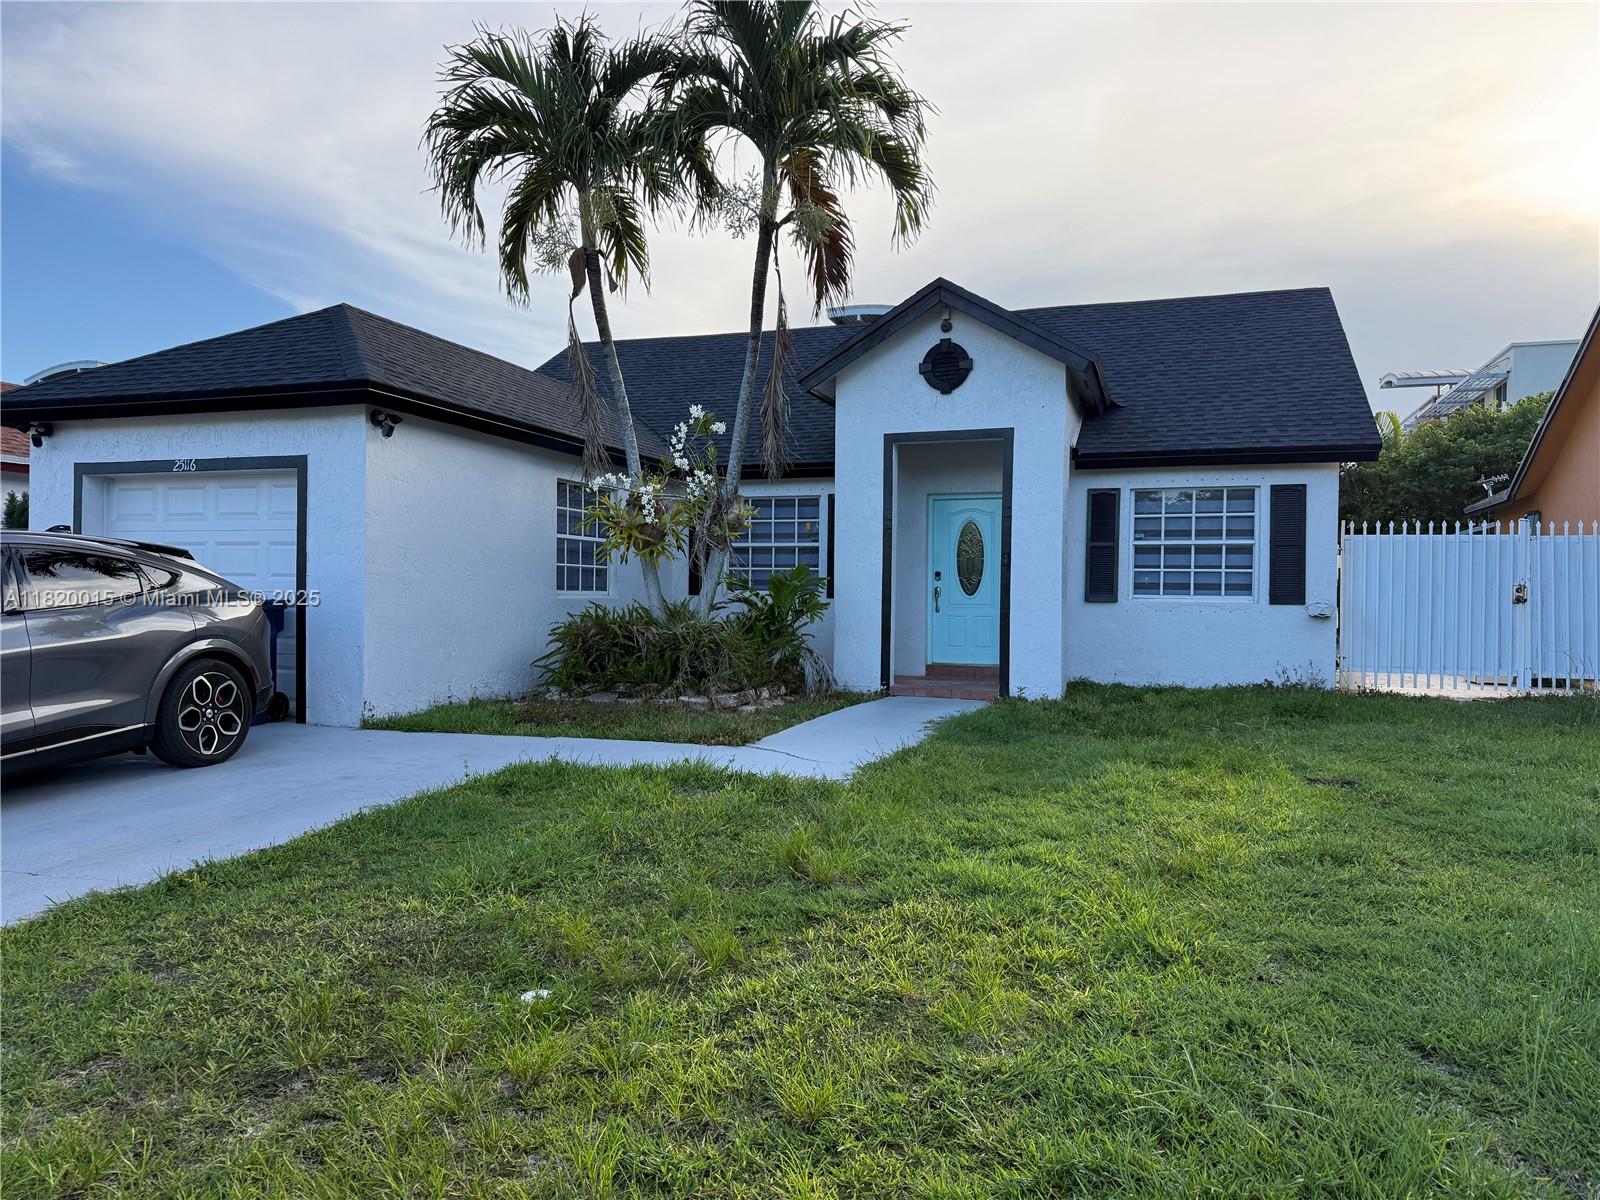
Active
$498,900
3
bds
|
2
ba
|
1,296
sqft
|
built
1996
25116 SW 129th Pl, Homestead, FL 33032
$-827
Cash flow
-8.6%
Cash-on-Cash Return
4.3%
Cap rate
0.6%
Rent to Value Ratio
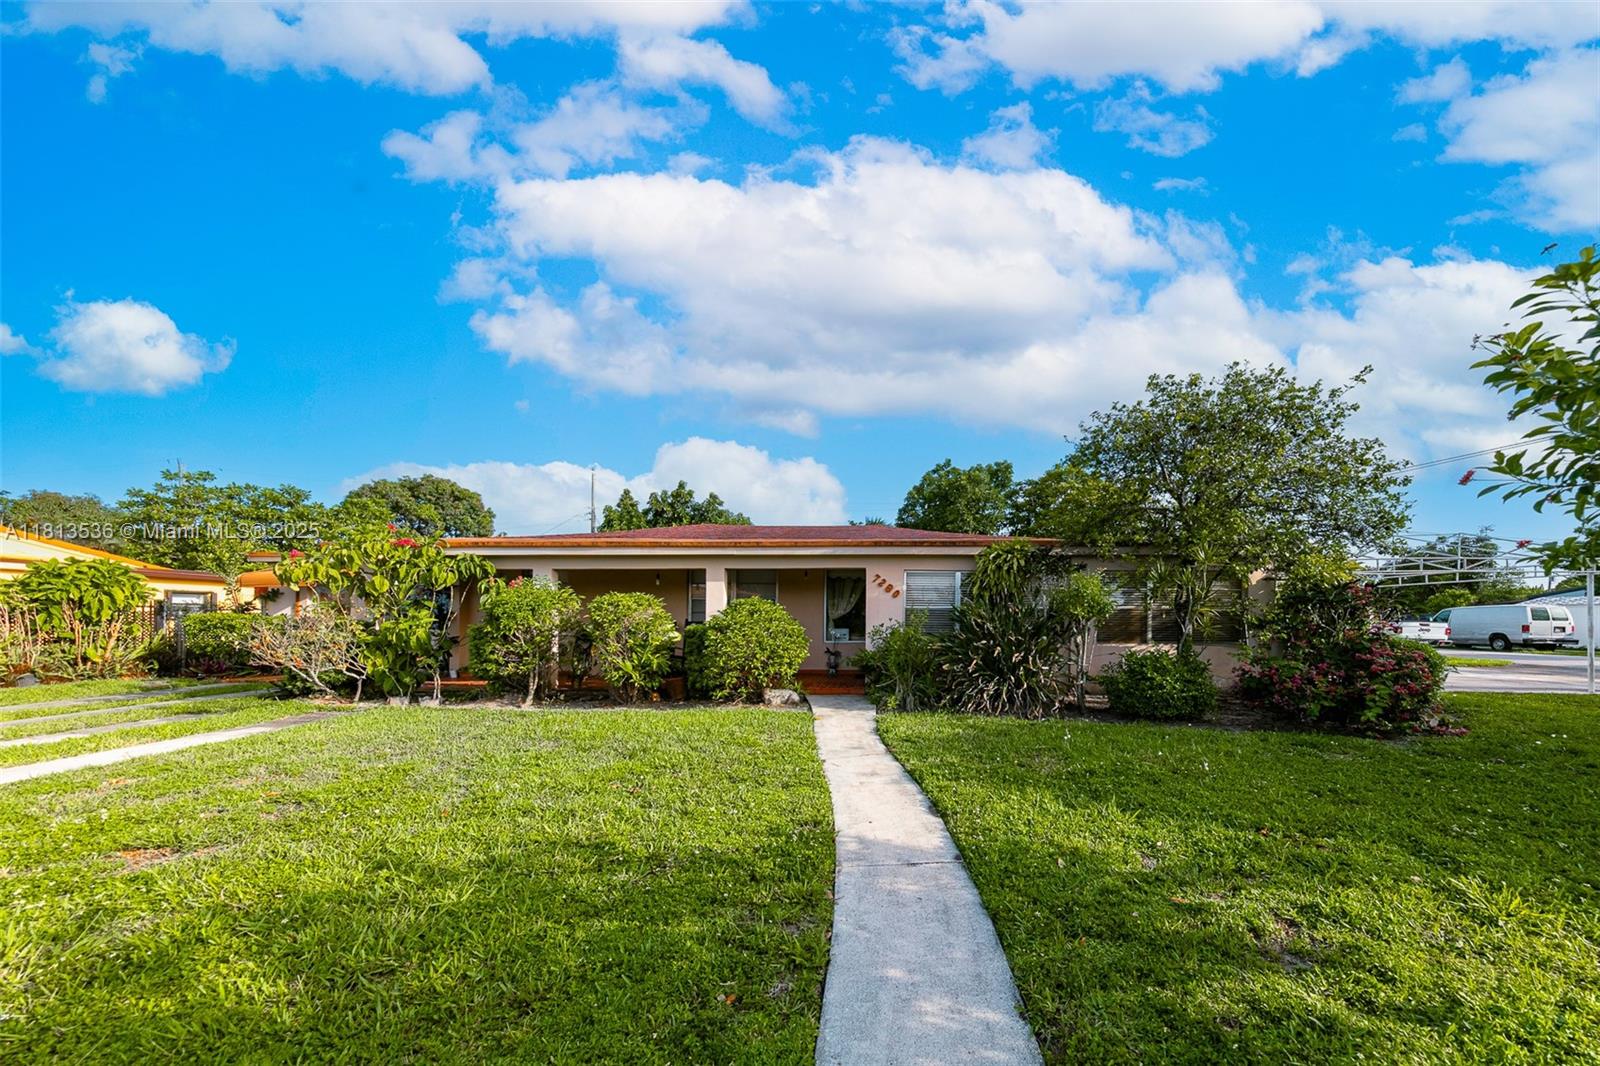
Active
$825,000
3
bds
|
3
ba
|
2,823
sqft
|
built
1949
7280 SW 9th St, Miami, FL 33144
$-1,717
Cash flow
-10.9%
Cash-on-Cash Return
3.8%
Cap rate
0.5%
Rent to Value Ratio
Active
$195,000
1
bds
|
2
ba
|
920
sqft
|
built
1978
28133 SW 142nd Ct, Homestead, FL 33033
$50
Cash flow
1.3%
Cash-on-Cash Return
6.6%
Cap rate
1.0%
Rent to Value Ratio
Active
$240,000
3
bds
|
2
ba
|
1,200
sqft
|
built
1978
28152 SW 142nd Ct, Homestead, FL 33033
$96
Cash flow
2.1%
Cash-on-Cash Return
6.8%
Cap rate
1.0%
Rent to Value Ratio
Active
$420,000
3
bds
|
2
ba
|
1,505
sqft
|
built
1973
131 NE 18th St, Homestead, FL 33030
$-436
Cash flow
-5.4%
Cash-on-Cash Return
5.0%
Cap rate
0.7%
Rent to Value Ratio
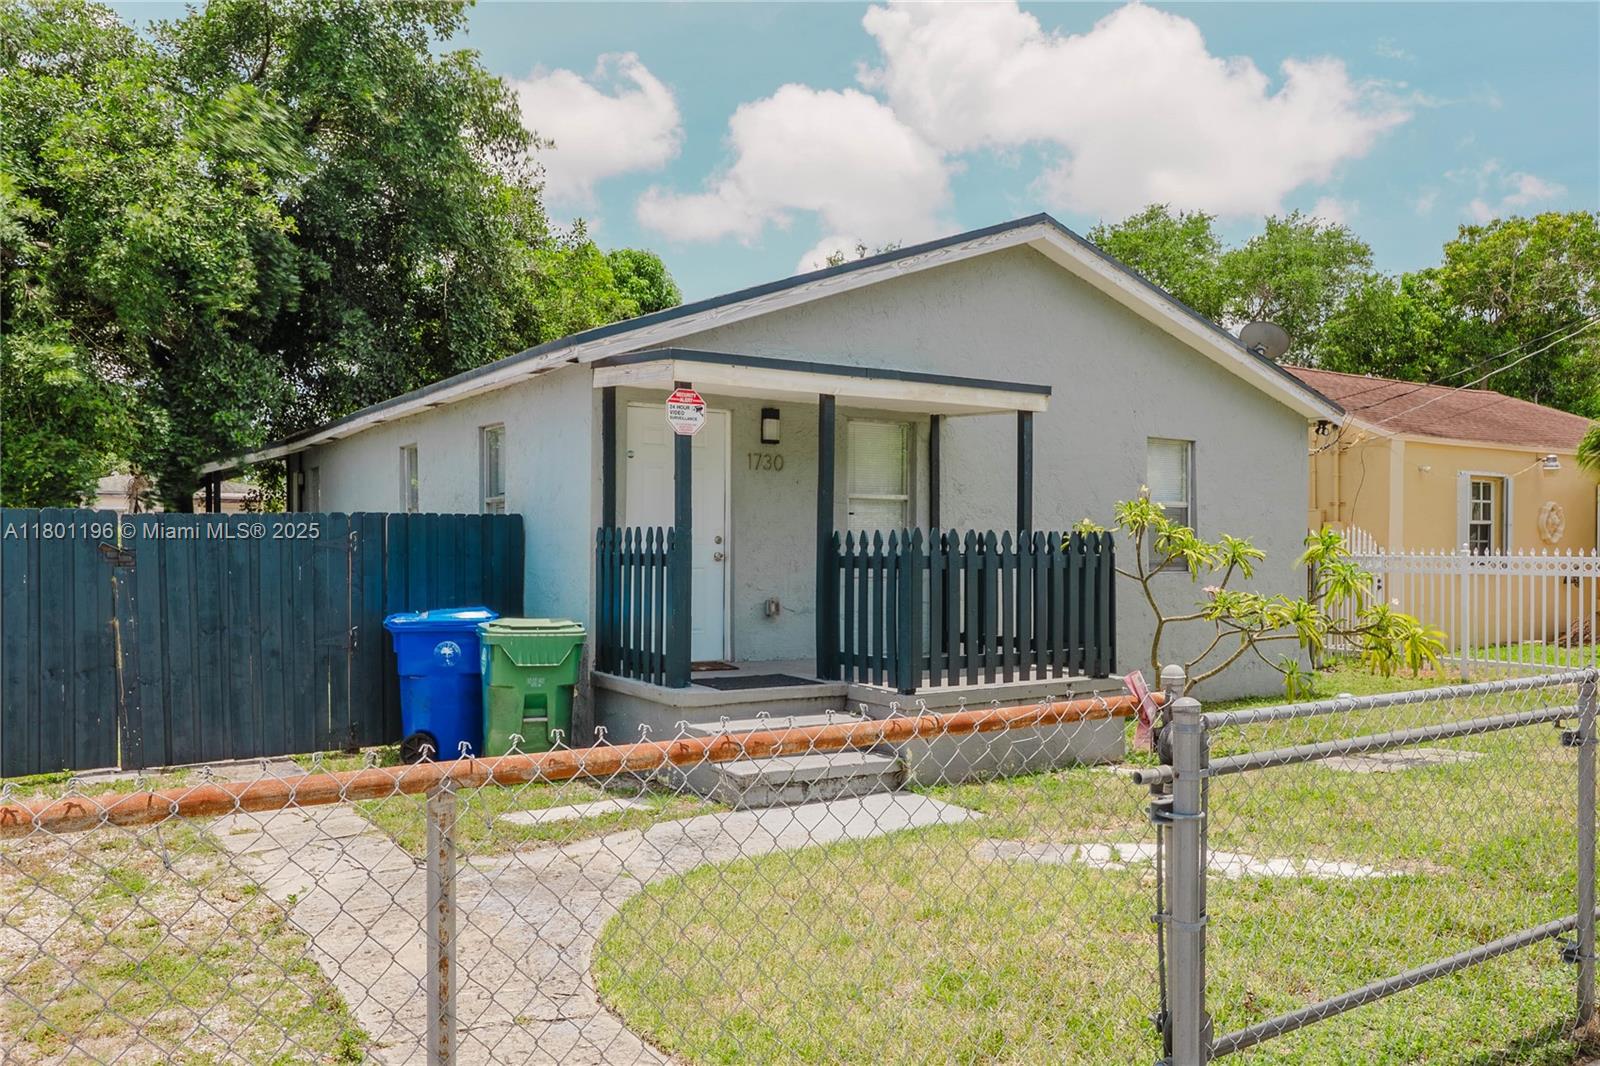
Active
$460,000
3
bds
|
2
ba
|
1,120
sqft
|
built
1946
1730 NW 58th St, Miami, FL 33142
$-850
Cash flow
-9.6%
Cash-on-Cash Return
4.1%
Cap rate
0.6%
Rent to Value Ratio
Active
$195,000
1
bds
|
2
ba
|
920
sqft
|
built
1978
28025 SW 142nd Ct, Homestead, FL 33033
$39
Cash flow
1.0%
Cash-on-Cash Return
6.5%
Cap rate
1.0%
Rent to Value Ratio
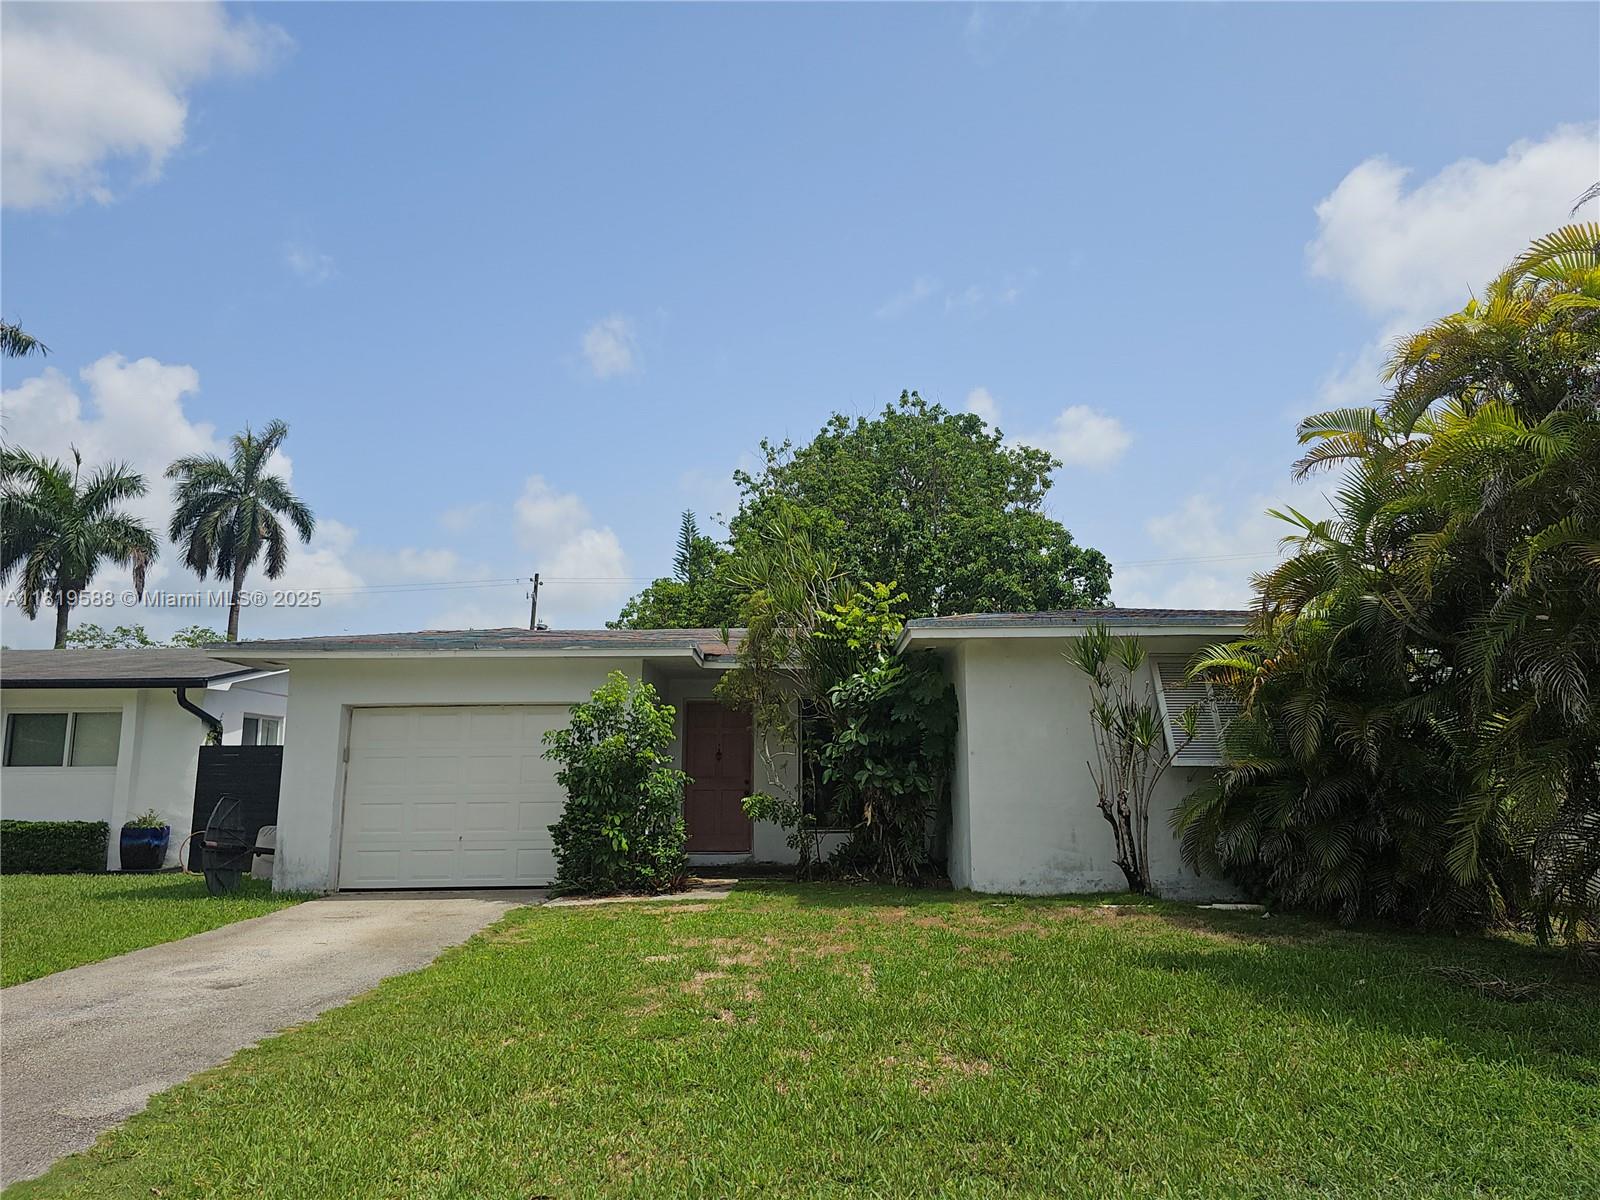
Active
$875,000
3
bds
|
2
ba
|
1,400
sqft
|
built
1963
11150 SW 64th St, Miami, FL 33173
$-2,228
Cash flow
-13.3%
Cash-on-Cash Return
3.2%
Cap rate
0.4%
Rent to Value Ratio
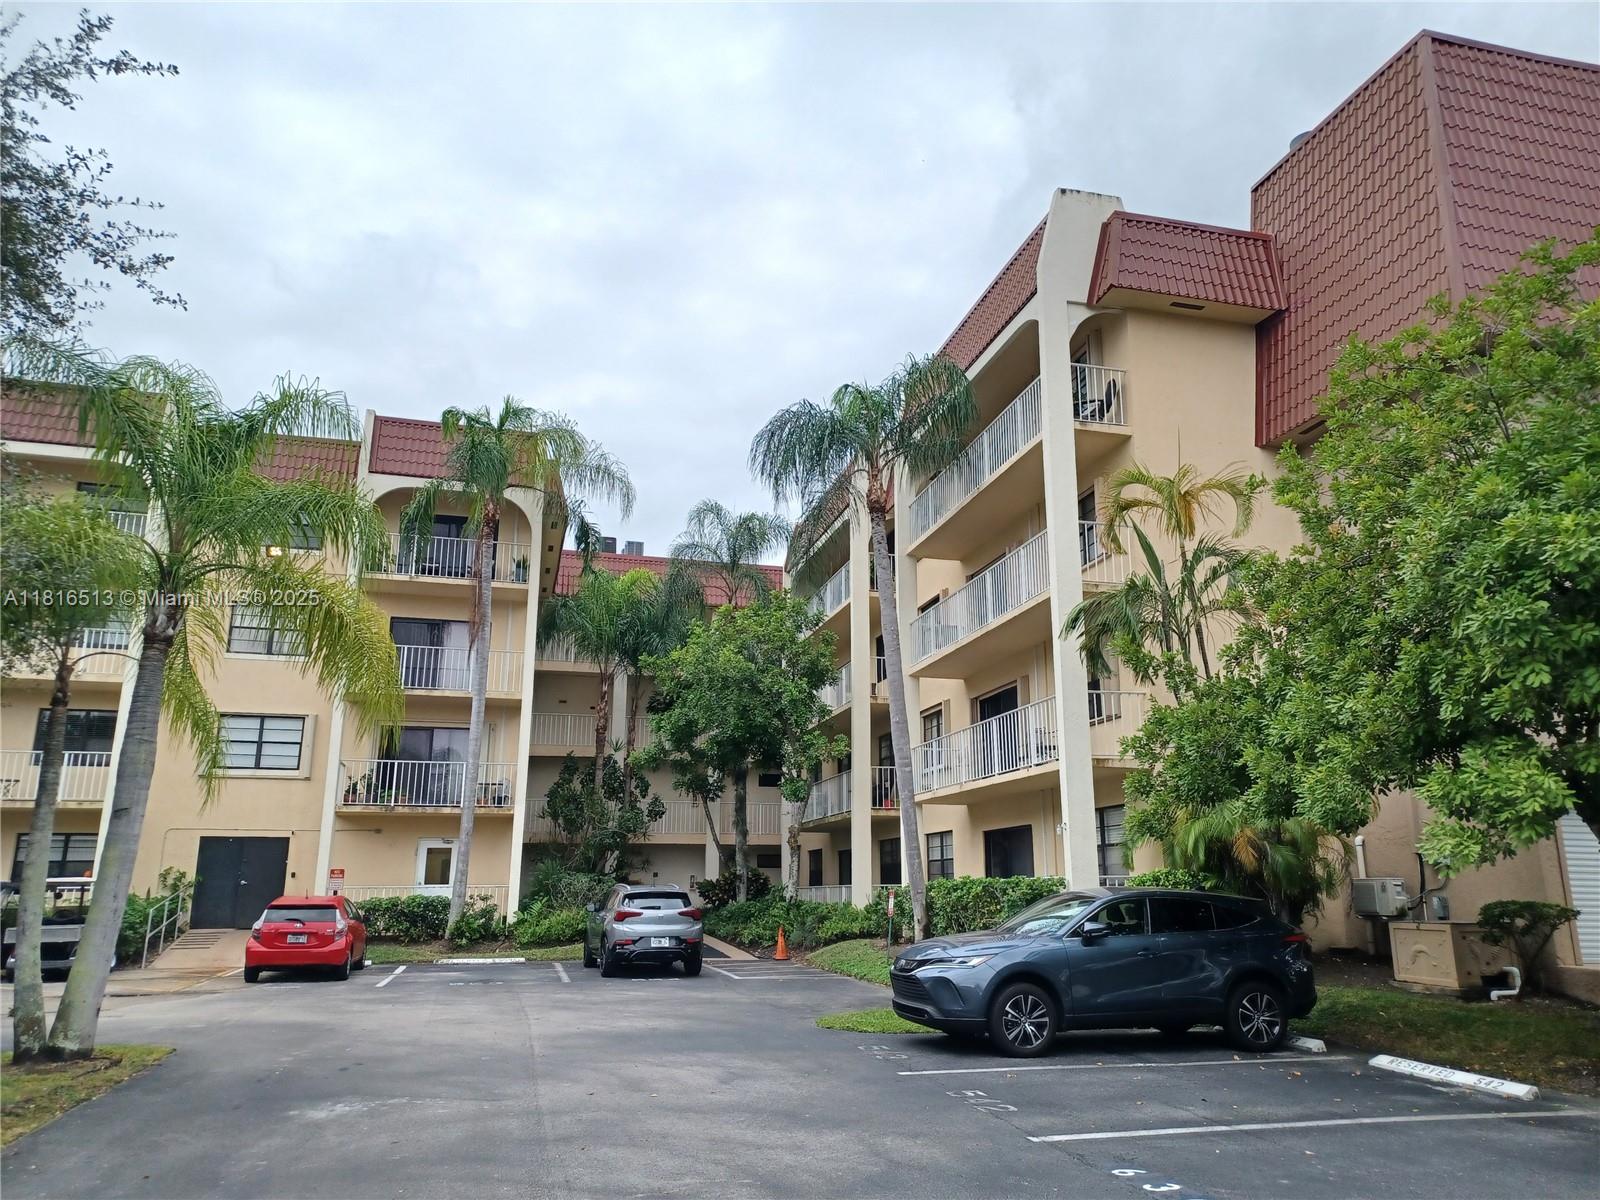
Active
$450,000
2
bds
|
2
ba
|
1,220
sqft
|
built
1974
2801 NE 183rd St, Aventura, FL 33160
$-1,771
Cash flow
-20.5%
Cash-on-Cash Return
1.6%
Cap rate
0.6%
Rent to Value Ratio
Active
$519,000
1
bds
|
2
ba
|
848
sqft
|
built
1974
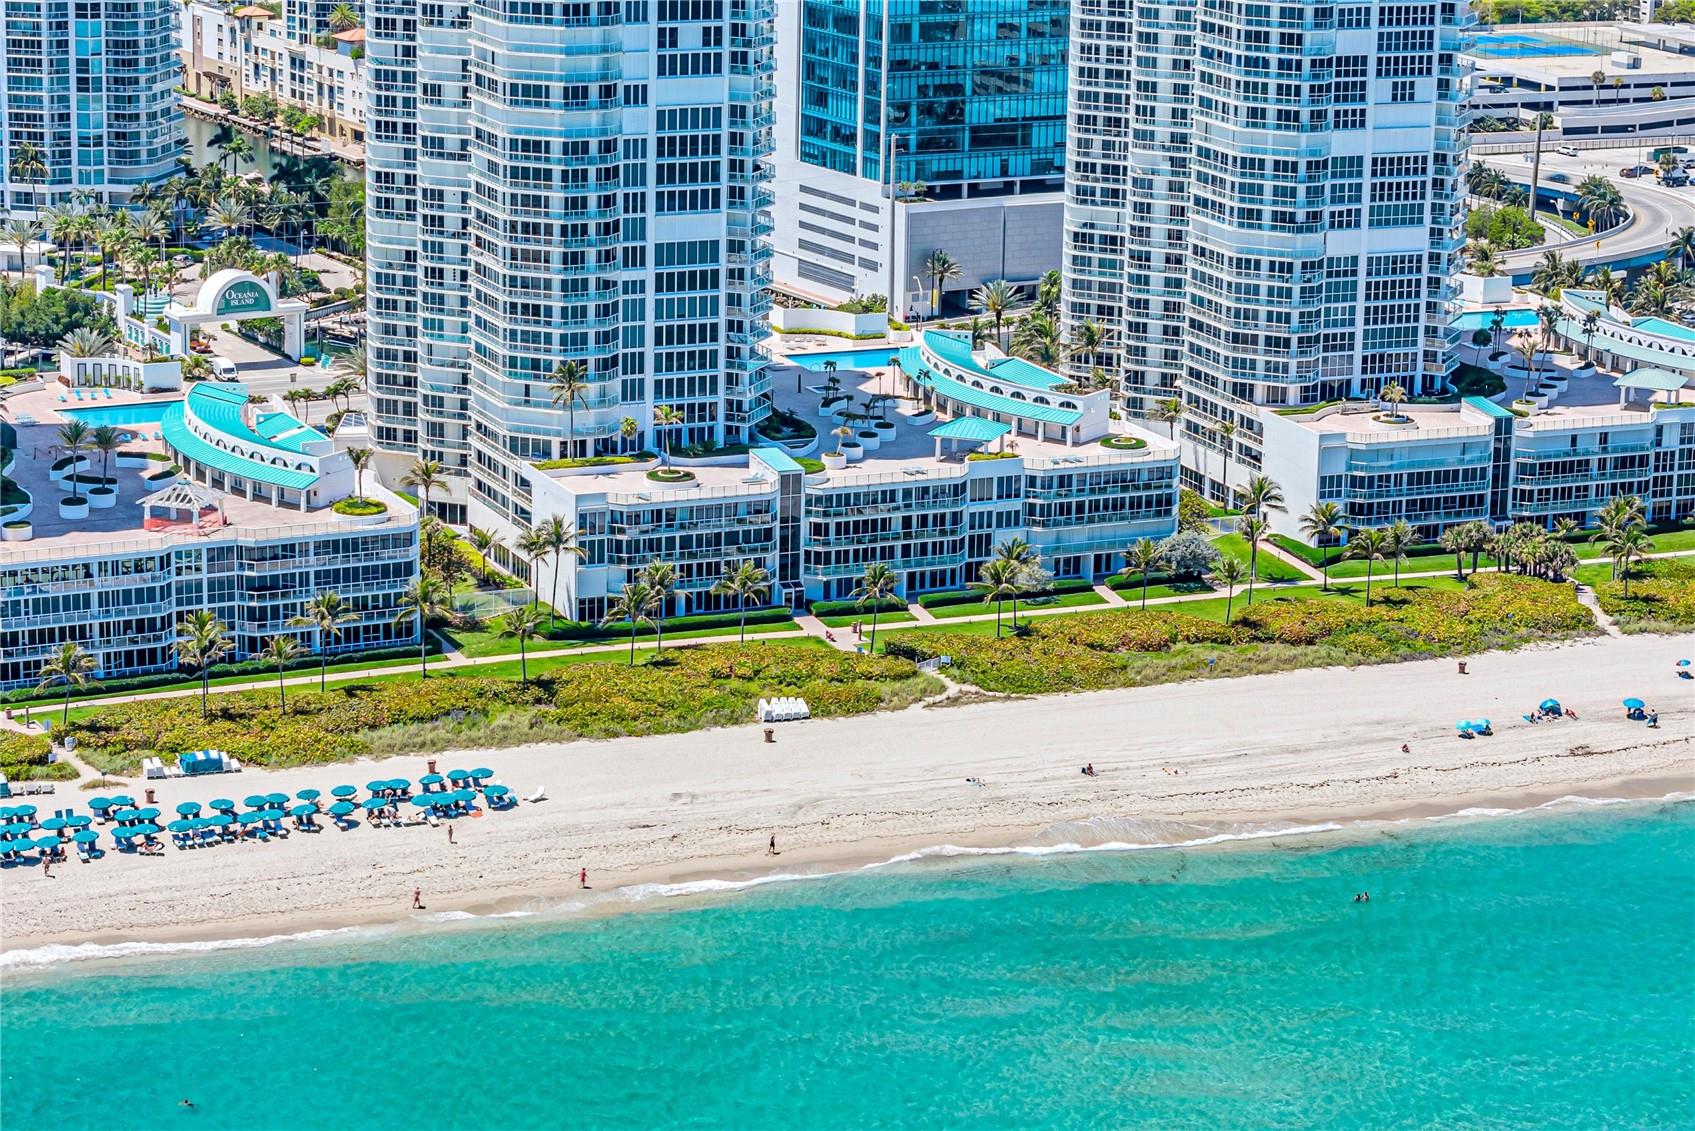
9273 Collins Ave, Surfside, FL 33154
$-1,943
Cash flow
-19.5%
Cash-on-Cash Return
1.8%
Cap rate
0.6%
Rent to Value Ratio
Active
$271,000
0
bds
|
1
ba
|
600
sqft
|
built
1966
800 West Ave, Miami Beach, FL 33139
$-1,322
Cash flow
-25.5%
Cash-on-Cash Return
0.4%
Cap rate
0.8%
Rent to Value Ratio
Active
$2,750,000
4
bds
|
3
ba
|
3,542
sqft
|
built
1969
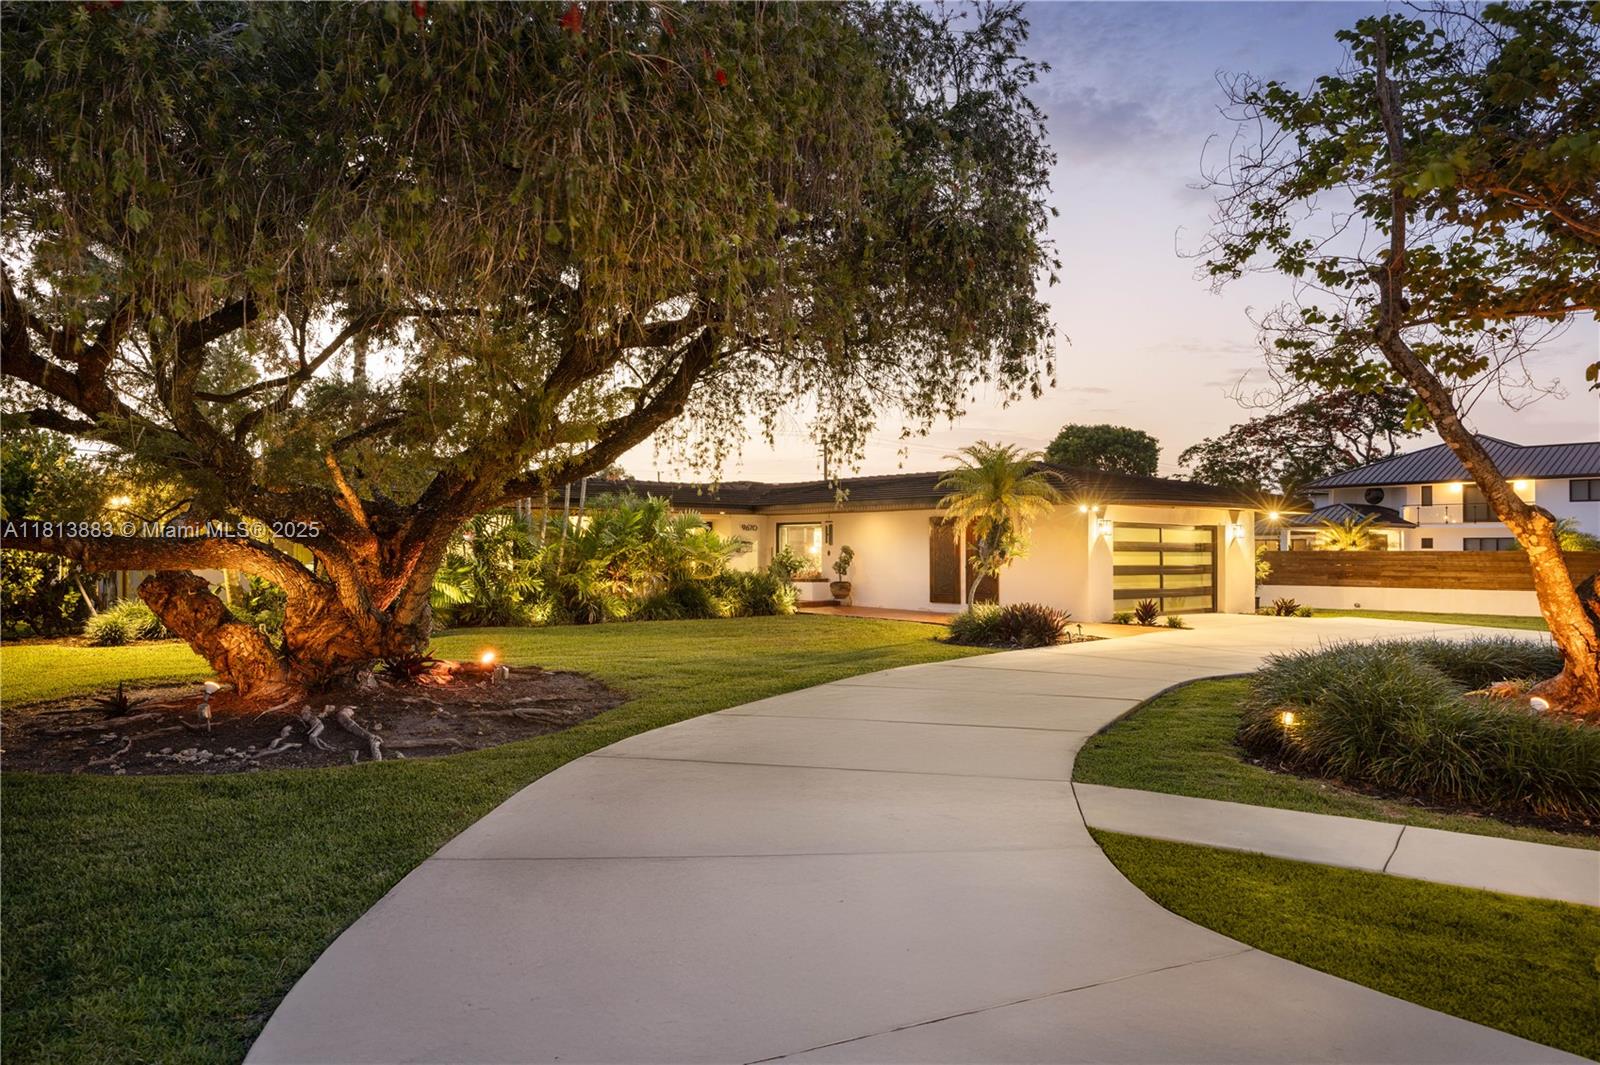
9670 SW 96th Ct, Miami, FL 33176
$-11,198
Cash flow
-21.2%
Cash-on-Cash Return
1.4%
Cap rate
0.3%
Rent to Value Ratio
Active
$605,000
bds
|
1
ba
|
626
sqft
|
built
2018
801 S Miami Ave, Miami, FL 33130
$-3,686
Cash flow
-31.8%
Cash-on-Cash Return
-1.0%
Cap rate
0.5%
Rent to Value Ratio
Active
$760,000
4
bds
|
3
ba
|
2,009
sqft
|
built
1950
5435 SW 99th Ct, Miami, FL 33165
$-1,514
Cash flow
-10.4%
Cash-on-Cash Return
3.9%
Cap rate
0.5%
Rent to Value Ratio
Active
$575,000
1
bds
|
2
ba
|
780
sqft
|
built
1995
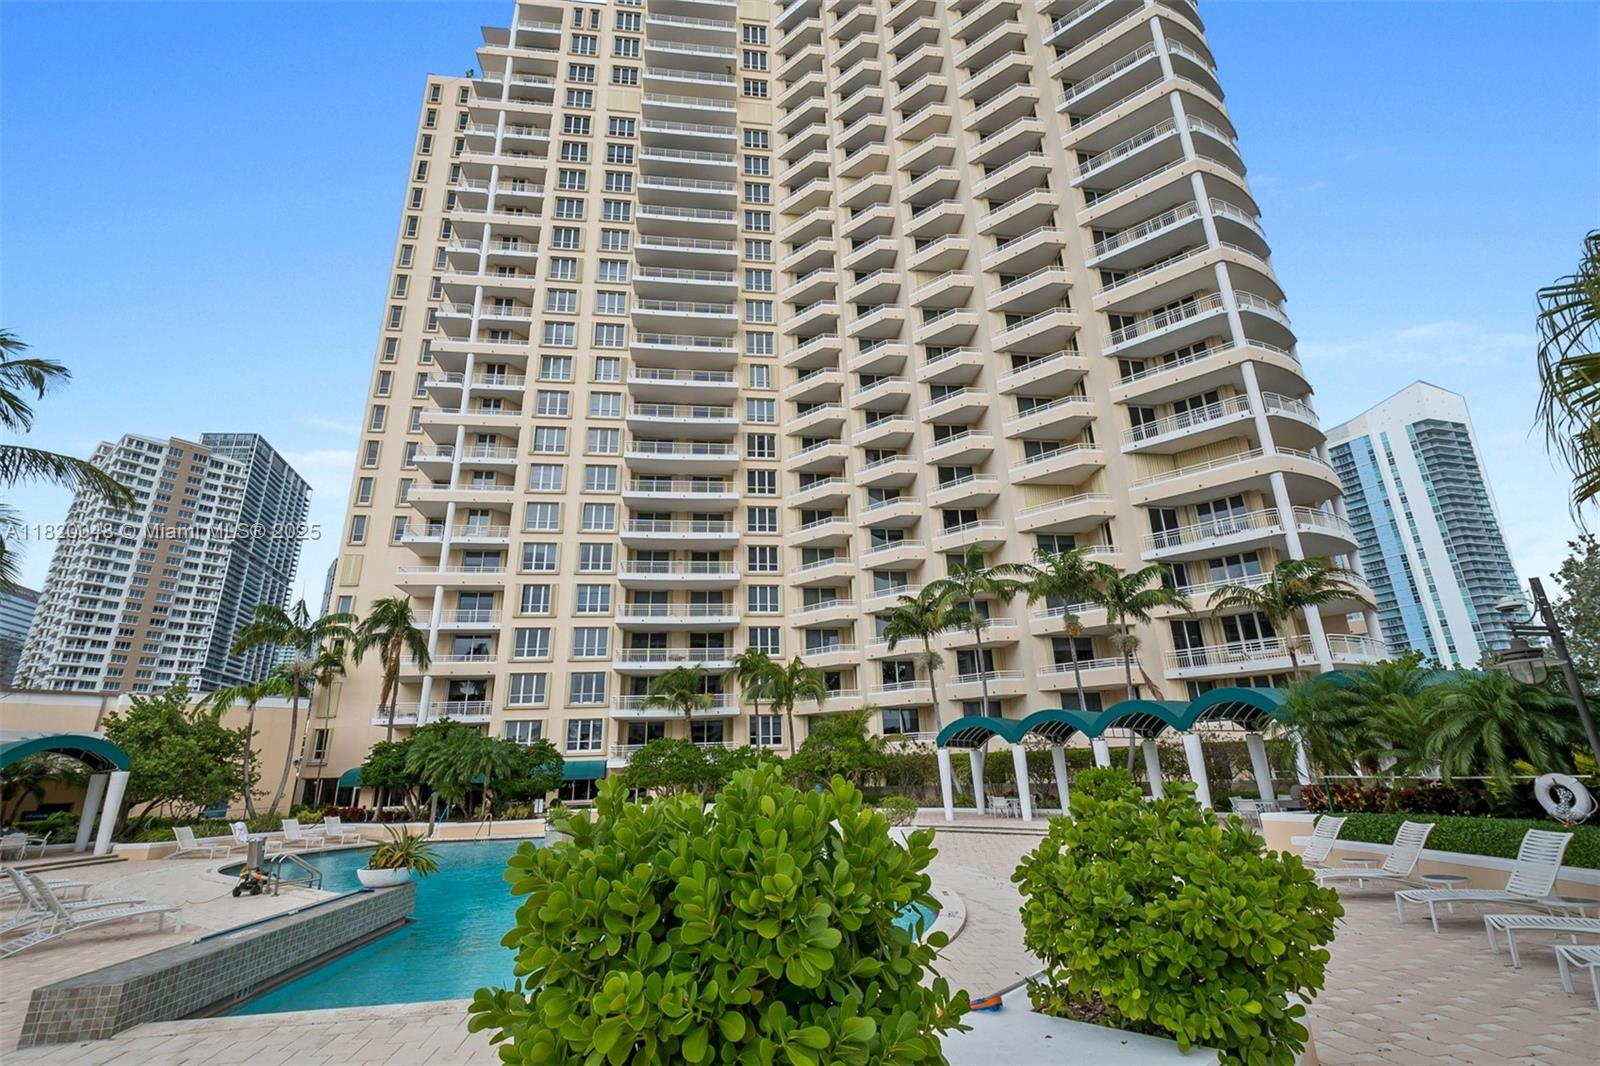
888 Brickell Key Dr, Miami, FL 33131
$-2,398
Cash flow
-21.8%
Cash-on-Cash Return
1.3%
Cap rate
0.6%
Rent to Value Ratio
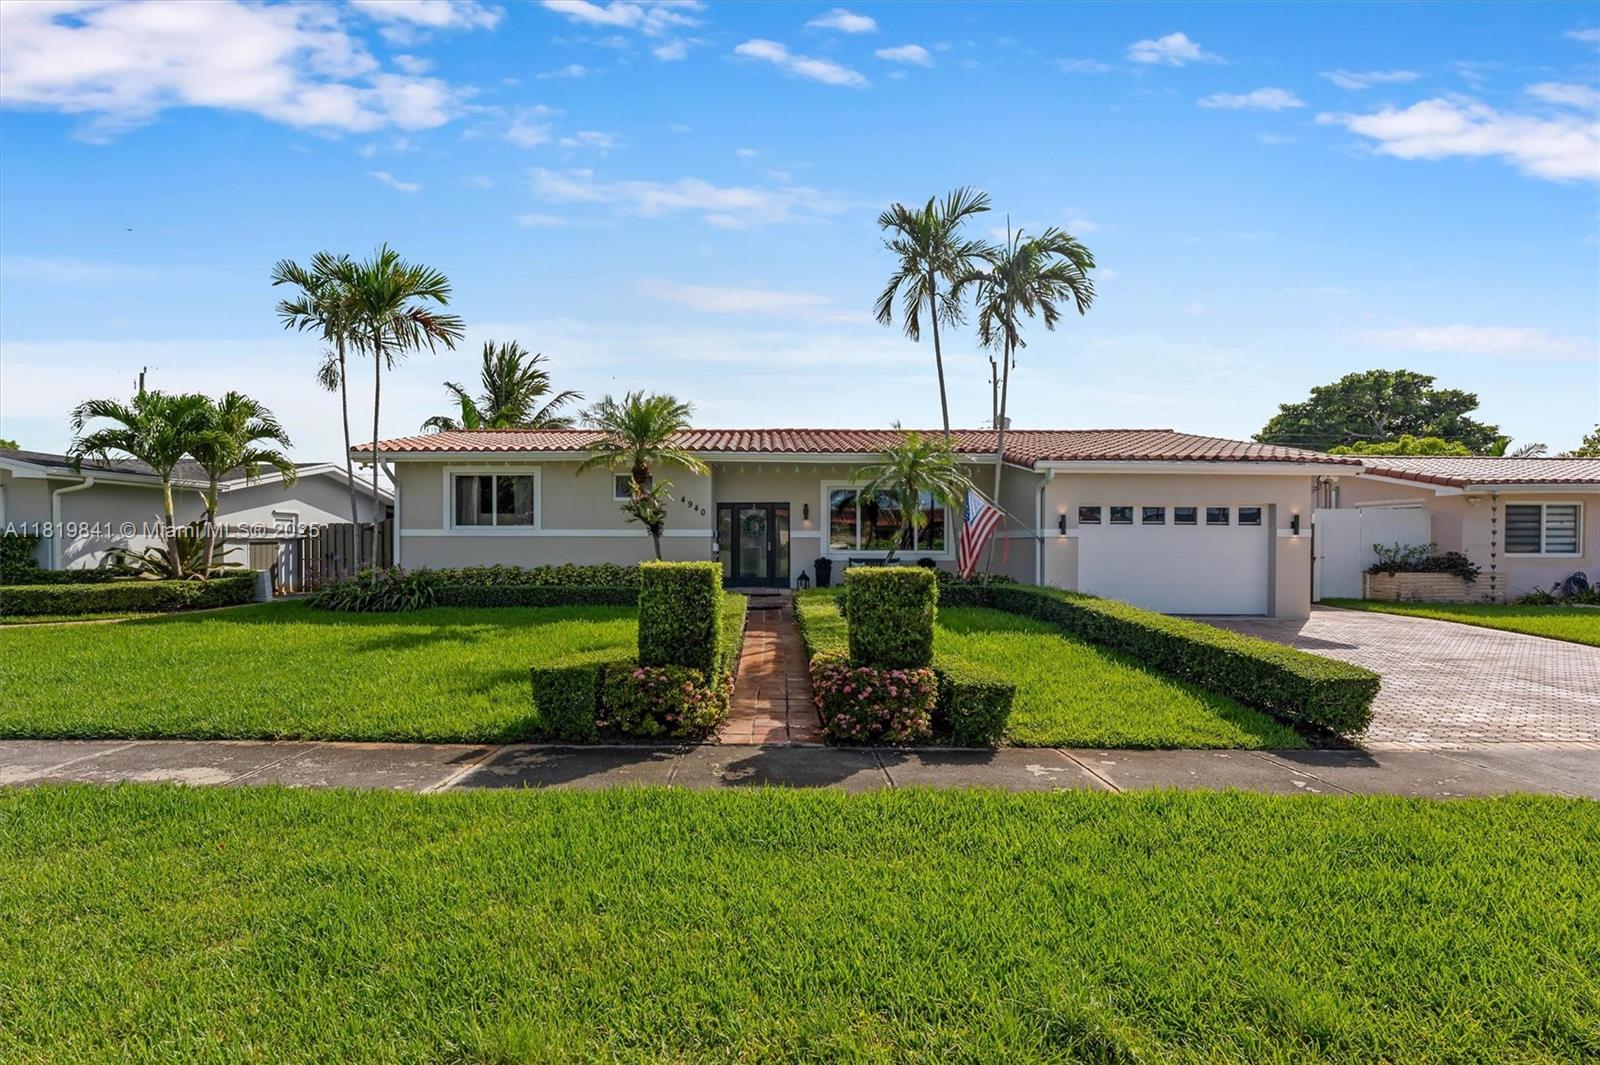
Active
$985,000
3
bds
|
3
ba
|
2,374
sqft
|
built
1959
4940 SW 90th Ct, Miami, FL 33165
$-2,440
Cash flow
-12.9%
Cash-on-Cash Return
3.3%
Cap rate
0.4%
Rent to Value Ratio
Active
$335,000
1
bds
|
1
ba
|
742
sqft
|
built
2006
4242 NW 2nd St, Miami, FL 33126
$-899
Cash flow
-14.0%
Cash-on-Cash Return
3.1%
Cap rate
0.7%
Rent to Value Ratio
Active
$235,000
2
bds
|
1
ba
|
828
sqft
|
built
1984
8365 SW 152nd Ave, Miami, FL 33193
$-515
Cash flow
-11.4%
Cash-on-Cash Return
3.7%
Cap rate
0.9%
Rent to Value Ratio
Active
$1,200,000
5
bds
|
0
ba
|
2,646
sqft
|
built
1944
520 NW 32nd Pl, Miami, FL 33125
$-5,478
Cash flow
-23.8%
Cash-on-Cash Return
0.8%
Cap rate
0.2%
Rent to Value Ratio
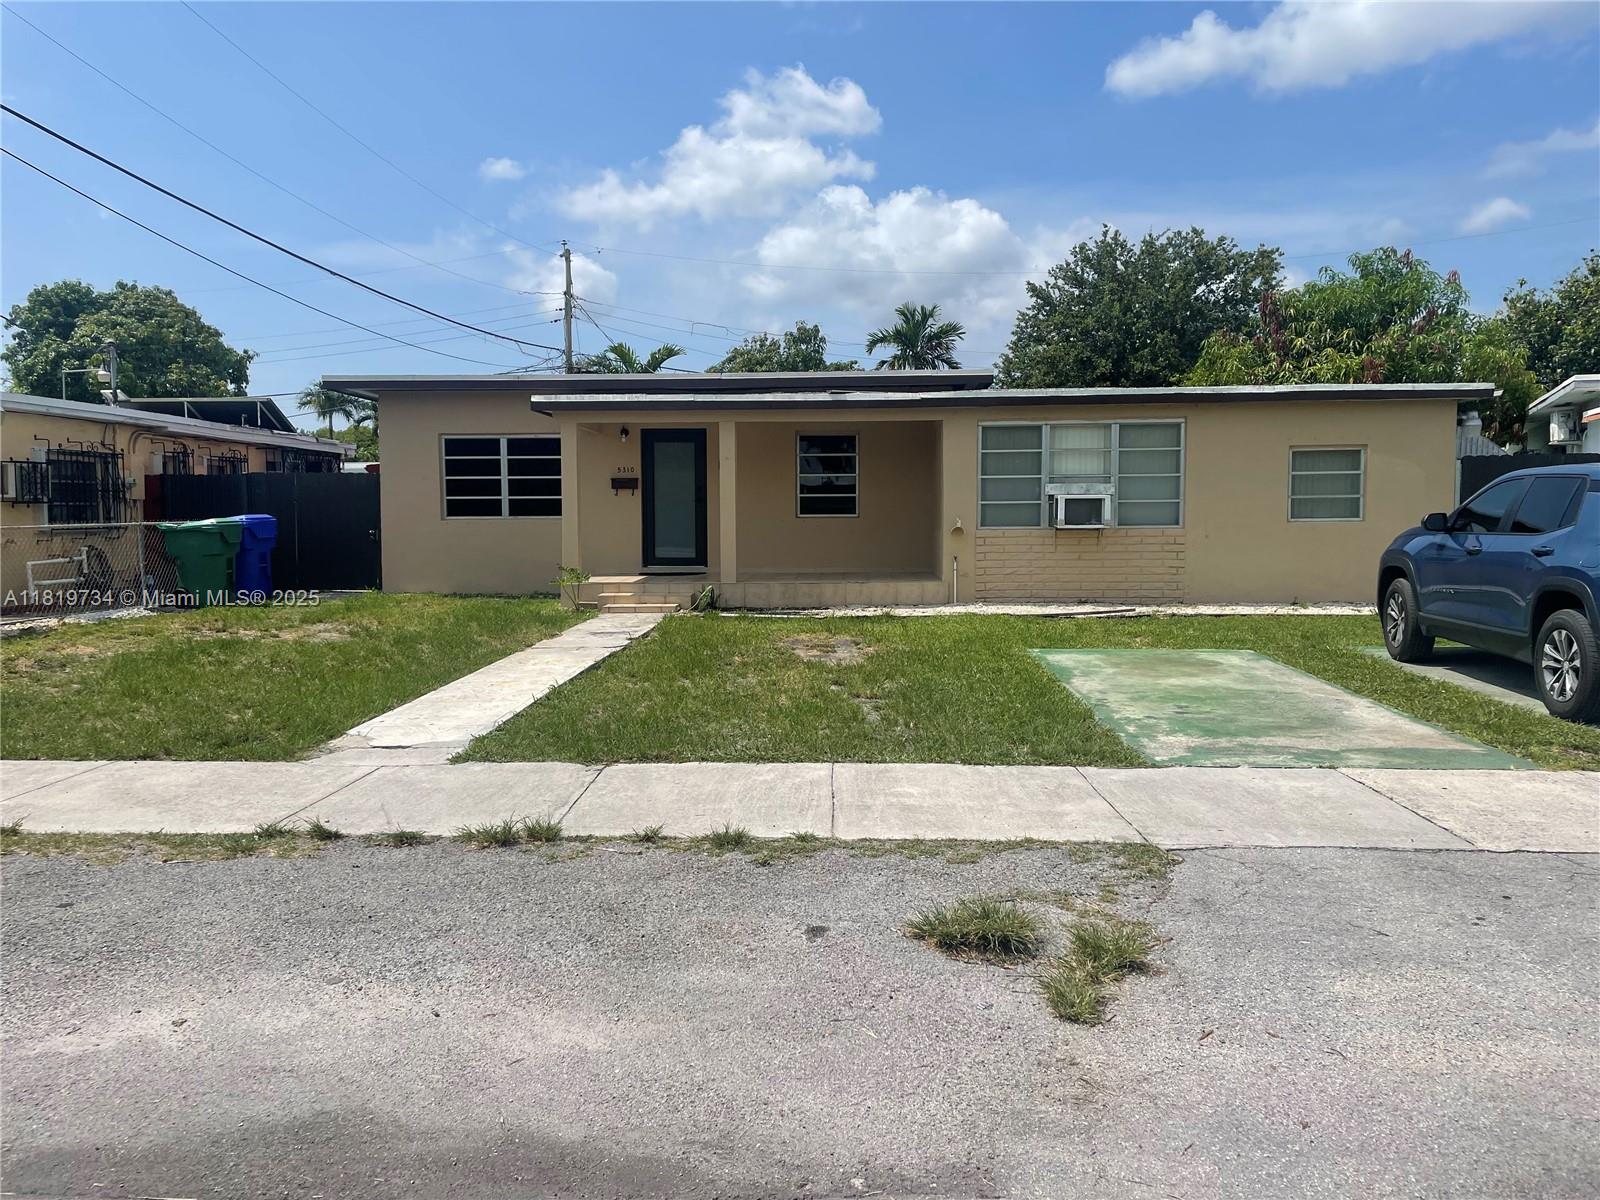
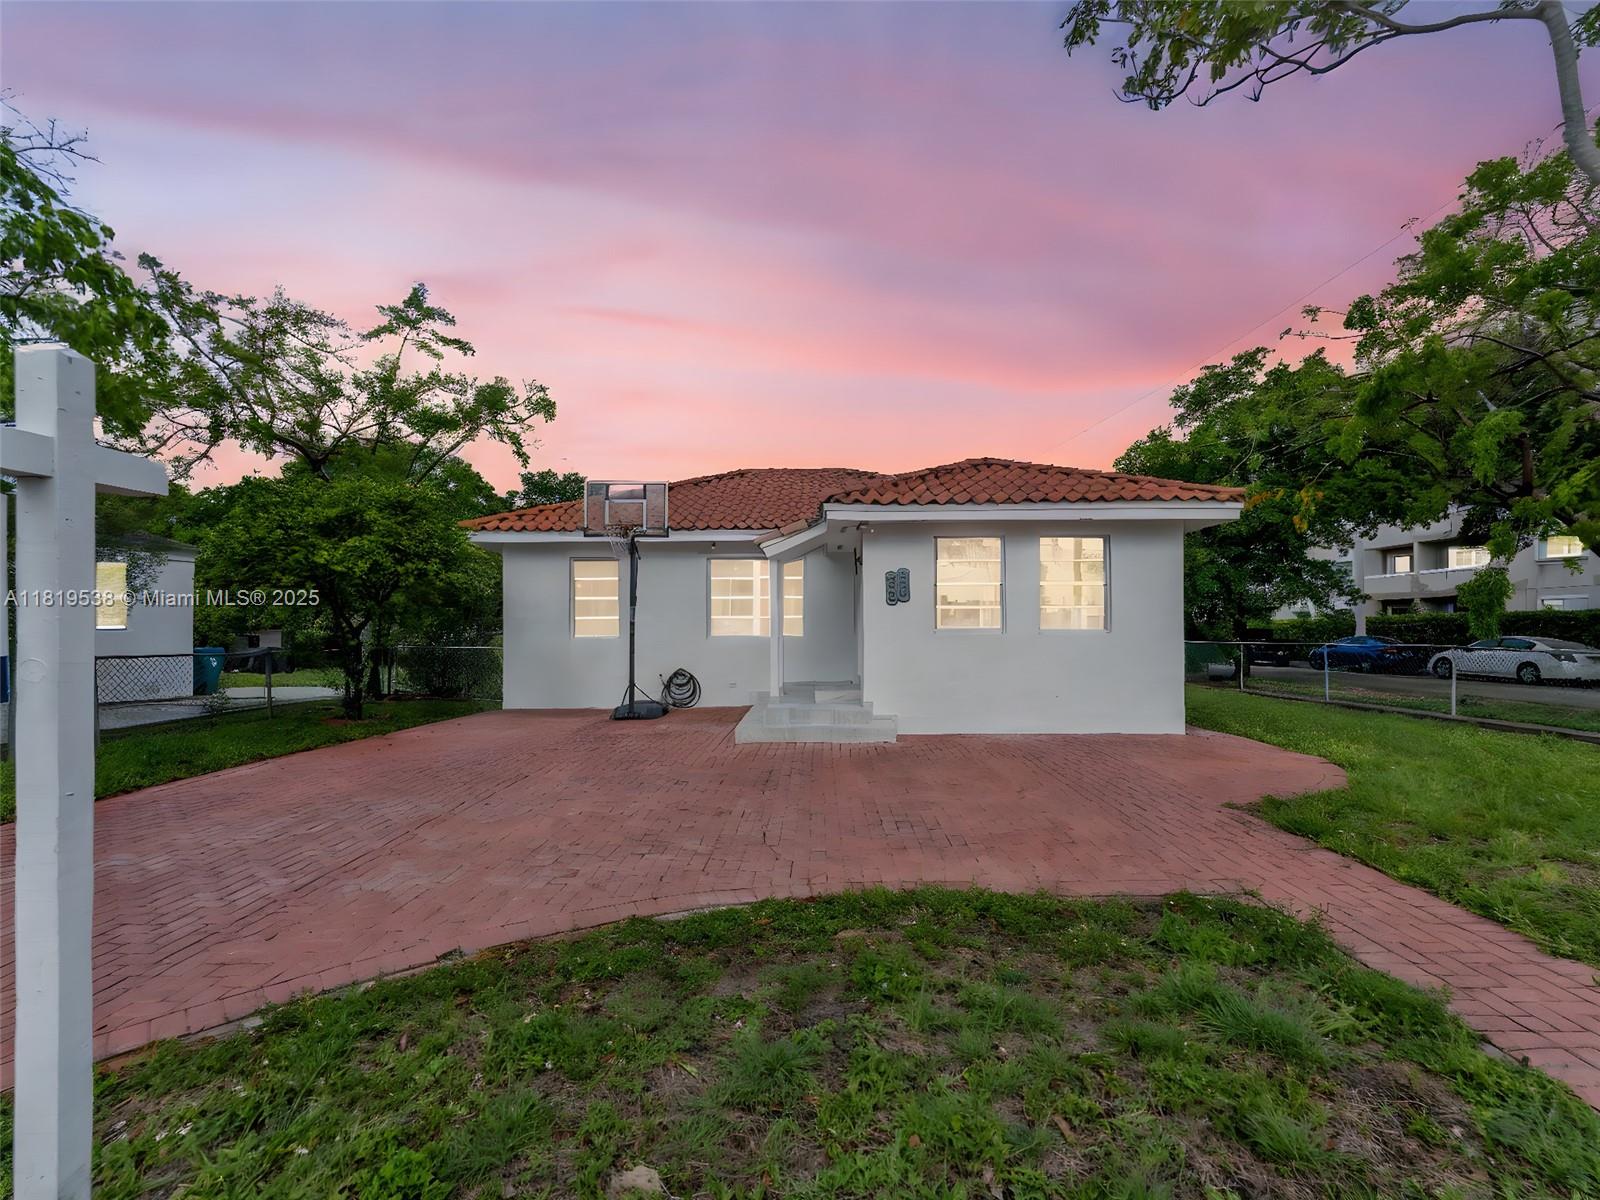
Active under contract
$749,995
4
bds
|
3
ba
|
1,517
sqft
|
built
1947
5310 SW 2nd St, Coral Gables, FL 33134
$-1,846
Cash flow
-12.8%
Cash-on-Cash Return
3.3%
Cap rate
0.5%
Rent to Value Ratio
Active
$865,000
4
bds
|
2
ba
|
1,523
sqft
|
built
1969
8540 NW 182nd St, Hialeah, FL 33015
$-2,144
Cash flow
-12.9%
Cash-on-Cash Return
3.3%
Cap rate
0.5%
Rent to Value Ratio
Active
$550,000
3
bds
|
2
ba
|
1,048
sqft
|
built
1950
5901 SW 6th St, Miami, FL 33144
$-643
Cash flow
-6.1%
Cash-on-Cash Return
4.9%
Cap rate
0.7%
Rent to Value Ratio

Active
$265,000
bds
|
1
ba
|
560
sqft
|
built
1966
800 West Ave, Miami Beach, FL 33139
$-870
Cash flow
-17.1%
Cash-on-Cash Return
2.3%
Cap rate
0.8%
Rent to Value Ratio
Active
$1,400,000
bds
|
1
ba
|
490
sqft
|
built
2009
2201 Collins Ave, Miami Beach, FL 33139
$-8,083
Cash flow
-30.1%
Cash-on-Cash Return
-0.6%
Cap rate
0.3%
Rent to Value Ratio
Active
$2,050,000
4
bds
|
3
ba
|
1,989
sqft
|
built
1936
659 NE 73rd St, Miami, FL 33138
$-6,239
Cash flow
-15.9%
Cash-on-Cash Return
2.6%
Cap rate
0.5%
Rent to Value Ratio
Active
$299,000
2
bds
|
2
ba
|
1,190
sqft
|
built
1974
16508 NE 26th Ave, North Miami Beach, FL 33160
$-1,072
Cash flow
-18.7%
Cash-on-Cash Return
2.0%
Cap rate
0.9%
Rent to Value Ratio
Active
$159,000
1
bds
|
1
ba
|
668
sqft
|
built
1964
1500 NE 127th St, North Miami, FL 33161
$-448
Cash flow
-14.7%
Cash-on-Cash Return
2.9%
Cap rate
1.1%
Rent to Value Ratio
Active
$550,000
3
bds
|
1
ba
|
0
sqft
|
built
1970
3354 NW 181st St, Miami Gardens, FL 33056
$-1,399
Cash flow
-13.3%
Cash-on-Cash Return
3.2%
Cap rate
0.6%
Rent to Value Ratio
Active
$320,000
1
bds
|
1
ba
|
741
sqft
|
built
1963
7904 West Dr, North Bay Village, FL 33141
$-1,190
Cash flow
-19.4%
Cash-on-Cash Return
1.8%
Cap rate
0.7%
Rent to Value Ratio
Active
$990,000
3
bds
|
2
ba
|
1,416
sqft
|
built
1948
1545 Normandy Dr, Miami Beach, FL 33141
$-2,435
Cash flow
-12.8%
Cash-on-Cash Return
3.3%
Cap rate
0.6%
Rent to Value Ratio
Active
$310,000
3
bds
|
2
ba
|
1,151
sqft
|
built
2016
134 SE 28th Ter, Homestead, FL 33033
$-1,010
Cash flow
-17.0%
Cash-on-Cash Return
2.4%
Cap rate
0.7%
Rent to Value Ratio
Active
$1,899,000
3
bds
|
3
ba
|
2,430
sqft
|
built
1993
16445 Collins Ave, Sunny Isles Beach, FL 33160
$-6,177
Cash flow
-17.0%
Cash-on-Cash Return
2.4%
Cap rate
0.5%
Rent to Value Ratio