Miami Dade County Investment Properties for Sale
Browse homes for sale and investment properties in Miami Dade County. Refine your search by price, property type, or more.
Best cash flowing properties in Miami Dade County

Active
$150,000
bds
|
1
ba
|
406
sqft
|
built
1948
8132 Harding Ave, Miami Beach, FL 33141
$178
Cash flow
6.2%
Cash-on-Cash Return
7.6%
Cap rate
1.3%
Rent to Value Ratio

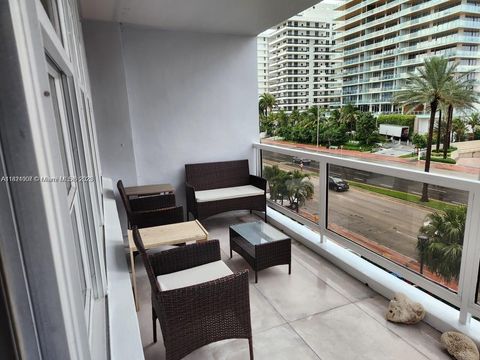
Active
$315,000
3
bds
|
3
ba
|
1,799
sqft
|
built
2007
656 SW 11th St, Florida City, FL 33034
$-11
Cash flow
-0.2%
Cash-on-Cash Return
6.1%
Cap rate
0.9%
Rent to Value Ratio
10,000 out of 11,974 properties for sale in Miami Dade County
Limited Results Shown
Create a free account, or log in to reveal all property listings and enjoy the complete experience.

Active
$360,000
2
bds
|
2
ba
|
1,138
sqft
|
built
1975
20301 W Country Club Dr, Aventura, FL 33180
$-1,110
Cash flow
-16.1%
Cash-on-Cash Return
2.4%
Cap rate
0.8%
Rent to Value Ratio
Active
$649,900
2
bds
|
2
ba
|
1,560
sqft
|
built
1995
2000 Island Blvd, Aventura, FL 33160
$-2,115
Cash flow
-17.0%
Cash-on-Cash Return
2.2%
Cap rate
0.9%
Rent to Value Ratio

Active
$1,200,000
3
bds
|
2
ba
|
1,583
sqft
|
built
1925
50 NW 34th Ter, Miami, FL 33127
$-4,655
Cash flow
-20.2%
Cash-on-Cash Return
1.5%
Cap rate
0.2%
Rent to Value Ratio

Active
$500,000
1
bds
|
1
ba
|
675
sqft
|
built
2016
1600 SW 1st Ave, Miami, FL 33129
$-1,400
Cash flow
-14.6%
Cash-on-Cash Return
2.8%
Cap rate
0.8%
Rent to Value Ratio

Active
$2,230,000
3
bds
|
4
ba
|
3,082
sqft
|
built
2007
3301 NE 183rd St, Aventura, FL 33160
$-8,895
Cash flow
-20.8%
Cash-on-Cash Return
1.4%
Cap rate
0.5%
Rent to Value Ratio
Active
$600,000
5
bds
|
3
ba
|
2,914
sqft
|
built
2006
10846 SW 242nd St, Homestead, FL 33032
$-1,381
Cash flow
-12.0%
Cash-on-Cash Return
3.4%
Cap rate
0.6%
Rent to Value Ratio

Active
$2,995,000
3
bds
|
4
ba
|
1,933
sqft
|
built
2009
17121 Collins Ave, Sunny Isles Beach, FL 33160
$-13,911
Cash flow
-24.2%
Cash-on-Cash Return
0.6%
Cap rate
0.3%
Rent to Value Ratio

Active
$1,855,000
4
bds
|
3
ba
|
1,756
sqft
|
built
1939
842 NW 9th Ct, Miami, FL 33136
$-5,424
Cash flow
-15.3%
Cash-on-Cash Return
2.6%
Cap rate
0.4%
Rent to Value Ratio
Active
$689,000
6
bds
|
4
ba
|
1,980
sqft
|
built
1957
801 NW 172nd Ter, Miami Gardens, FL 33169
$-1,757
Cash flow
-13.3%
Cash-on-Cash Return
3.1%
Cap rate
0.6%
Rent to Value Ratio
Active
$505,000
3
bds
|
3
ba
|
1,376
sqft
|
built
2021
3348 W 108th St, Hialeah, FL 33018
$-1,520
Cash flow
-15.7%
Cash-on-Cash Return
2.5%
Cap rate
0.6%
Rent to Value Ratio

Active
$450,000
4
bds
|
2
ba
|
1,491
sqft
|
built
2004
13557 SW 287th Ln, Homestead, FL 33033
$-586
Cash flow
-6.8%
Cash-on-Cash Return
4.6%
Cap rate
0.6%
Rent to Value Ratio

Active
$10,500,000
5
bds
|
6
ba
|
4,542
sqft
|
built
2017
450 W 62nd St, Miami Beach, FL 33140
$-57,745
Cash flow
-28.7%
Cash-on-Cash Return
-0.5%
Cap rate
0.1%
Rent to Value Ratio

Active
$660,000
3
bds
|
2
ba
|
1,740
sqft
|
built
1997
14262 SW 160th Ter, Miami, FL 33177
$-1,222
Cash flow
-9.7%
Cash-on-Cash Return
3.9%
Cap rate
0.5%
Rent to Value Ratio
Active
$415,000
2
bds
|
2
ba
|
1,070
sqft
|
built
1968
5700 Collins Ave, Miami Beach, FL 33140
$-1,875
Cash flow
-23.6%
Cash-on-Cash Return
0.7%
Cap rate
0.7%
Rent to Value Ratio

Active
$525,000
4
bds
|
3
ba
|
1,828
sqft
|
built
1958
19525 NW 38th Ct, Miami Gardens, FL 33055
$-455
Cash flow
-4.5%
Cash-on-Cash Return
5.1%
Cap rate
0.7%
Rent to Value Ratio

Active
$339,000
2
bds
|
2
ba
|
1,171
sqft
|
built
1994
470 SE 21st Ln, Homestead, FL 33033
$-788
Cash flow
-12.1%
Cash-on-Cash Return
3.4%
Cap rate
0.8%
Rent to Value Ratio

Active
$419,550
1
bds
|
1
ba
|
662
sqft
|
built
1970
345 Ocean Dr, Miami Beach, FL 33139
$-1,584
Cash flow
-19.7%
Cash-on-Cash Return
1.6%
Cap rate
0.7%
Rent to Value Ratio

Active
$694,900
5
bds
|
3
ba
|
1,640
sqft
|
built
1976
16221 SW 283rd St, Homestead, FL 33033
$-2,063
Cash flow
-15.5%
Cash-on-Cash Return
2.6%
Cap rate
0.4%
Rent to Value Ratio
Active
$850,000
3
bds
|
2
ba
|
1,794
sqft
|
built
1956
1100 NE 182nd St, North Miami Beach, FL 33162
$-2,077
Cash flow
-12.7%
Cash-on-Cash Return
3.2%
Cap rate
0.4%
Rent to Value Ratio

Active
$389,000
2
bds
|
2
ba
|
1,144
sqft
|
built
1980
3731 N Country Club Dr, Aventura, FL 33180
$-1,152
Cash flow
-15.5%
Cash-on-Cash Return
2.6%
Cap rate
0.8%
Rent to Value Ratio

Active
$3,995,000
6
bds
|
5
ba
|
5,894
sqft
|
built
2017
10620 SW 74th Ave, Pinecrest, FL 33156
$-17,459
Cash flow
-22.8%
Cash-on-Cash Return
0.9%
Cap rate
0.3%
Rent to Value Ratio

Active
$265,000
2
bds
|
2
ba
|
1,025
sqft
|
built
1971
3660 NE 166th St, North Miami Beach, FL 33160
$-941
Cash flow
-18.5%
Cash-on-Cash Return
1.9%
Cap rate
0.9%
Rent to Value Ratio

Active
$1,049,000
3
bds
|
2
ba
|
2,246
sqft
|
built
2001
21025 NE 31st Ave, Aventura, FL 33180
$-1,982
Cash flow
-9.9%
Cash-on-Cash Return
3.9%
Cap rate
0.7%
Rent to Value Ratio
Active
$1,694,500
4
bds
|
4
ba
|
2,856
sqft
|
built
1959
11530 NE 7th Ave, Biscayne Park, FL 33161
$-3,051
Cash flow
-9.4%
Cash-on-Cash Return
4.0%
Cap rate
0.5%
Rent to Value Ratio
Active
$265,000
1
bds
|
1
ba
|
741
sqft
|
built
1959
7921 East Dr, North Bay Village, FL 33141
$-774
Cash flow
-15.2%
Cash-on-Cash Return
2.6%
Cap rate
0.8%
Rent to Value Ratio
Active
$1,195,000
2
bds
|
2
ba
|
1,273
sqft
|
built
1940
1409 Medina Ave, Coral Gables, FL 33134
$-4,382
Cash flow
-19.1%
Cash-on-Cash Return
1.7%
Cap rate
0.3%
Rent to Value Ratio

Active
$215,000
2
bds
|
2
ba
|
895
sqft
|
built
2006
15422 SW 284th St, Homestead, FL 33033
$-325
Cash flow
-7.9%
Cash-on-Cash Return
4.3%
Cap rate
1.0%
Rent to Value Ratio
Active
$675,000
6
bds
|
5
ba
|
3,678
sqft
|
built
2005
27681 SW 139th Pl, Homestead, FL 33032
$-1,127
Cash flow
-8.7%
Cash-on-Cash Return
4.1%
Cap rate
0.7%
Rent to Value Ratio

Active
$669,000
3
bds
|
2
ba
|
1,834
sqft
|
built
1952
8301 SW 38th St, Miami, FL 33155
$-1,774
Cash flow
-13.8%
Cash-on-Cash Return
3.0%
Cap rate
0.5%
Rent to Value Ratio

Active
$599,999
3
bds
|
2
ba
|
1,452
sqft
|
built
1953
1395 NE 178th St, North Miami Beach, FL 33162
$-1,447
Cash flow
-12.6%
Cash-on-Cash Return
3.3%
Cap rate
0.6%
Rent to Value Ratio

Active
$540,000
4
bds
|
2
ba
|
1,334
sqft
|
built
1975
15724 SW 304th Ter, Homestead, FL 33033
$-1,178
Cash flow
-11.4%
Cash-on-Cash Return
3.5%
Cap rate
0.5%
Rent to Value Ratio
Active
$725,000
2
bds
|
1
ba
|
896
sqft
|
built
1924
3422 SW 25th St, Miami, FL 33133
$-1,703
Cash flow
-12.3%
Cash-on-Cash Return
3.3%
Cap rate
0.5%
Rent to Value Ratio

Active
$655,999
3
bds
|
2
ba
|
1,668
sqft
|
built
1980
1030 NE 202nd Ter, Miami, FL 33179
$-1,597
Cash flow
-12.7%
Cash-on-Cash Return
3.2%
Cap rate
0.6%
Rent to Value Ratio

Active
$280,000
1
bds
|
1
ba
|
675
sqft
|
built
1977
701 Euclid Ave, Miami Beach, FL 33139
$-930
Cash flow
-17.3%
Cash-on-Cash Return
2.2%
Cap rate
0.8%
Rent to Value Ratio

Active
$748,500
5
bds
|
3
ba
|
1,592
sqft
|
built
1972
10371 SW 146th St, Miami, FL 33176
$-1,985
Cash flow
-13.8%
Cash-on-Cash Return
3.0%
Cap rate
0.4%
Rent to Value Ratio

Active
$6,500,000
4
bds
|
5
ba
|
4,331
sqft
|
built
2005
6000 Island Blvd, Aventura, FL 33160
$-36,686
Cash flow
-29.4%
Cash-on-Cash Return
-0.6%
Cap rate
0.1%
Rent to Value Ratio

Active
$459,000
2
bds
|
2
ba
|
1,811
sqft
|
built
1982
11113 Biscayne Blvd, Miami, FL 33181
$-1,524
Cash flow
-17.3%
Cash-on-Cash Return
2.2%
Cap rate
0.8%
Rent to Value Ratio
Active
$515,000
1
bds
|
1
ba
|
702
sqft
|
built
2008
951 Brickell Ave, Miami, FL 33131
$-1,039
Cash flow
-10.5%
Cash-on-Cash Return
3.7%
Cap rate
0.6%
Rent to Value Ratio