Miami Dade County Investment Properties for Sale
Browse homes for sale and investment properties in Miami Dade County. Refine your search by price, property type, or more.
Best cash flowing properties in Miami Dade County
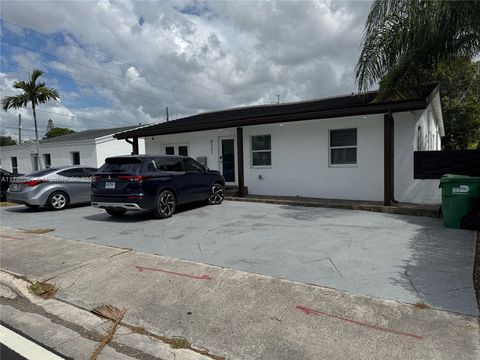
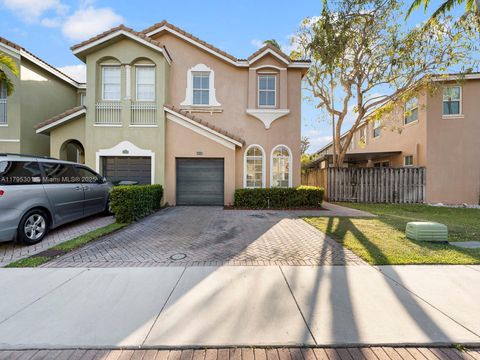
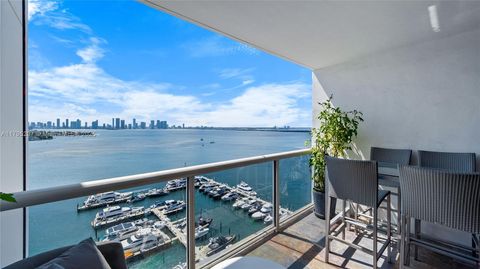
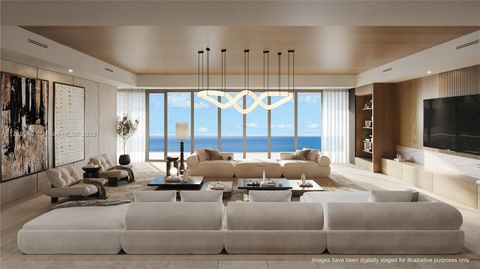
Active
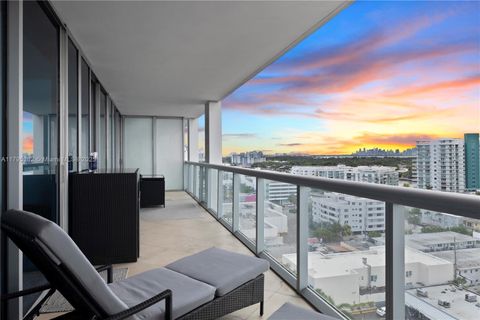
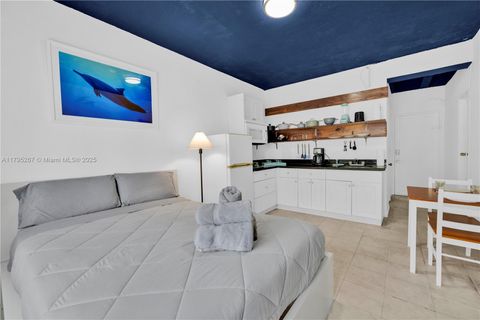
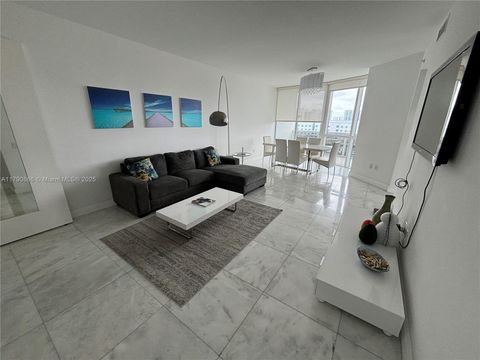
$850,000
2
bds
|
2
ba
|
1,035
sqft
|
built
2008
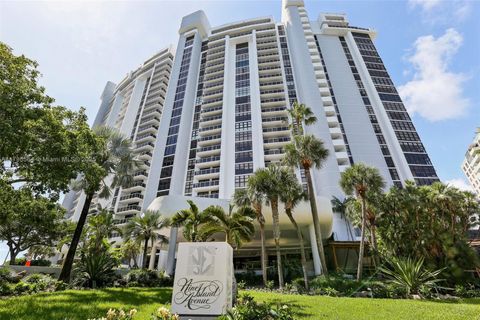
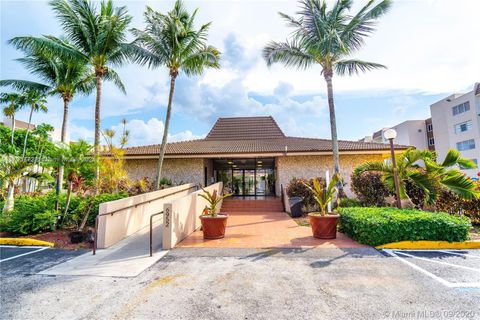
6799 Collins Ave, Miami Beach, FL 33141
$36
Cash flow
0.2%
Cash-on-Cash Return
6.2%
Cap rate
0.9%
Rent to Value Ratio
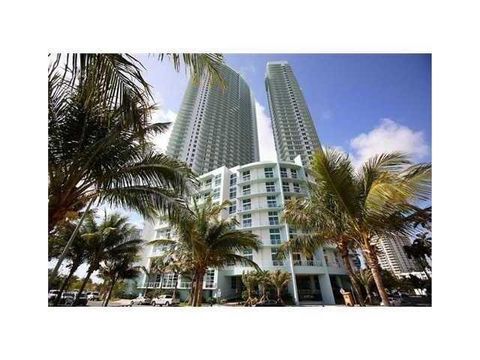
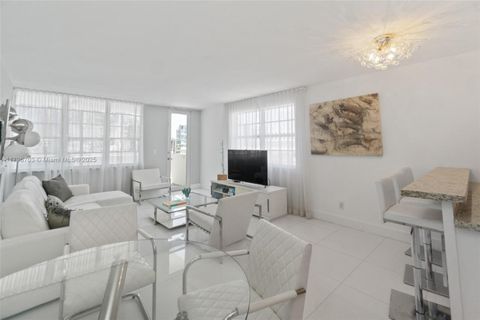
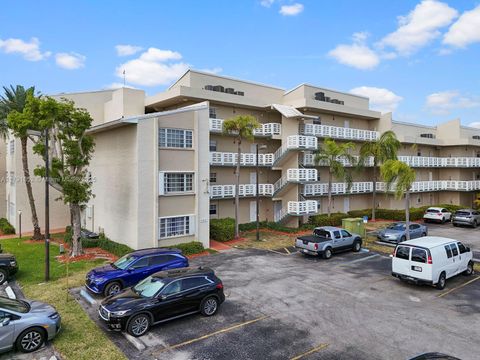
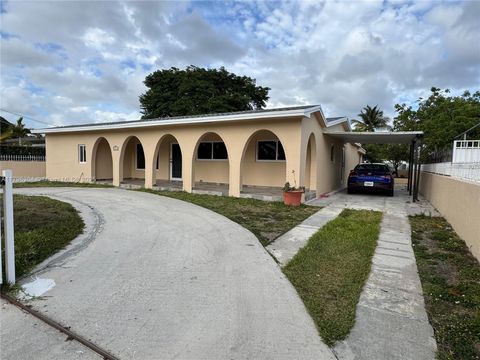
Active
$550,000
2
bds
|
2
ba
|
1,104
sqft
|
built
2008
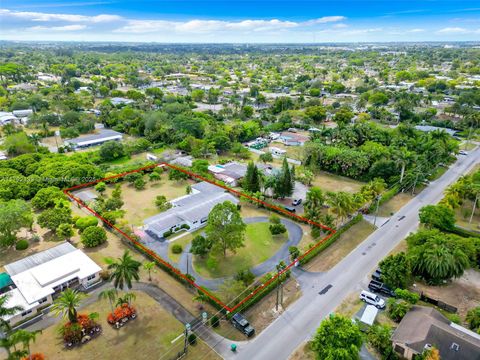
1900 N Bayshore Dr, Miami, FL 33132
$0
Cash flow
n/a
Cash-on-Cash Return
n/a
Cap rate
n/a
Rent to Value Ratio
10,000 out of 12,342 properties for sale in Miami Dade County
Limited Results Shown
Create a free account, or log in to reveal all property listings and enjoy the complete experience.
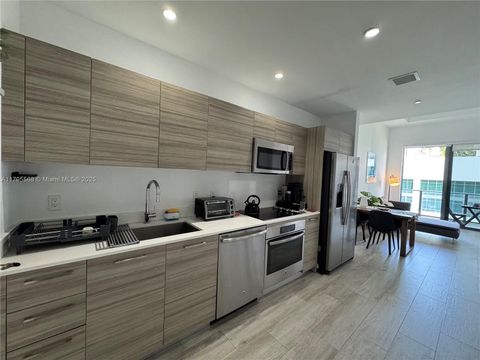
Active
$445,000
1
bds
|
1
ba
|
607
sqft
|
built
2018
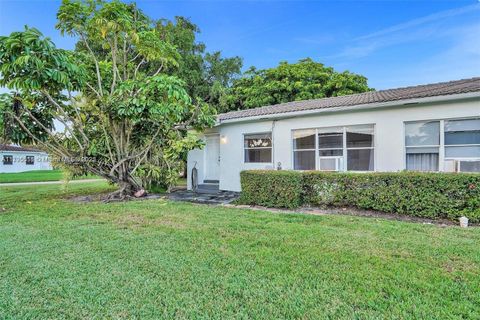
121 NE 34th St, Miami, FL 33137
$-1,750
Cash flow
-20.5%
Cash-on-Cash Return
1.4%
Cap rate
0.7%
Rent to Value Ratio
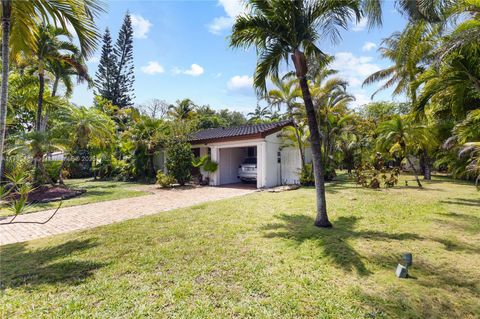
Active
$1,350,000
3
bds
|
2
ba
|
1,150
sqft
|
built
1954
5644 SW 69th Ave, Miami, FL 33143
$-4,486
Cash flow
-17.3%
Cash-on-Cash Return
2.2%
Cap rate
0.3%
Rent to Value Ratio
Active
$830,000
4
bds
|
3
ba
|
1,830
sqft
|
built
1949
6121 Coral Way, Miami, FL 33155
$-2,791
Cash flow
-17.5%
Cash-on-Cash Return
2.1%
Cap rate
0.3%
Rent to Value Ratio
Active
$849,000
2
bds
|
2
ba
|
1,190
sqft
|
built
1965
100 Lincoln Rd, Miami Beach, FL 33139
$-1,851
Cash flow
-11.4%
Cash-on-Cash Return
3.5%
Cap rate
0.5%
Rent to Value Ratio
Active
$4,995,000
6
bds
|
7
ba
|
3,646
sqft
|
built
2013
689 Glenridge Rd, Key Biscayne, FL 33149
$-21,850
Cash flow
-22.8%
Cash-on-Cash Return
0.9%
Cap rate
0.2%
Rent to Value Ratio
Active
$1,190,000
3
bds
|
4
ba
|
2,950
sqft
|
built
1970
5660 Collins Ave, Miami Beach, FL 33140
$-4,995
Cash flow
-21.9%
Cash-on-Cash Return
1.1%
Cap rate
0.7%
Rent to Value Ratio
Active
$1,199,000
3
bds
|
3
ba
|
1,154
sqft
|
built
2016
1300 S Miami Ave, Miami, FL 33130
$-4,410
Cash flow
-19.2%
Cash-on-Cash Return
1.7%
Cap rate
0.6%
Rent to Value Ratio
Active
$262,876
2
bds
|
2
ba
|
777
sqft
|
built
1968
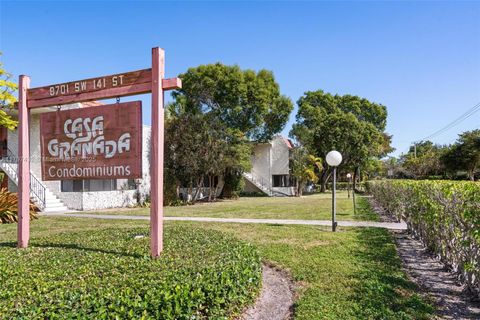
8701 SW 141st St, Palmetto Bay, FL 33176
$-696
Cash flow
-13.8%
Cash-on-Cash Return
3.0%
Cap rate
0.8%
Rent to Value Ratio
Active
$1,349,000
1
bds
|
1
ba
|
1,066
sqft
|
built
2005
4401 Collins Ave, Miami Beach, FL 33140
$-5,630
Cash flow
-21.8%
Cash-on-Cash Return
1.1%
Cap rate
0.5%
Rent to Value Ratio
Active
$330,000
2
bds
|
3
ba
|
970
sqft
|
built
1984
8430 NW 8th St, Miami, FL 33126
$-764
Cash flow
-12.1%
Cash-on-Cash Return
3.4%
Cap rate
0.7%
Rent to Value Ratio
Active
$1,349,000
3
bds
|
2
ba
|
1,477
sqft
|
built
1981
9 Island Ave, Miami Beach, FL 33139
$-5,296
Cash flow
-20.5%
Cash-on-Cash Return
1.4%
Cap rate
0.5%
Rent to Value Ratio
Active
$495,000
3
bds
|
2
ba
|
1,114
sqft
|
built
1952
4241 W 1st Ave, Hialeah, FL 33012
$-1,082
Cash flow
-11.4%
Cash-on-Cash Return
3.5%
Cap rate
0.6%
Rent to Value Ratio
Active
$399,000
2
bds
|
2
ba
|
1,271
sqft
|
built
1990
3300 NE 191st St, Aventura, FL 33180
$-1,335
Cash flow
-17.5%
Cash-on-Cash Return
2.1%
Cap rate
0.8%
Rent to Value Ratio
Active
$1,390,000
2
bds
|
2
ba
|
1,577
sqft
|
built
2008
18201 Collins Ave, Sunny Isles Beach, FL 33160
$-7,273
Cash flow
-27.3%
Cash-on-Cash Return
-0.1%
Cap rate
0.4%
Rent to Value Ratio
Active
$209,000
1
bds
|
1
ba
|
870
sqft
|
built
1974
6950 NW 186th St, Hialeah, FL 33015
$-510
Cash flow
-12.7%
Cash-on-Cash Return
3.2%
Cap rate
1.0%
Rent to Value Ratio
Active
$999,000
3
bds
|
3
ba
|
2,809
sqft
|
built
1976
29425 SW 182nd Ave, Homestead, FL 33030
$-2,140
Cash flow
-11.2%
Cash-on-Cash Return
3.6%
Cap rate
0.5%
Rent to Value Ratio
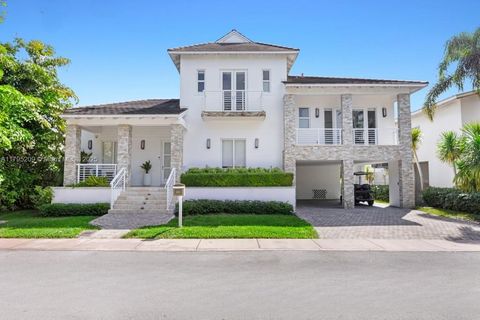
Active
$1,650,000
3
bds
|
3
ba
|
1,762
sqft
|
built
2004
2101 Brickell Ave, Miami, FL 33129
$-5,762
Cash flow
-18.2%
Cash-on-Cash Return
2.0%
Cap rate
0.5%
Rent to Value Ratio
Active
$1,095,000
2
bds
|
0
ba
|
1,773
sqft
|
built
1949
950 NE 113th St, Biscayne Park, FL 33161
$-5,386
Cash flow
-25.7%
Cash-on-Cash Return
0.2%
Cap rate
0.2%
Rent to Value Ratio
Active
$369,900
4
bds
|
3
ba
|
1,965
sqft
|
built
2007
1416 SE 26th Ave, Homestead, FL 33035
$-784
Cash flow
-11.1%
Cash-on-Cash Return
3.6%
Cap rate
0.8%
Rent to Value Ratio
Active
$625,000
3
bds
|
2
ba
|
2,017
sqft
|
built
1952
3518 NW 11th Ave, Miami, FL 33127
$-1,374
Cash flow
-11.5%
Cash-on-Cash Return
3.5%
Cap rate
0.6%
Rent to Value Ratio
Active
$565,000
3
bds
|
3
ba
|
1,704
sqft
|
built
2003
3150 SW 152nd Pl, Miami, FL 33185
$-1,384
Cash flow
-12.8%
Cash-on-Cash Return
3.2%
Cap rate
0.6%
Rent to Value Ratio
Active
$288,000
1
bds
|
1
ba
|
651
sqft
|
built
1973
860 NE 78th St, Miami, FL 33138
$-454
Cash flow
-8.2%
Cash-on-Cash Return
4.3%
Cap rate
0.8%
Rent to Value Ratio
Active
$2,475,000
3
bds
|
2
ba
|
1,550
sqft
|
built
1997
1900 Purdy Ave, Miami Beach, FL 33139
$-10,245
Cash flow
-21.6%
Cash-on-Cash Return
1.2%
Cap rate
0.4%
Rent to Value Ratio
Active
$510,000
4
bds
|
2
ba
|
1,368
sqft
|
built
1939
1218 NW 41st St, Miami, FL 33142
$-933
Cash flow
-9.5%
Cash-on-Cash Return
4.0%
Cap rate
0.6%
Rent to Value Ratio
Active
$1,849,000
2
bds
|
3
ba
|
2,106
sqft
|
built
2008
16001 Collins Ave, Sunny Isles Beach, FL 33160
$-7,956
Cash flow
-22.4%
Cash-on-Cash Return
1.0%
Cap rate
0.4%
Rent to Value Ratio

Active
$575,000
4
bds
|
3
ba
|
1,683
sqft
|
built
1948
736 NE 164th St, Miami, FL 33162
$-1,349
Cash flow
-12.2%
Cash-on-Cash Return
3.3%
Cap rate
0.6%
Rent to Value Ratio

Active
$1,799,000
3
bds
|
3
ba
|
1,485
sqft
|
built
1999
125 Jefferson Ave, Miami Beach, FL 33139
$-4,476
Cash flow
-13.0%
Cash-on-Cash Return
3.2%
Cap rate
0.5%
Rent to Value Ratio
Active
$199,000
2
bds
|
2
ba
|
1,050
sqft
|
built
1973
13499 Biscayne Blvd, North Miami, FL 33181
$-1,001
Cash flow
-26.2%
Cash-on-Cash Return
0.1%
Cap rate
1.1%
Rent to Value Ratio
Active
$185,000
bds
|
1
ba
|
260
sqft
|
built
1941
255 W 24th St, Miami Beach, FL 33140
$-641
Cash flow
-18.1%
Cash-on-Cash Return
2.0%
Cap rate
1.0%
Rent to Value Ratio
Active
$281,000
2
bds
|
2
ba
|
1,192
sqft
|
built
1975
21121 SW 85th Ave, Cutler Bay, FL 33189
$-565
Cash flow
-10.5%
Cash-on-Cash Return
3.7%
Cap rate
0.8%
Rent to Value Ratio
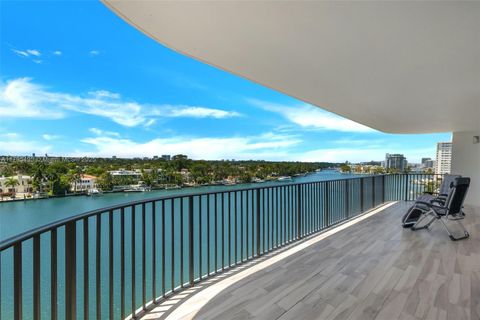
Active
$3,450,000
2
bds
|
3
ba
|
2,163
sqft
|
built
2004
6365 Collins Ave, Miami Beach, FL 33141
$-17,102
Cash flow
-25.9%
Cash-on-Cash Return
0.2%
Cap rate
0.2%
Rent to Value Ratio
Active
$945,000
2
bds
|
3
ba
|
2,360
sqft
|
built
1982
19500 Turnberry Way, Aventura, FL 33180
$-3,476
Cash flow
-19.2%
Cash-on-Cash Return
1.7%
Cap rate
0.8%
Rent to Value Ratio
Active
$1,299,000
2
bds
|
3
ba
|
1,649
sqft
|
built
2008
18201 Collins Ave, Sunny Isles Beach, FL 33160
$-6,418
Cash flow
-25.8%
Cash-on-Cash Return
0.2%
Cap rate
0.4%
Rent to Value Ratio
Active
$505,000
4
bds
|
3
ba
|
1,483
sqft
|
built
2023
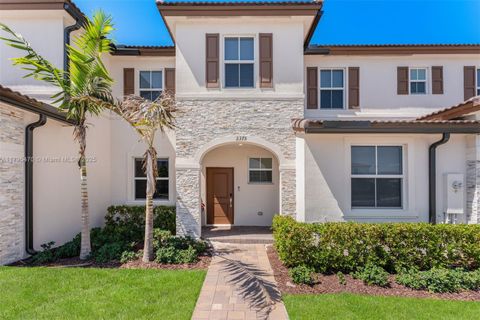
2375 NW 122nd Ter, Miami, FL 33167
$-1,360
Cash flow
-14.1%
Cash-on-Cash Return
2.9%
Cap rate
0.6%
Rent to Value Ratio
Active
$23,500,000
5
bds
|
6
ba
|
7,025
sqft
|
built
2007
7143 Fisher Island Dr, Miami Beach, FL 33109
$-133,344
Cash flow
-29.6%
Cash-on-Cash Return
-0.7%
Cap rate
0.0%
Rent to Value Ratio
Active
$425,000
2
bds
|
2
ba
|
991
sqft
|
built
1986
6268 NW 170th Ter, Hialeah, FL 33015
$-720
Cash flow
-8.8%
Cash-on-Cash Return
4.1%
Cap rate
0.7%
Rent to Value Ratio
Active
$16,995,000
4
bds
|
7
ba
|
6,225
sqft
|
built
2020
18501 Collins Ave, Sunny Isles Beach, FL 33160
$-92,502
Cash flow
-28.4%
Cash-on-Cash Return
-0.4%
Cap rate
0.0%
Rent to Value Ratio
Active
$975,000
7
bds
|
6
ba
|
2,913
sqft
|
built
1959
4701 SW 104th Ct, Miami, FL 33165
$-3,362
Cash flow
-18.0%
Cash-on-Cash Return
2.0%
Cap rate
0.4%
Rent to Value Ratio