Miami Dade County Investment Properties for Sale
Browse homes for sale and investment properties in Miami Dade County. Refine your search by price, property type, or more.
Best cash flowing properties in Miami Dade County
Active
$850,000
2
bds
|
2
ba
|
1,035
sqft
|
built
2008
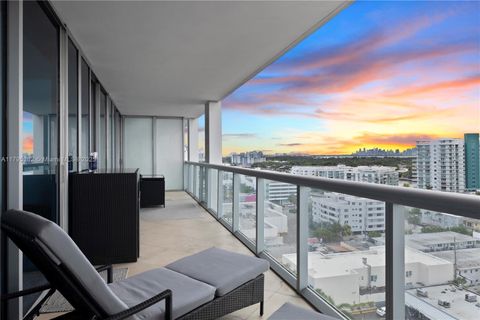
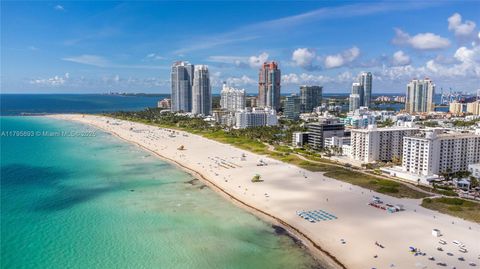
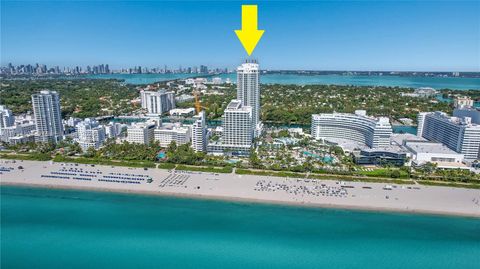
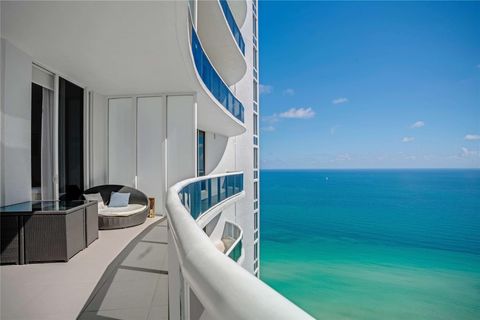
6799 Collins Ave, Miami Beach, FL 33141
$36
Cash flow
0.2%
Cash-on-Cash Return
6.2%
Cap rate
0.9%
Rent to Value Ratio
Active
$200,000
1
bds
|
1
ba
|
725
sqft
|
built
1972
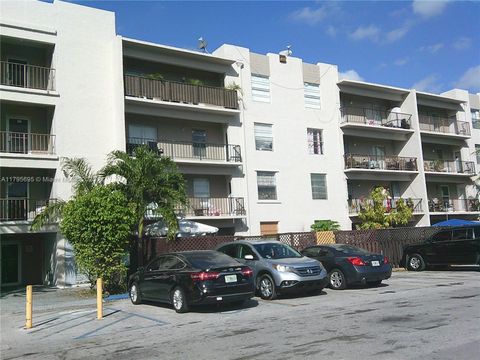
5775 W 20th Ave, Hialeah, FL 33012
$-261
Cash flow
-6.8%
Cash-on-Cash Return
4.6%
Cap rate
0.9%
Rent to Value Ratio
10,000 out of 12,567 properties for sale in Miami Dade County
Limited Results Shown
Create a free account, or log in to reveal all property listings and enjoy the complete experience.
Active
$539,000
1
bds
|
2
ba
|
797
sqft
|
built
1966
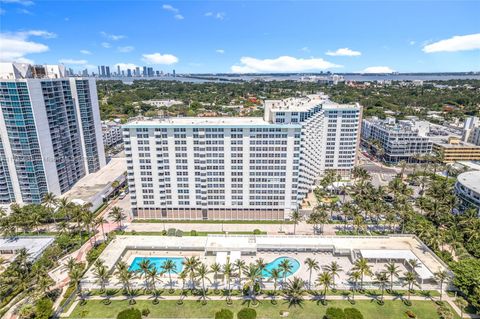
2899 Collins Ave, Miami Beach, FL 33140
$-1,882
Cash flow
-18.2%
Cash-on-Cash Return
2.0%
Cap rate
0.5%
Rent to Value Ratio
Active
$430,000
1
bds
|
1
ba
|
655
sqft
|
built
1970
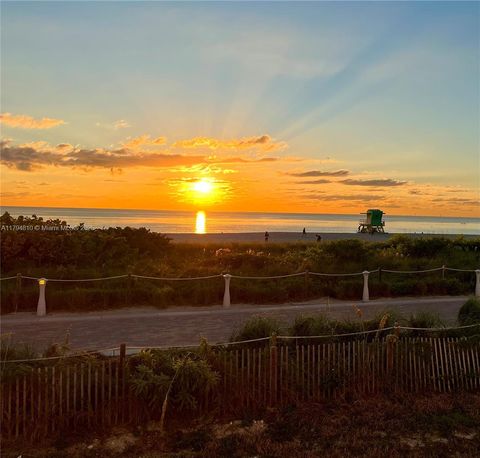
401 Ocean Dr, Miami Beach, FL 33139
$-1,570
Cash flow
-19.0%
Cash-on-Cash Return
1.8%
Cap rate
0.7%
Rent to Value Ratio
Active
$855,000
3
bds
|
2
ba
|
1,654
sqft
|
built
1999
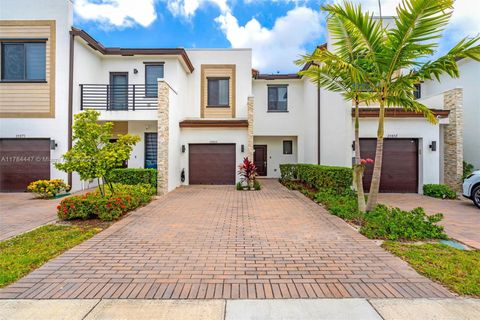
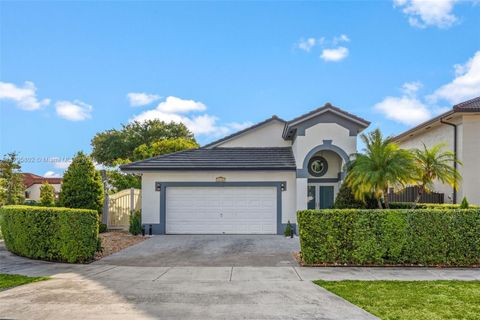
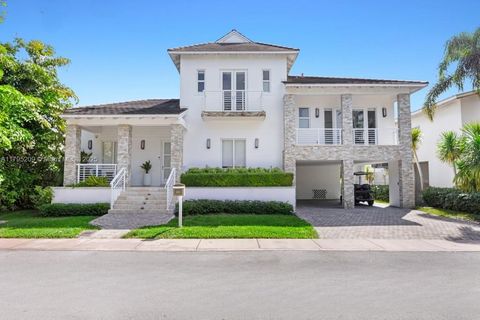
11334 NW 53rd Ln, Doral, FL 33178
$-2,733
Cash flow
-16.7%
Cash-on-Cash Return
2.3%
Cap rate
0.5%
Rent to Value Ratio
Active
$1,650,000
5
bds
|
5
ba
|
3,624
sqft
|
built
2017
10126 NW 76th Ter, Doral, FL 33178
$-4,350
Cash flow
-13.8%
Cash-on-Cash Return
3.0%
Cap rate
0.6%
Rent to Value Ratio
Active
$477,000
2
bds
|
2
ba
|
832
sqft
|
built
1981
1605 Pennsylvania Ave, Miami Beach, FL 33139
$-25,443
Cash flow
-278.3%
Cash-on-Cash Return
-57.9%
Cap rate
0.7%
Rent to Value Ratio
Active
$500,000
2
bds
|
2
ba
|
1,135
sqft
|
built
1937
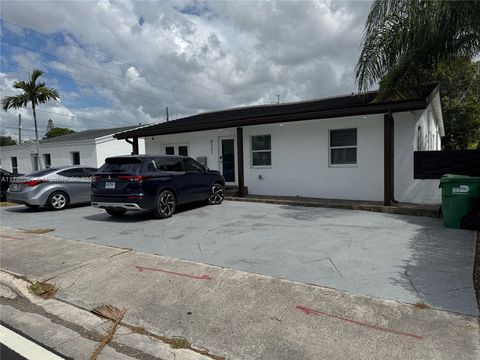
5511 NW 4th Ave, Miami, FL 33127
$-897
Cash flow
-9.4%
Cash-on-Cash Return
4.0%
Cap rate
0.6%
Rent to Value Ratio
Active
$949,000
3
bds
|
3
ba
|
1,378
sqft
|
built
2021
20865 NE 7th Ct, Miami, FL 33179
$-3,599
Cash flow
-19.8%
Cash-on-Cash Return
1.6%
Cap rate
0.4%
Rent to Value Ratio
Active
$1,700,000
2
bds
|
3
ba
|
1,990
sqft
|
built
1991
614 Valencia Ave, Coral Gables, FL 33134
$-6,706
Cash flow
-20.6%
Cash-on-Cash Return
1.4%
Cap rate
0.4%
Rent to Value Ratio
Active
$3,695,000
5
bds
|
5
ba
|
2,629
sqft
|
built
1927
1229 Sorolla Ave, Coral Gables, FL 33134
$-14,511
Cash flow
-20.5%
Cash-on-Cash Return
1.4%
Cap rate
0.2%
Rent to Value Ratio
Active
$1,550,000
2
bds
|
2
ba
|
1,056
sqft
|
built
1964
10275 Collins Ave, Bal Harbour, FL 33154
$-6,735
Cash flow
-22.7%
Cash-on-Cash Return
0.9%
Cap rate
0.4%
Rent to Value Ratio
Active
$399,000
1
bds
|
1
ba
|
662
sqft
|
built
1970
345 Ocean Dr, Miami Beach, FL 33139
$-1,299
Cash flow
-17.0%
Cash-on-Cash Return
2.2%
Cap rate
0.8%
Rent to Value Ratio
Active
$790,000
3
bds
|
2
ba
|
1,678
sqft
|
built
1996
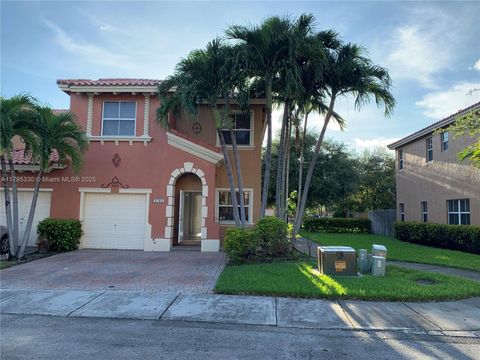
14162 NW 87th Ct, Miami Lakes, FL 33018
$-1,796
Cash flow
-11.9%
Cash-on-Cash Return
3.4%
Cap rate
0.5%
Rent to Value Ratio
Active
$540,000
2
bds
|
2
ba
|
1,560
sqft
|
built
1984
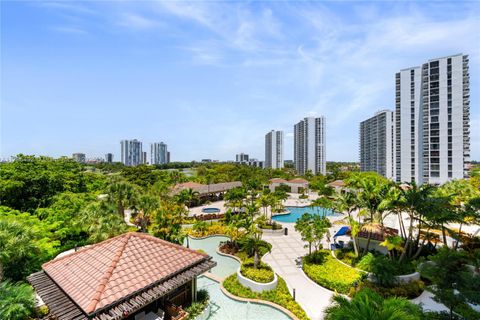
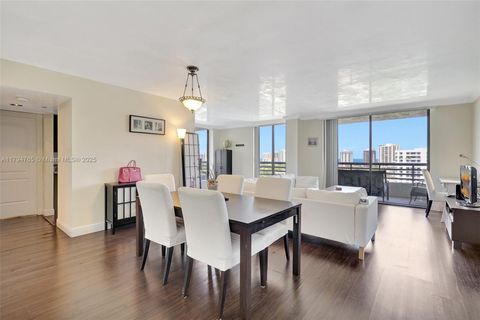
20281 E Country Club Dr, Aventura, FL 33180
$-3,024
Cash flow
-29.2%
Cash-on-Cash Return
-0.6%
Cap rate
0.6%
Rent to Value Ratio
Active
$445,000
1
bds
|
1
ba
|
607
sqft
|
built
2018
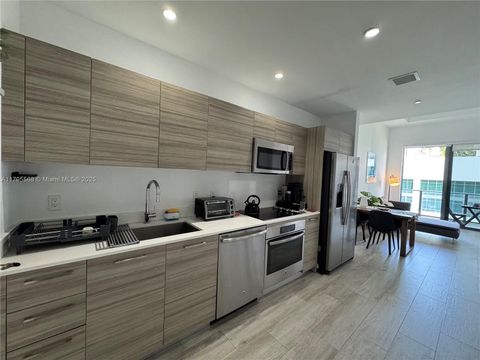
121 NE 34th St, Miami, FL 33137
$-1,750
Cash flow
-20.5%
Cash-on-Cash Return
1.4%
Cap rate
0.7%
Rent to Value Ratio
Active
$1,350,000
3
bds
|
2
ba
|
1,150
sqft
|
built
1954
5644 SW 69th Ave, Miami, FL 33143
$-4,486
Cash flow
-17.3%
Cash-on-Cash Return
2.2%
Cap rate
0.3%
Rent to Value Ratio
Active
$1,199,000
3
bds
|
3
ba
|
1,154
sqft
|
built
2016
1300 S Miami Ave, Miami, FL 33130
$-4,410
Cash flow
-19.2%
Cash-on-Cash Return
1.7%
Cap rate
0.6%
Rent to Value Ratio
Active
$1,349,000
3
bds
|
2
ba
|
1,477
sqft
|
built
1981
9 Island Ave, Miami Beach, FL 33139
$-5,296
Cash flow
-20.5%
Cash-on-Cash Return
1.4%
Cap rate
0.5%
Rent to Value Ratio
Active
$495,000
3
bds
|
2
ba
|
1,114
sqft
|
built
1952
4241 W 1st Ave, Hialeah, FL 33012
$-1,082
Cash flow
-11.4%
Cash-on-Cash Return
3.5%
Cap rate
0.6%
Rent to Value Ratio
Active
$330,000
2
bds
|
3
ba
|
970
sqft
|
built
1984
8430 NW 8th St, Miami, FL 33126
$-764
Cash flow
-12.1%
Cash-on-Cash Return
3.4%
Cap rate
0.7%
Rent to Value Ratio
Active
$1,190,000
3
bds
|
4
ba
|
2,950
sqft
|
built
1970
5660 Collins Ave, Miami Beach, FL 33140
$-4,995
Cash flow
-21.9%
Cash-on-Cash Return
1.1%
Cap rate
0.7%
Rent to Value Ratio
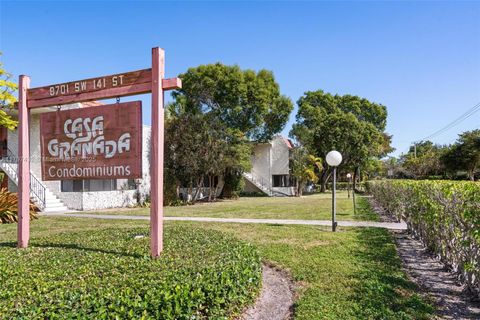
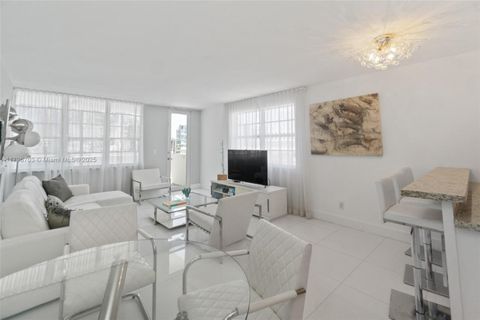
Active
$262,876
2
bds
|
2
ba
|
777
sqft
|
built
1968
8701 SW 141st St, Palmetto Bay, FL 33176
$-696
Cash flow
-13.8%
Cash-on-Cash Return
3.0%
Cap rate
0.8%
Rent to Value Ratio
Active
$849,000
2
bds
|
2
ba
|
1,190
sqft
|
built
1965
100 Lincoln Rd, Miami Beach, FL 33139
$-1,851
Cash flow
-11.4%
Cash-on-Cash Return
3.5%
Cap rate
0.5%
Rent to Value Ratio
Active
$830,000
4
bds
|
3
ba
|
1,830
sqft
|
built
1949
6121 Coral Way, Miami, FL 33155
$-2,791
Cash flow
-17.5%
Cash-on-Cash Return
2.1%
Cap rate
0.3%
Rent to Value Ratio
Active
$1,349,000
1
bds
|
1
ba
|
1,066
sqft
|
built
2005
4401 Collins Ave, Miami Beach, FL 33140
$-5,630
Cash flow
-21.8%
Cash-on-Cash Return
1.1%
Cap rate
0.5%
Rent to Value Ratio
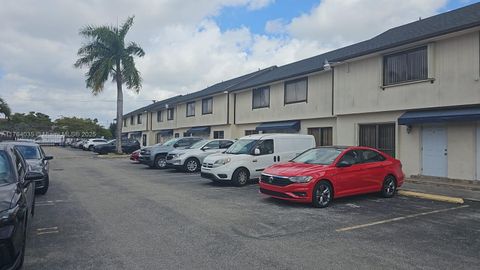
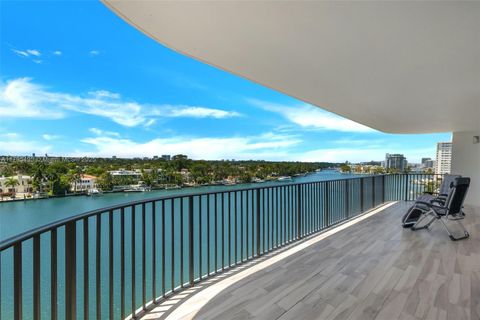
Active
$475,000
1
bds
|
1
ba
|
662
sqft
|
built
2008
6801 Collins Ave, Miami Beach, FL 33141
$-2,502
Cash flow
-27.5%
Cash-on-Cash Return
-0.2%
Cap rate
0.8%
Rent to Value Ratio
Active
$4,995,000
6
bds
|
7
ba
|
3,646
sqft
|
built
2013
689 Glenridge Rd, Key Biscayne, FL 33149
$-21,850
Cash flow
-22.8%
Cash-on-Cash Return
0.9%
Cap rate
0.2%
Rent to Value Ratio
Active
$399,000
2
bds
|
2
ba
|
1,271
sqft
|
built
1990
3300 NE 191st St, Aventura, FL 33180
$-1,335
Cash flow
-17.5%
Cash-on-Cash Return
2.1%
Cap rate
0.8%
Rent to Value Ratio
Active
$369,900
4
bds
|
3
ba
|
1,965
sqft
|
built
2007
1416 SE 26th Ave, Homestead, FL 33035
$-784
Cash flow
-11.1%
Cash-on-Cash Return
3.6%
Cap rate
0.8%
Rent to Value Ratio
Active
$625,000
3
bds
|
2
ba
|
2,017
sqft
|
built
1952
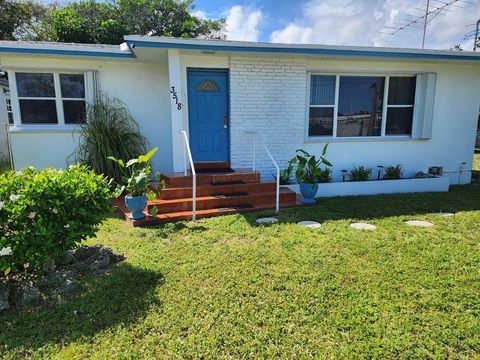
3518 NW 11th Ave, Miami, FL 33127
$-1,374
Cash flow
-11.5%
Cash-on-Cash Return
3.5%
Cap rate
0.6%
Rent to Value Ratio
Active
$565,000
3
bds
|
3
ba
|
1,704
sqft
|
built
2003
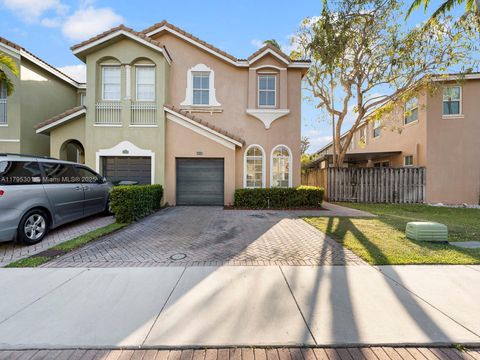
3150 SW 152nd Pl, Miami, FL 33185
$-1,384
Cash flow
-12.8%
Cash-on-Cash Return
3.2%
Cap rate
0.6%
Rent to Value Ratio
Active
$288,000
1
bds
|
1
ba
|
651
sqft
|
built
1973
860 NE 78th St, Miami, FL 33138
$-454
Cash flow
-8.2%
Cash-on-Cash Return
4.3%
Cap rate
0.8%
Rent to Value Ratio
Active
$2,475,000
3
bds
|
2
ba
|
1,550
sqft
|
built
1997
1900 Purdy Ave, Miami Beach, FL 33139
$-10,245
Cash flow
-21.6%
Cash-on-Cash Return
1.2%
Cap rate
0.4%
Rent to Value Ratio
Active
$510,000
4
bds
|
2
ba
|
1,368
sqft
|
built
1939
1218 NW 41st St, Miami, FL 33142
$-933
Cash flow
-9.5%
Cash-on-Cash Return
4.0%
Cap rate
0.6%
Rent to Value Ratio
Active
$710,000
2
bds
|
2
ba
|
887
sqft
|
built
2008
6801 Collins Ave, Miami Beach, FL 33141
$-4,017
Cash flow
-29.5%
Cash-on-Cash Return
-0.6%
Cap rate
0.7%
Rent to Value Ratio
Active
$1,849,000
2
bds
|
3
ba
|
2,106
sqft
|
built
2008
16001 Collins Ave, Sunny Isles Beach, FL 33160
$-7,956
Cash flow
-22.4%
Cash-on-Cash Return
1.0%
Cap rate
0.4%
Rent to Value Ratio
Active
$1,390,000
2
bds
|
2
ba
|
1,577
sqft
|
built
2008
18201 Collins Ave, Sunny Isles Beach, FL 33160
$-7,273
Cash flow
-27.3%
Cash-on-Cash Return
-0.1%
Cap rate
0.4%
Rent to Value Ratio
Active
$209,000
1
bds
|
1
ba
|
870
sqft
|
built
1974
6950 NW 186th St, Hialeah, FL 33015
$-510
Cash flow
-12.7%
Cash-on-Cash Return
3.2%
Cap rate
1.0%
Rent to Value Ratio
Active
$999,000
3
bds
|
3
ba
|
2,809
sqft
|
built
1976
29425 SW 182nd Ave, Homestead, FL 33030
$-2,140
Cash flow
-11.2%
Cash-on-Cash Return
3.6%
Cap rate
0.5%
Rent to Value Ratio