Miami Dade County Investment Properties for Sale
Browse homes for sale and investment properties in Miami Dade County. Refine your search by price, property type, or more.
Best cash flowing properties in Miami Dade County

Active
$399,900
2
bds
|
2
ba
|
1,313
sqft
|
built
1975
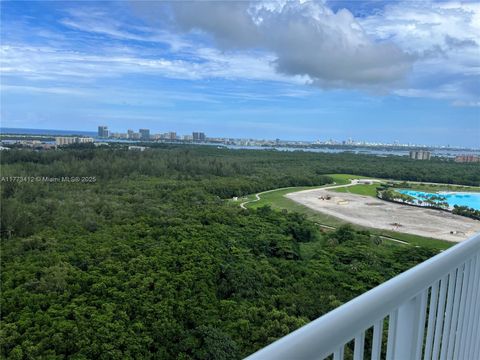
20301 W Country Club Dr, Aventura, FL 33180
$0
Cash flow
n/a
Cash-on-Cash Return
n/a
Cap rate
n/a
Rent to Value Ratio

Active
$324,900
1
bds
|
1
ba
|
747
sqft
|
built
2015
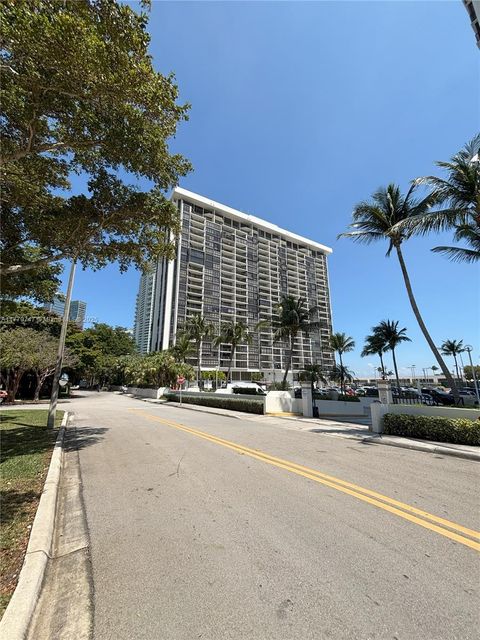
4250 Biscayne Blvd, Miami, FL 33137
$-245
Cash flow
-3.9%
Cash-on-Cash Return
5.2%
Cap rate
0.9%
Rent to Value Ratio
9,916 out of 11,366 properties for sale in Miami Dade County
Limited Results Shown
Create a free account, or log in to reveal all property listings and enjoy the complete experience.
Active
$259,000
2
bds
|
2
ba
|
1,138
sqft
|
built
1975
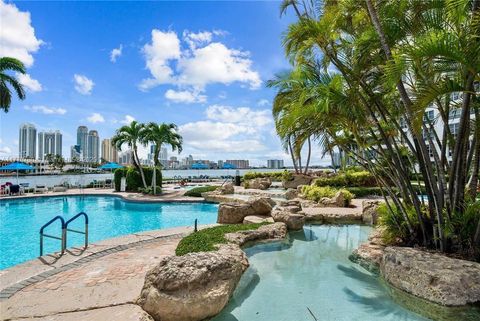
20301 W Country Club Dr, Aventura, FL 33180
$-678
Cash flow
-13.7%
Cash-on-Cash Return
3.0%
Cap rate
1.1%
Rent to Value Ratio
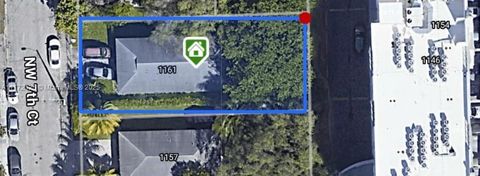
Active
$1,300,000
4
bds
|
2
ba
|
1,326
sqft
|
built
2001
1161 NW 7th Ct, Miami, FL 33136
$-3,903
Cash flow
-15.7%
Cash-on-Cash Return
2.5%
Cap rate
0.3%
Rent to Value Ratio

Active
$748,000
3
bds
|
3
ba
|
1,965
sqft
|
built
2014
838 NE 191st St, Miami, FL 33179
$-2,121
Cash flow
-14.8%
Cash-on-Cash Return
2.7%
Cap rate
0.6%
Rent to Value Ratio

Active
$899,000
4
bds
|
2
ba
|
1,731
sqft
|
built
1964
18321 NE 7th Ct, North Miami Beach, FL 33179
$-1,760
Cash flow
-10.2%
Cash-on-Cash Return
3.8%
Cap rate
0.5%
Rent to Value Ratio
Active
$1,500,000
3
bds
|
2
ba
|
2,234
sqft
|
built
1945
25600 SW 197th Ave, Homestead, FL 33031
$-5,410
Cash flow
-18.8%
Cash-on-Cash Return
1.8%
Cap rate
0.2%
Rent to Value Ratio
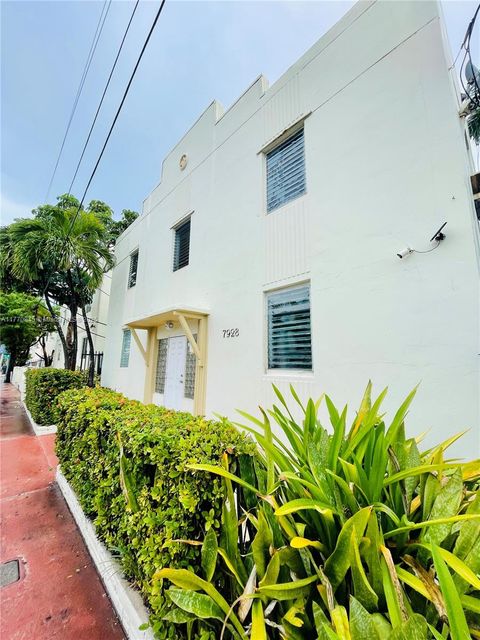
Active
$165,000
bds
|
1
ba
|
394
sqft
|
built
1940
7928 Harding Ave, Miami Beach, FL 33141
$-445
Cash flow
-14.1%
Cash-on-Cash Return
2.9%
Cap rate
0.8%
Rent to Value Ratio

Active
$410,000
1
bds
|
1
ba
|
744
sqft
|
built
1970
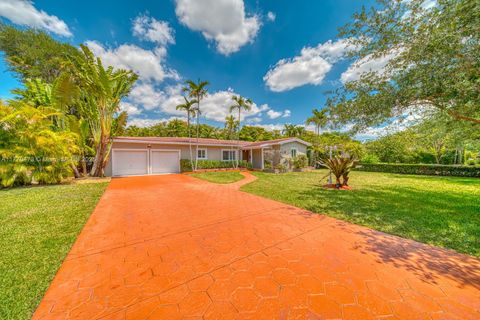
100 Edgewater Dr, Coral Gables, FL 33133
$-1,402
Cash flow
-17.8%
Cash-on-Cash Return
2.0%
Cap rate
0.6%
Rent to Value Ratio
Active
$449,000
3
bds
|
3
ba
|
1,801
sqft
|
built
2007
14951 Royal Oaks Ln, North Miami, FL 33181
$-2,758
Cash flow
-32.0%
Cash-on-Cash Return
-1.2%
Cap rate
0.7%
Rent to Value Ratio

Active
$490,000
3
bds
|
2
ba
|
1,056
sqft
|
built
1946
1431 NE 152nd Ter, North Miami Beach, FL 33162
$-753
Cash flow
-8.0%
Cash-on-Cash Return
4.3%
Cap rate
0.7%
Rent to Value Ratio
Active
$415,000
1
bds
|
2
ba
|
1,083
sqft
|
built
1989
19195 Mystic Pointe Dr, Aventura, FL 33180
$-570
Cash flow
-7.2%
Cash-on-Cash Return
4.5%
Cap rate
0.8%
Rent to Value Ratio
Active
$1,639,000
3
bds
|
2
ba
|
1,512
sqft
|
built
1955
1435 Blue Rd, Coral Gables, FL 33146
$-4,934
Cash flow
-15.7%
Cash-on-Cash Return
2.5%
Cap rate
0.4%
Rent to Value Ratio

Active
$490,000
3
bds
|
2
ba
|
1,021
sqft
|
built
1948
1011 NW 64th St, Miami, FL 33150
$-751
Cash flow
-8.0%
Cash-on-Cash Return
4.3%
Cap rate
0.6%
Rent to Value Ratio

Active
$439,000
2
bds
|
2
ba
|
1,251
sqft
|
built
1981
210 174th St, Sunny Isles Beach, FL 33160
$-1,273
Cash flow
-15.1%
Cash-on-Cash Return
2.7%
Cap rate
0.7%
Rent to Value Ratio

Active
$1,100,000
3
bds
|
2
ba
|
1,752
sqft
|
built
1980
10900 SW 124th Rd, Miami, FL 33176
$-3,485
Cash flow
-16.5%
Cash-on-Cash Return
2.3%
Cap rate
0.4%
Rent to Value Ratio

Active
$599,000
3
bds
|
1
ba
|
1,124
sqft
|
built
1923
1922 SW 3rd St, Miami, FL 33135
$-930
Cash flow
-8.1%
Cash-on-Cash Return
4.3%
Cap rate
0.5%
Rent to Value Ratio
Active
$520,000
1
bds
|
2
ba
|
1,056
sqft
|
built
1975
1901 Brickell Ave, Miami, FL 33129
$-1,605
Cash flow
-16.1%
Cash-on-Cash Return
2.4%
Cap rate
0.7%
Rent to Value Ratio

Active
$224,900
1
bds
|
1
ba
|
695
sqft
|
built
1965
1790 79th Street Cswy, North Bay Village, FL 33141
$-344
Cash flow
-8.0%
Cash-on-Cash Return
4.3%
Cap rate
0.9%
Rent to Value Ratio
Active
$280,000
2
bds
|
2
ba
|
1,178
sqft
|
built
1966
1455 N Treasure Dr, North Bay Village, FL 33141
$-1,033
Cash flow
-19.2%
Cash-on-Cash Return
1.7%
Cap rate
0.9%
Rent to Value Ratio
Active
$570,000
4
bds
|
3
ba
|
2,110
sqft
|
built
1999
24911 SW 120th Pl, Homestead, FL 33032
$-1,183
Cash flow
-10.8%
Cash-on-Cash Return
3.7%
Cap rate
0.6%
Rent to Value Ratio
Active
$224,900
1
bds
|
1
ba
|
705
sqft
|
built
1967
1770 79th Street Cswy, North Bay Village, FL 33141
$-320
Cash flow
-7.4%
Cash-on-Cash Return
4.4%
Cap rate
0.9%
Rent to Value Ratio

Active
$598,000
2
bds
|
2
ba
|
1,312
sqft
|
built
2007
19900 E Country Club Dr, Aventura, FL 33180
$-1,959
Cash flow
-17.1%
Cash-on-Cash Return
2.2%
Cap rate
0.7%
Rent to Value Ratio

Active
$1,424,000
1
bds
|
2
ba
|
1,066
sqft
|
built
2005
4401 Collins Ave, Miami Beach, FL 33140
$-6,530
Cash flow
-23.9%
Cash-on-Cash Return
0.6%
Cap rate
0.4%
Rent to Value Ratio

Active
$875,000
bds
|
1
ba
|
491
sqft
|
built
2005
4401 Collins Ave, Miami Beach, FL 33140
$-3,618
Cash flow
-21.6%
Cash-on-Cash Return
1.2%
Cap rate
0.4%
Rent to Value Ratio

Active
$3,100,000
3
bds
|
4
ba
|
3,091
sqft
|
built
2002
765 Crandon Blvd, Key Biscayne, FL 33149
$-13,732
Cash flow
-23.1%
Cash-on-Cash Return
0.8%
Cap rate
0.3%
Rent to Value Ratio
Active
$449,000
2
bds
|
2
ba
|
816
sqft
|
built
2006
3029 NE 188th St, Aventura, FL 33180
$-1,528
Cash flow
-17.8%
Cash-on-Cash Return
2.1%
Cap rate
0.7%
Rent to Value Ratio

Active
$385,000
1
bds
|
2
ba
|
880
sqft
|
built
2006
2415 NW 16th Street Rd, Miami, FL 33125
$-1,197
Cash flow
-16.2%
Cash-on-Cash Return
2.4%
Cap rate
0.6%
Rent to Value Ratio

Active
$600,000
2
bds
|
2
ba
|
1,114
sqft
|
built
2008
90 SW 3rd St, Miami, FL 33130
$-1,933
Cash flow
-16.8%
Cash-on-Cash Return
2.3%
Cap rate
0.7%
Rent to Value Ratio

Active
$310,000
2
bds
|
2
ba
|
1,081
sqft
|
built
1971
3475 N Country Club Dr, Miami, FL 33180
$-692
Cash flow
-11.6%
Cash-on-Cash Return
3.5%
Cap rate
0.9%
Rent to Value Ratio
Active
$650,000
3
bds
|
2
ba
|
1,216
sqft
|
built
1958
12481 SW 189th St, Miami, FL 33177
$-1,511
Cash flow
-12.1%
Cash-on-Cash Return
3.4%
Cap rate
0.5%
Rent to Value Ratio

Active
$950,000
2
bds
|
3
ba
|
2,534
sqft
|
built
1963
5255 Collins Ave, Miami Beach, FL 33140
$-6,576
Cash flow
-36.1%
Cash-on-Cash Return
-2.2%
Cap rate
0.5%
Rent to Value Ratio

Active
$360,000
3
bds
|
3
ba
|
1,425
sqft
|
built
2023
1065 NW 4th Ter, Florida City, FL 33034
$-560
Cash flow
-8.1%
Cash-on-Cash Return
4.3%
Cap rate
0.8%
Rent to Value Ratio

Active
$285,000
3
bds
|
2
ba
|
1,203
sqft
|
built
1972
5775 W 20th Ave, Hialeah, FL 33012
$-500
Cash flow
-9.2%
Cash-on-Cash Return
4.0%
Cap rate
0.9%
Rent to Value Ratio

Active
$1,400,000
2
bds
|
3
ba
|
1,162
sqft
|
built
2017
2900 NE 7th Ave, Miami, FL 33137
$-5,300
Cash flow
-19.8%
Cash-on-Cash Return
1.6%
Cap rate
0.5%
Rent to Value Ratio
Active
$330,000
bds
|
1
ba
|
511
sqft
|
built
1964
1024 Ocean Dr, Miami Beach, FL 33139
$-1,752
Cash flow
-27.7%
Cash-on-Cash Return
-0.2%
Cap rate
0.9%
Rent to Value Ratio

Active
$235,000
2
bds
|
1
ba
|
610
sqft
|
built
1925
577 NE 62nd St, Miami, FL 33138
$-687
Cash flow
-15.3%
Cash-on-Cash Return
2.6%
Cap rate
0.9%
Rent to Value Ratio

Active
$489,000
2
bds
|
2
ba
|
902
sqft
|
built
1972
201 178th Dr, Sunny Isles Beach, FL 33160
$-1,675
Cash flow
-17.9%
Cash-on-Cash Return
2.0%
Cap rate
0.5%
Rent to Value Ratio

Active
$1,949,000
2
bds
|
3
ba
|
1,666
sqft
|
built
2001
3400 SW 27th Ave, Miami, FL 33133
$-10,276
Cash flow
-27.5%
Cash-on-Cash Return
-0.2%
Cap rate
0.3%
Rent to Value Ratio

Active
$749,000
1
bds
|
2
ba
|
966
sqft
|
built
2005
2001 Meridian Ave, Miami Beach, FL 33139
$-2,744
Cash flow
-19.1%
Cash-on-Cash Return
1.8%
Cap rate
0.6%
Rent to Value Ratio