Miami Dade County Investment Properties for Sale
Browse homes for sale and investment properties in Miami Dade County. Refine your search by price, property type, or more.
Best cash flowing properties in Miami Dade County
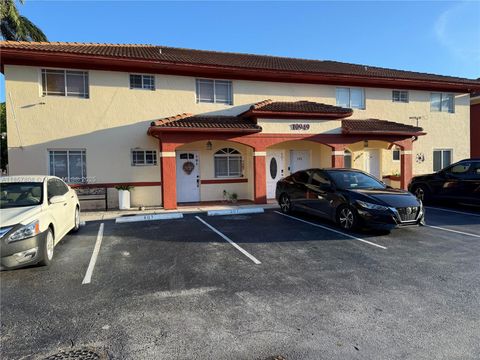
Active
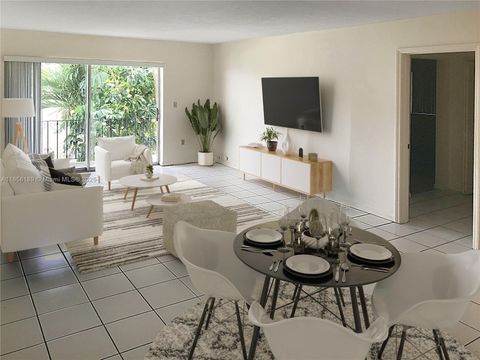
$324,995
2
bds
|
2
ba
|
1,190
sqft
|
built
2000
10949 W Okeechobee Rd, Hialeah Gardens, FL 33018
$-132
Cash flow
-2.1%
Cash-on-Cash Return
5.7%
Cap rate
0.9%
Rent to Value Ratio
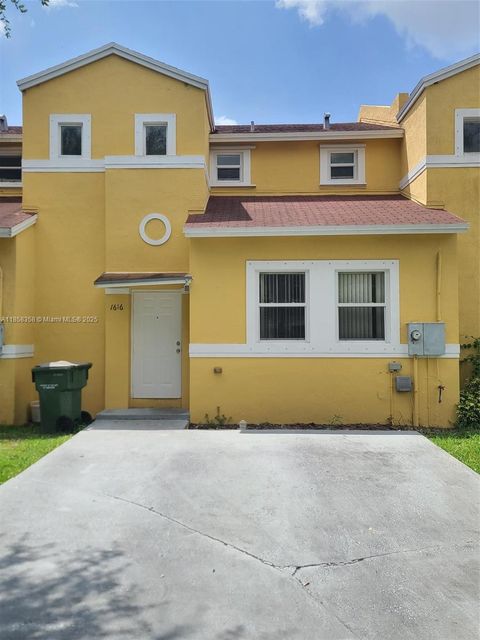
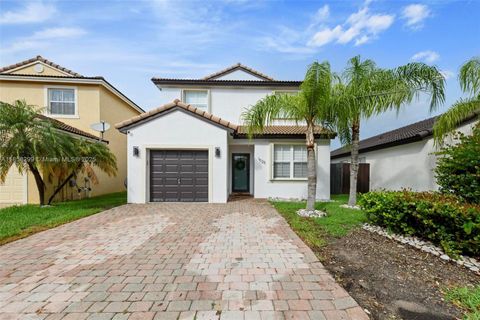
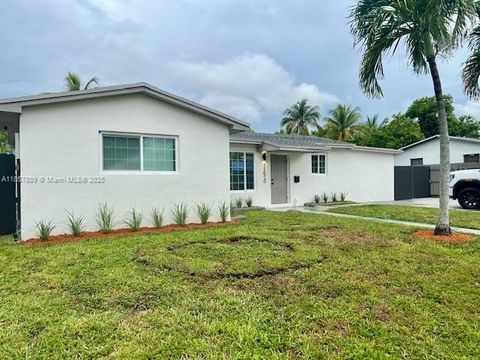
Active
$315,000
3
bds
|
2
ba
|
1,358
sqft
|
built
2005
1616 NE 5th St, Homestead, FL 33033
$-352
Cash flow
-5.8%
Cash-on-Cash Return
4.8%
Cap rate
0.8%
Rent to Value Ratio
10,000 out of 12,566 properties for sale in Miami Dade County
Limited Results Shown
Create a free account, or log in to reveal all property listings and enjoy the complete experience.
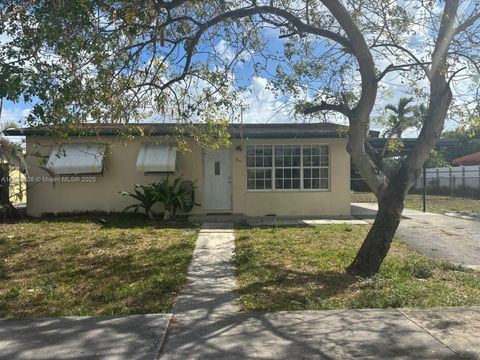
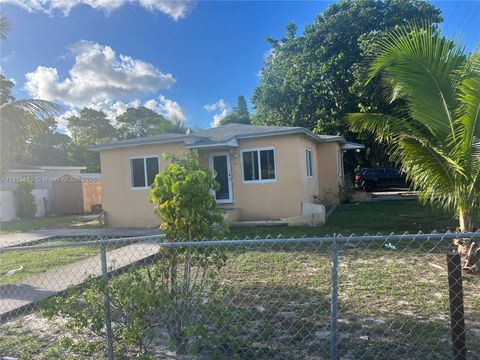
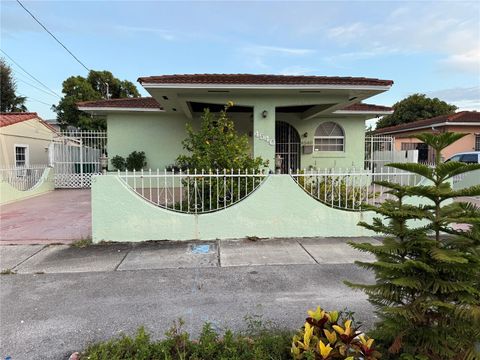
Active
$649,000
4
bds
|
2
ba
|
970
sqft
|
built
1961
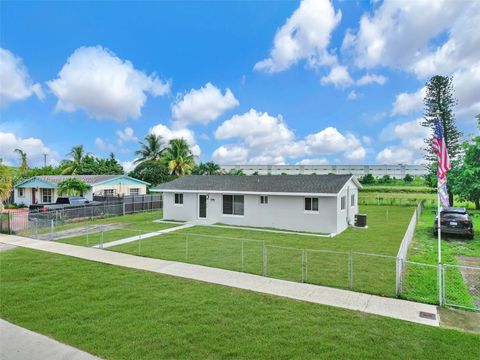
7820 NW 175th St, Hialeah, FL 33015
$-1,928
Cash flow
-15.5%
Cash-on-Cash Return
2.6%
Cap rate
0.4%
Rent to Value Ratio
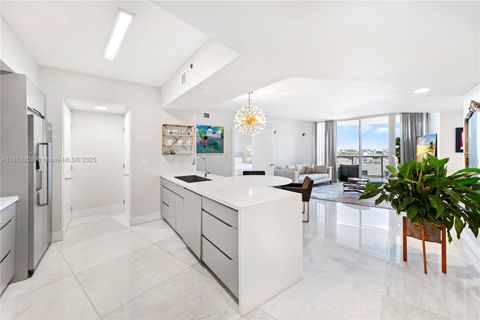
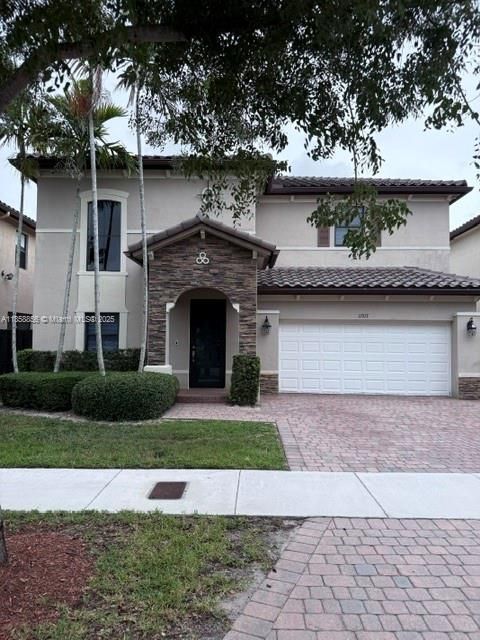
Active
$1,699,000
2
bds
|
2
ba
|
1,400
sqft
|
built
2003
400 Alton Rd, Miami Beach, FL 33139
$-6,474
Cash flow
-19.9%
Cash-on-Cash Return
1.6%
Cap rate
0.5%
Rent to Value Ratio
Active
$435,000
3
bds
|
2
ba
|
1,693
sqft
|
built
2005
1525 SE 20th Pl, Homestead, FL 33035
$-907
Cash flow
-10.9%
Cash-on-Cash Return
3.6%
Cap rate
0.7%
Rent to Value Ratio
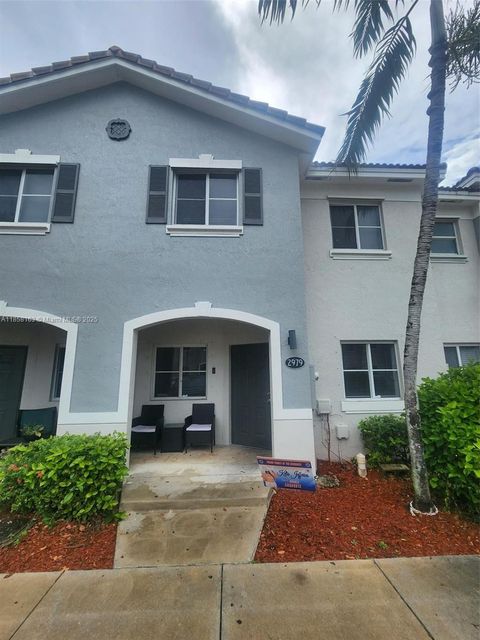
Active
$289,900
3
bds
|
3
ba
|
1,509
sqft
|
built
2005
2979 SE 15th Ave, Homestead, FL 33035
$-600
Cash flow
-10.8%
Cash-on-Cash Return
3.7%
Cap rate
0.8%
Rent to Value Ratio
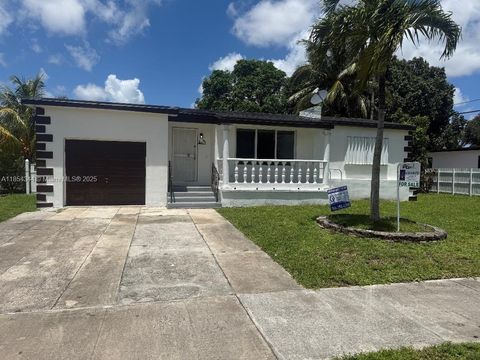
Active
$495,000
3
bds
|
2
ba
|
1,286
sqft
|
built
1953
901 NW 149th Ter, Miami, FL 33168
$-1,142
Cash flow
-12.0%
Cash-on-Cash Return
3.4%
Cap rate
0.6%
Rent to Value Ratio
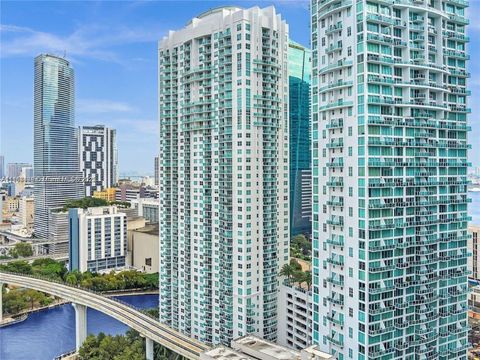
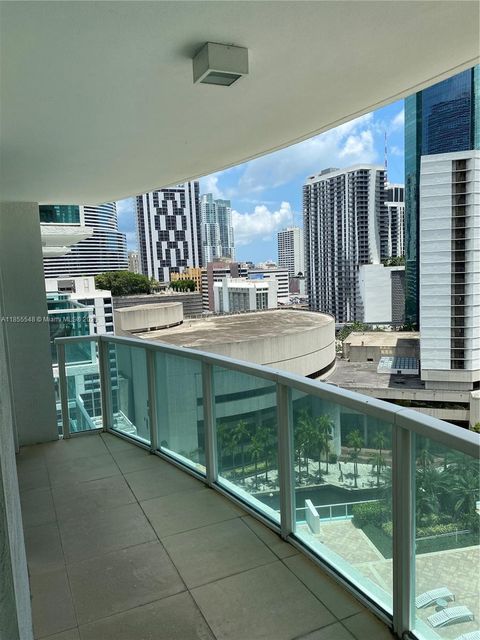
Active
$450,000
1
bds
|
1
ba
|
775
sqft
|
built
2006
31 SE 5th St, Miami, FL 33131
$-1,596
Cash flow
-18.5%
Cash-on-Cash Return
1.9%
Cap rate
0.7%
Rent to Value Ratio
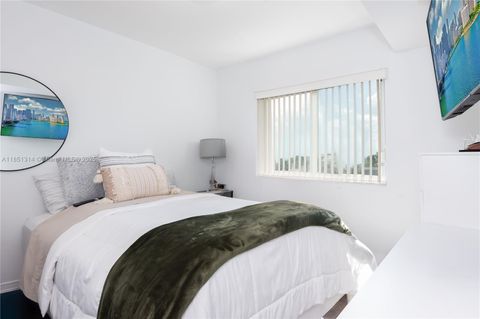
Active
$419,900
2
bds
|
2
ba
|
1,122
sqft
|
built
1969
1239 Mariposa Ave, Coral Gables, FL 33146
$-911
Cash flow
-11.3%
Cash-on-Cash Return
3.5%
Cap rate
0.8%
Rent to Value Ratio

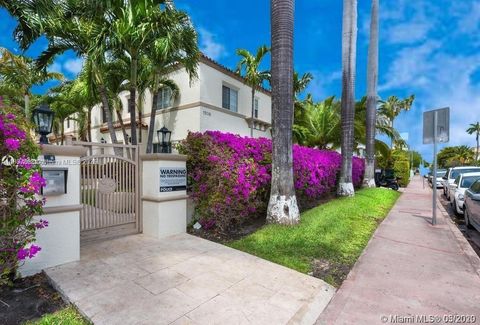
Active
$319,000
3
bds
|
2
ba
|
1,218
sqft
|
built
2007
20810 SW 87th Ave, Cutler Bay, FL 33189
$-623
Cash flow
-10.2%
Cash-on-Cash Return
3.8%
Cap rate
0.8%
Rent to Value Ratio

Active
$529,000
4
bds
|
2
ba
|
1,323
sqft
|
built
1953
365 NW 188th St, Miami Gardens, FL 33169
$-900
Cash flow
-8.9%
Cash-on-Cash Return
4.1%
Cap rate
0.5%
Rent to Value Ratio
Active
$579,800
4
bds
|
2
ba
|
0
sqft
|
built
1959
11010 NW 12th Ct, Miami, FL 33167
$-1,126
Cash flow
-10.1%
Cash-on-Cash Return
3.8%
Cap rate
0.5%
Rent to Value Ratio
Active
$539,999
2
bds
|
0
ba
|
1,454
sqft
|
built
1949
801 NW 105th St, Miami, FL 33150
$-1,862
Cash flow
-18.0%
Cash-on-Cash Return
2.0%
Cap rate
0.4%
Rent to Value Ratio
Active
$915,000
4
bds
|
3
ba
|
2,816
sqft
|
built
2015
11917 SW 151st Pl, Miami, FL 33196
$-2,615
Cash flow
-14.9%
Cash-on-Cash Return
2.7%
Cap rate
0.5%
Rent to Value Ratio
Active
$370,000
2
bds
|
2
ba
|
770
sqft
|
built
1974
2138 SW 6th St, Miami, FL 33135
$-390
Cash flow
-5.5%
Cash-on-Cash Return
4.9%
Cap rate
0.6%
Rent to Value Ratio
Active
$750,000
3
bds
|
2
ba
|
1,616
sqft
|
built
1976
11195 SW 115th Ter, Miami, FL 33176
$-1,594
Cash flow
-11.1%
Cash-on-Cash Return
3.6%
Cap rate
0.5%
Rent to Value Ratio
Active
$315,000
1
bds
|
1
ba
|
700
sqft
|
built
1958
9271 W Bay Harbor Dr, Bay Harbor Islands, FL 33154
$-1,189
Cash flow
-19.7%
Cash-on-Cash Return
1.6%
Cap rate
0.8%
Rent to Value Ratio
Active
$1,250,000
1
bds
|
2
ba
|
858
sqft
|
built
2009
17121 Collins Ave, Sunny Isles Beach, FL 33160
$-5,001
Cash flow
-20.9%
Cash-on-Cash Return
1.3%
Cap rate
0.4%
Rent to Value Ratio
Active
$599,000
4
bds
|
2
ba
|
1,012
sqft
|
built
1971
4521 NW 207th Dr, Miami Gardens, FL 33055
$-1,080
Cash flow
-9.4%
Cash-on-Cash Return
4.0%
Cap rate
0.5%
Rent to Value Ratio
Active
$355,000
1
bds
|
2
ba
|
767
sqft
|
built
1979
17021 N Bay Rd, Sunny Isles Beach, FL 33160
$-1,324
Cash flow
-19.5%
Cash-on-Cash Return
1.7%
Cap rate
0.6%
Rent to Value Ratio
Active
$749,900
2
bds
|
3
ba
|
1,570
sqft
|
built
1974
3973 NE 167th St, North Miami Beach, FL 33160
$-2,480
Cash flow
-17.3%
Cash-on-Cash Return
2.2%
Cap rate
0.5%
Rent to Value Ratio
Active
$899,000
3
bds
|
5
ba
|
2,789
sqft
|
built
2019
4690 NW 84th Ave, Doral, FL 33166
$-3,481
Cash flow
-20.2%
Cash-on-Cash Return
1.5%
Cap rate
0.5%
Rent to Value Ratio
Active
$740,000
5
bds
|
4
ba
|
2,100
sqft
|
built
1952
4540 SW 2nd Ter, Coral Gables, FL 33134
$-1,097
Cash flow
-7.7%
Cash-on-Cash Return
4.4%
Cap rate
0.6%
Rent to Value Ratio
Active
$425,000
1
bds
|
2
ba
|
902
sqft
|
built
2006
31 SE 5th St, Miami, FL 33131
$-1,388
Cash flow
-17.0%
Cash-on-Cash Return
2.2%
Cap rate
0.8%
Rent to Value Ratio
Active
$299,999
2
bds
|
2
ba
|
842
sqft
|
built
2006
2475 NW 16th Street Rd, Miami, FL 33125
$-876
Cash flow
-15.2%
Cash-on-Cash Return
2.6%
Cap rate
0.8%
Rent to Value Ratio
Active
$350,000
1
bds
|
1
ba
|
561
sqft
|
built
1935
1508 Pennsylvania Ave, Miami Beach, FL 33139
$-1,089
Cash flow
-16.2%
Cash-on-Cash Return
2.4%
Cap rate
0.7%
Rent to Value Ratio
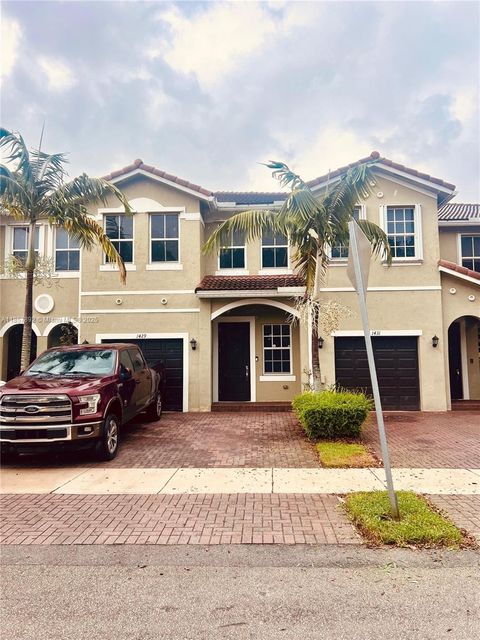
Active
$440,000
4
bds
|
3
ba
|
1,916
sqft
|
built
2018
1429 SE 26th Ave, Homestead, FL 33035
$-1,295
Cash flow
-15.4%
Cash-on-Cash Return
2.6%
Cap rate
0.7%
Rent to Value Ratio
Active
$374,000
3
bds
|
3
ba
|
1,500
sqft
|
built
1986
17962 NW 68th Ave, Hialeah, FL 33015
$-805
Cash flow
-11.2%
Cash-on-Cash Return
3.6%
Cap rate
0.8%
Rent to Value Ratio
Active
$489,000
3
bds
|
3
ba
|
1,483
sqft
|
built
2022
3310 W 114th Ter, Hialeah, FL 33018
$-1,209
Cash flow
-12.9%
Cash-on-Cash Return
3.2%
Cap rate
0.7%
Rent to Value Ratio
Active
$2,650,000
3
bds
|
0
ba
|
3,128
sqft
|
built
1926
36 Phoenetia Ave, Coral Gables, FL 33134
$-10,296
Cash flow
-20.3%
Cash-on-Cash Return
1.5%
Cap rate
0.3%
Rent to Value Ratio
Active
$309,900
1
bds
|
1
ba
|
821
sqft
|
built
2007
1750 N Bayshore Dr, Miami, FL 33132
$-869
Cash flow
-14.6%
Cash-on-Cash Return
2.8%
Cap rate
1.0%
Rent to Value Ratio
Active
$329,000
1
bds
|
1
ba
|
791
sqft
|
built
2008
1750 N Bayshore Dr, Miami, FL 33132
$-1,822
Cash flow
-28.9%
Cash-on-Cash Return
-0.5%
Cap rate
0.9%
Rent to Value Ratio
Active
$365,000
2
bds
|
3
ba
|
1,088
sqft
|
built
2011
11603 NW 89th St, Doral, FL 33178
$-859
Cash flow
-12.3%
Cash-on-Cash Return
3.3%
Cap rate
0.8%
Rent to Value Ratio
Active
$760,000
3
bds
|
3
ba
|
1,865
sqft
|
built
2015
8377 NW 51st Ter, Doral, FL 33166
$-2,227
Cash flow
-15.3%
Cash-on-Cash Return
2.6%
Cap rate
0.6%
Rent to Value Ratio
Active
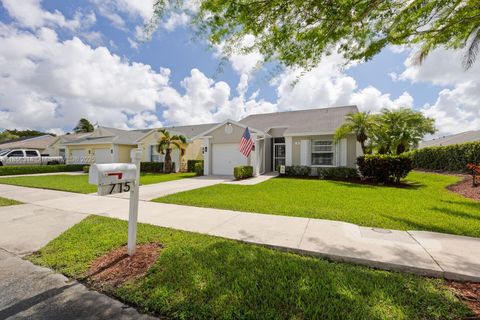
$397,500
2
bds
|
2
ba
|
1,183
sqft
|
built
1989
715 SE 22nd Ln, Homestead, FL 33033
$-1,195
Cash flow
-15.7%
Cash-on-Cash Return
2.5%
Cap rate
0.6%
Rent to Value Ratio
Active
$440,000
2
bds
|
2
ba
|
1,450
sqft
|
built
1972
3545 NE 166th St, North Miami Beach, FL 33160
$-1,370
Cash flow
-16.2%
Cash-on-Cash Return
2.4%
Cap rate
0.7%
Rent to Value Ratio
Active
$437,000
3
bds
|
3
ba
|
1,510
sqft
|
built
2004
20750 SW 79th Pl, Cutler Bay, FL 33189
$-1,086
Cash flow
-13.0%
Cash-on-Cash Return
3.2%
Cap rate
0.6%
Rent to Value Ratio
Active
$1,075,000
5
bds
|
3
ba
|
1,735
sqft
|
built
1948
6820 SW 28th Ter, Miami, FL 33155
$-3,536
Cash flow
-17.2%
Cash-on-Cash Return
2.2%
Cap rate
0.3%
Rent to Value Ratio
Active
$495,000
3
bds
|
3
ba
|
1,827
sqft
|
built
2023
16233 SW 290th Ter, Homestead, FL 33033
$-1,565
Cash flow
-16.5%
Cash-on-Cash Return
2.4%
Cap rate
0.6%
Rent to Value Ratio
Active
$295,000
1
bds
|
1
ba
|
767
sqft
|
built
1970
1519 Drexel Ave, Miami Beach, FL 33139
$-775
Cash flow
-13.7%
Cash-on-Cash Return
3.0%
Cap rate
0.9%
Rent to Value Ratio