Miami Dade County Investment Properties for Sale
Browse homes for sale and investment properties in Miami Dade County. Refine your search by price, property type, or more.
Best cash flowing properties in Miami Dade County
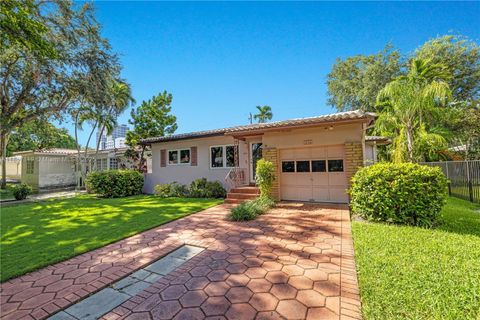
Active
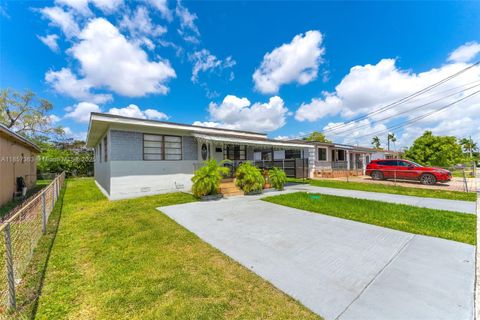
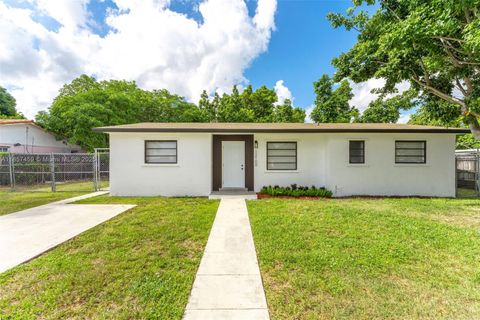
$375,000
2
bds
|
1
ba
|
1,000
sqft
|
built
1949
1170 NE 137th St, North Miami, FL 33161
$22
Cash flow
0.3%
Cash-on-Cash Return
6.2%
Cap rate
0.8%
Rent to Value Ratio

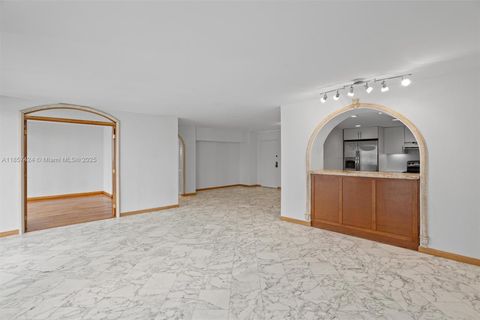
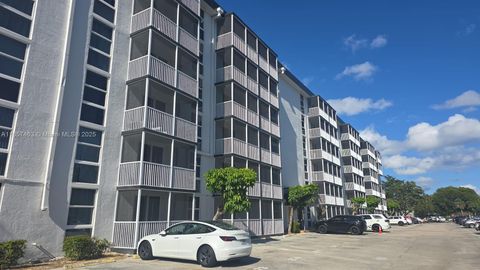
Active
$248,000
2
bds
|
2
ba
|
832
sqft
|
built
1972
6825 W Flagler St, Miami, FL 33144
$-291
Cash flow
-6.1%
Cash-on-Cash Return
4.7%
Cap rate
0.9%
Rent to Value Ratio
10,000 out of 11,974 properties for sale in Miami Dade County
Limited Results Shown
Create a free account, or log in to reveal all property listings and enjoy the complete experience.

Active
$2,200,000
4
bds
|
0
ba
|
5,106
sqft
|
built
1925
125 NW 7th Ave, Miami, FL 33128
$-8,841
Cash flow
-21.0%
Cash-on-Cash Return
1.3%
Cap rate
0.3%
Rent to Value Ratio

Active
$539,000
2
bds
|
2
ba
|
940
sqft
|
built
1971
1228 West Ave, Miami Beach, FL 33139
$-2,147
Cash flow
-20.8%
Cash-on-Cash Return
1.4%
Cap rate
0.6%
Rent to Value Ratio
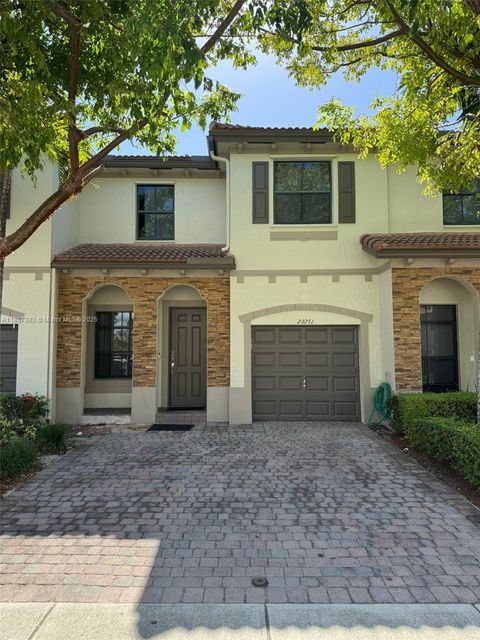
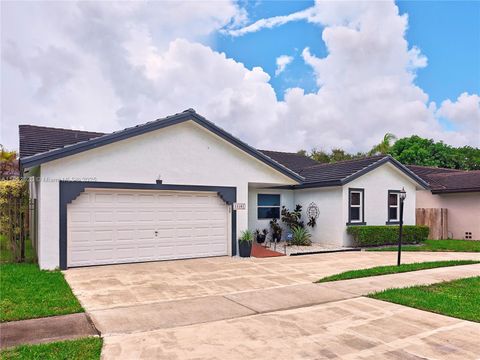
Active
$500,000
3
bds
|
3
ba
|
1,706
sqft
|
built
2014
23251 SW 113th Ct, Homestead, FL 33032
$-1,442
Cash flow
-15.0%
Cash-on-Cash Return
2.7%
Cap rate
0.6%
Rent to Value Ratio
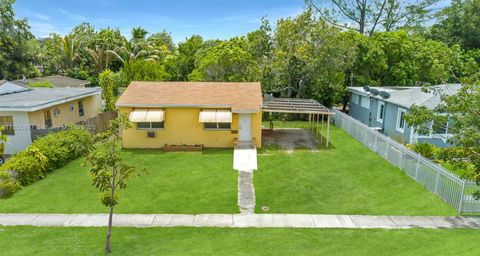
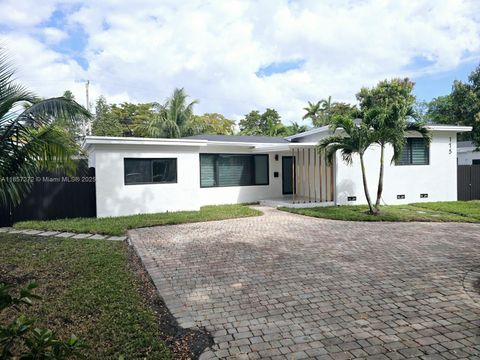
Active
$519,000
3
bds
|
2
ba
|
1,652
sqft
|
built
1949
845 NE 127th St, North Miami, FL 33161
$-415
Cash flow
-4.2%
Cash-on-Cash Return
5.2%
Cap rate
0.7%
Rent to Value Ratio
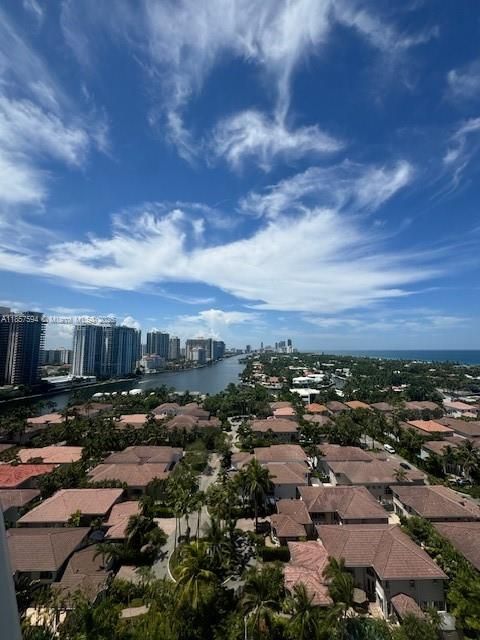
Active
$450,000
1
bds
|
2
ba
|
1,005
sqft
|
built
1972
19380 Collins Ave, Sunny Isles Beach, FL 33160
$-1,634
Cash flow
-18.9%
Cash-on-Cash Return
1.8%
Cap rate
0.6%
Rent to Value Ratio
Active
$1,650,000
4
bds
|
3
ba
|
2,498
sqft
|
built
1988
3754 NE 209th Ter, Aventura, FL 33180
$-4,589
Cash flow
-14.5%
Cash-on-Cash Return
2.8%
Cap rate
0.5%
Rent to Value Ratio
Active
$299,999
2
bds
|
2
ba
|
1,313
sqft
|
built
1975
20335 W Country Club Dr, Aventura, FL 33180
$-702
Cash flow
-12.2%
Cash-on-Cash Return
3.3%
Cap rate
1.1%
Rent to Value Ratio
Active
$1,300,000
2
bds
|
3
ba
|
1,740
sqft
|
built
2001
9559 Collins Ave, Surfside, FL 33154
$-6,242
Cash flow
-25.1%
Cash-on-Cash Return
0.4%
Cap rate
0.5%
Rent to Value Ratio
Active
$1,350,000
8
bds
|
0
ba
|
3,386
sqft
|
built
1925
1376 NW 35th St, Miami, FL 33142
$-5,017
Cash flow
-19.4%
Cash-on-Cash Return
1.7%
Cap rate
0.4%
Rent to Value Ratio
Active
$675,000
4
bds
|
3
ba
|
1,456
sqft
|
built
1958
3500 SW 87th Pl, Miami, FL 33165
$-1,660
Cash flow
-12.8%
Cash-on-Cash Return
3.2%
Cap rate
0.5%
Rent to Value Ratio
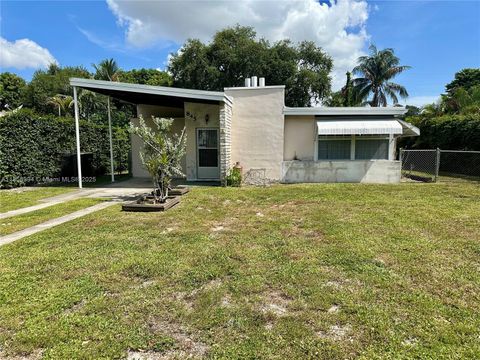
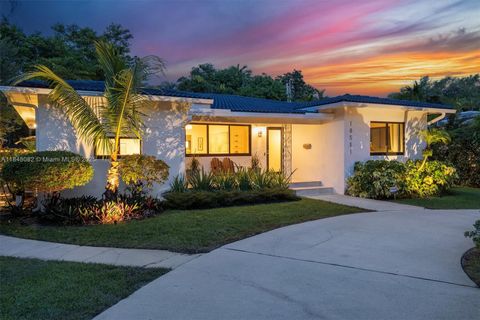
Active
$759,000
3
bds
|
2
ba
|
2,074
sqft
|
built
1955
175 NE 120th St, North Miami, FL 33161
$-1,715
Cash flow
-11.8%
Cash-on-Cash Return
3.4%
Cap rate
0.5%
Rent to Value Ratio
Active
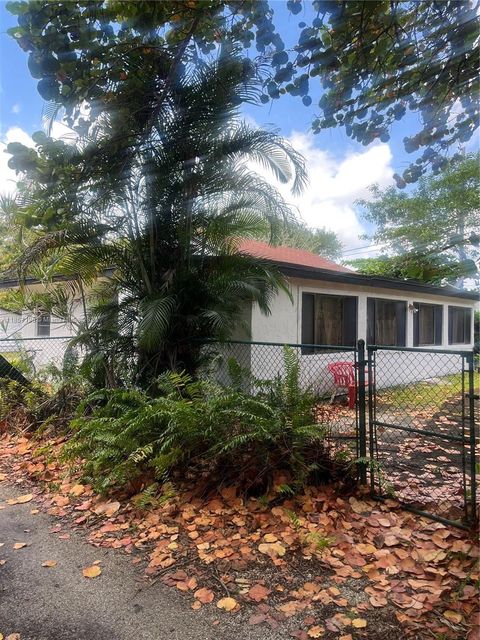
$549,999
3
bds
|
0
ba
|
1,682
sqft
|
built
1941
15260 NE 2nd Ave, Miami, FL 33162
$-1,939
Cash flow
-18.4%
Cash-on-Cash Return
1.9%
Cap rate
0.4%
Rent to Value Ratio
Active
$1,250,000
3
bds
|
3
ba
|
1,816
sqft
|
built
1950
10551 NE 3rd Ave, Miami Shores, FL 33138
$-3,721
Cash flow
-15.5%
Cash-on-Cash Return
2.6%
Cap rate
0.4%
Rent to Value Ratio
Active
$1,400,000
2
bds
|
3
ba
|
1,607
sqft
|
built
2008
200 Biscayne Boulevard Way, Miami, FL 33131
$-6,030
Cash flow
-22.5%
Cash-on-Cash Return
1.0%
Cap rate
0.5%
Rent to Value Ratio
Active
$589,000
4
bds
|
2
ba
|
1,272
sqft
|
built
1974
12100 SW 191st Ter, Miami, FL 33177
$-1,553
Cash flow
-13.8%
Cash-on-Cash Return
3.0%
Cap rate
0.5%
Rent to Value Ratio
Active
$550,000
2
bds
|
2
ba
|
1,249
sqft
|
built
1977
1450 Brickell Bay Dr, Miami, FL 33131
$-1,977
Cash flow
-18.8%
Cash-on-Cash Return
1.8%
Cap rate
0.7%
Rent to Value Ratio
Active
$997,777
3
bds
|
2
ba
|
1,551
sqft
|
built
2004
1250 S Miami Ave, Miami, FL 33130
$-4,202
Cash flow
-22.0%
Cash-on-Cash Return
1.1%
Cap rate
0.5%
Rent to Value Ratio
Active
$306,000
2
bds
|
2
ba
|
1,200
sqft
|
built
1977
14201 SW 66th St, Miami, FL 33183
$-544
Cash flow
-9.3%
Cash-on-Cash Return
4.0%
Cap rate
0.8%
Rent to Value Ratio
Active
$600,000
3
bds
|
2
ba
|
1,138
sqft
|
built
1960
4864 E 8th Ln, Hialeah, FL 33013
$-1,347
Cash flow
-11.7%
Cash-on-Cash Return
3.5%
Cap rate
0.5%
Rent to Value Ratio
Active
$257,000
1
bds
|
2
ba
|
1,070
sqft
|
built
2007
5300 NW 87th Ave, Doral, FL 33178
$-2,518
Cash flow
-51.1%
Cash-on-Cash Return
-5.6%
Cap rate
0.4%
Rent to Value Ratio
Active
$343,900
2
bds
|
2
ba
|
990
sqft
|
built
2018
2651 NE 212th Ter, Aventura, FL 33180
$-1,180
Cash flow
-17.9%
Cash-on-Cash Return
2.0%
Cap rate
0.7%
Rent to Value Ratio
Active
$12,900,000
6
bds
|
7
ba
|
7,057
sqft
|
built
1992
3 Tahiti Beach Island Rd, Coral Gables, FL 33143
$-75,458
Cash flow
-30.5%
Cash-on-Cash Return
-0.9%
Cap rate
0.1%
Rent to Value Ratio
Active
$165,000
1
bds
|
1
ba
|
720
sqft
|
built
1973
16851 NE 23rd Ave, North Miami Beach, FL 33160
$-544
Cash flow
-17.2%
Cash-on-Cash Return
2.2%
Cap rate
1.1%
Rent to Value Ratio

Active
$750,000
4
bds
|
3
ba
|
2,652
sqft
|
built
1946
530 Tamiami Blvd, Miami, FL 33144
$-2,617
Cash flow
-18.2%
Cash-on-Cash Return
2.0%
Cap rate
0.4%
Rent to Value Ratio
Active
$1,400,000
3
bds
|
2
ba
|
1,831
sqft
|
built
1950
236 Candia Ave, Coral Gables, FL 33134
$-3,903
Cash flow
-14.5%
Cash-on-Cash Return
2.8%
Cap rate
0.4%
Rent to Value Ratio

Active
$465,000
2
bds
|
2
ba
|
874
sqft
|
built
1953
411 NW 59th Ct, Miami, FL 33126
$-463
Cash flow
-5.2%
Cash-on-Cash Return
5.0%
Cap rate
0.7%
Rent to Value Ratio

Active
$355,000
3
bds
|
2
ba
|
1,240
sqft
|
built
1980
8550 SW 149th Ave, Miami, FL 33193
$-591
Cash flow
-8.7%
Cash-on-Cash Return
4.1%
Cap rate
0.8%
Rent to Value Ratio
Active
$700,000
3
bds
|
2
ba
|
1,753
sqft
|
built
1988
11181 SW 145th Ct, Miami, FL 33186
$-1,853
Cash flow
-13.8%
Cash-on-Cash Return
3.0%
Cap rate
0.5%
Rent to Value Ratio
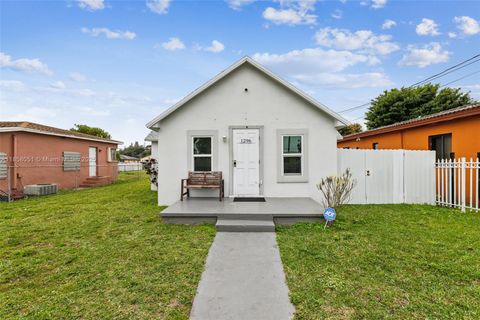
Active
$445,000
2
bds
|
1
ba
|
837
sqft
|
built
1937
1296 NW 72nd St, Miami, FL 33147
$-824
Cash flow
-9.7%
Cash-on-Cash Return
3.9%
Cap rate
0.6%
Rent to Value Ratio

Active
$575,000
3
bds
|
4
ba
|
1,890
sqft
|
built
1984
8906 SW 113th Place Cir E, Miami, FL 33176
$-1,696
Cash flow
-15.4%
Cash-on-Cash Return
2.6%
Cap rate
0.6%
Rent to Value Ratio
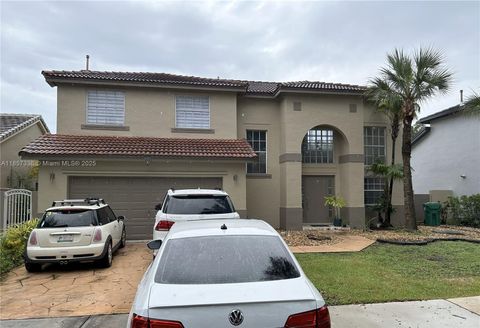
Active
$689,900
3
bds
|
3
ba
|
1,844
sqft
|
built
1991
19131 NW 89th Ct, Hialeah, FL 33018
$-1,671
Cash flow
-12.6%
Cash-on-Cash Return
3.2%
Cap rate
0.5%
Rent to Value Ratio

Active
$395,000
2
bds
|
2
ba
|
1,232
sqft
|
built
1981
210 174th St, Sunny Isles Beach, FL 33160
$-1,078
Cash flow
-14.2%
Cash-on-Cash Return
2.9%
Cap rate
0.7%
Rent to Value Ratio
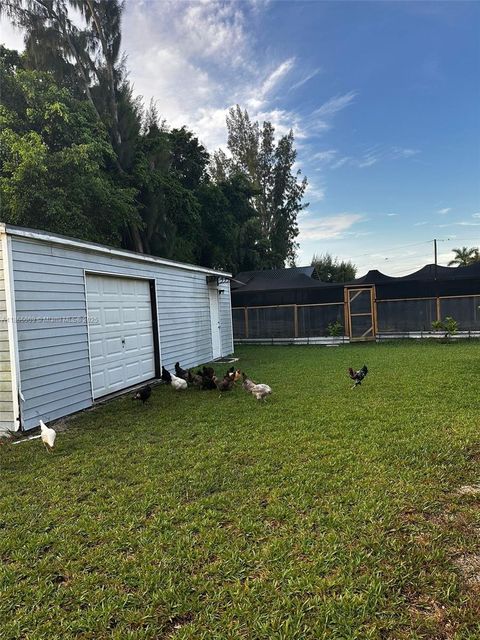
Active
$1,350,000
3
bds
|
2
ba
|
2,542
sqft
|
built
1992
21701 SW 187th Ave, Miami, FL 33170
$-2,880
Cash flow
-11.1%
Cash-on-Cash Return
3.6%
Cap rate
0.5%
Rent to Value Ratio

Active
$255,000
1
bds
|
2
ba
|
806
sqft
|
built
1975
21121 SW 85th Ave, Cutler Bay, FL 33189
$-600
Cash flow
-12.3%
Cash-on-Cash Return
3.3%
Cap rate
0.7%
Rent to Value Ratio
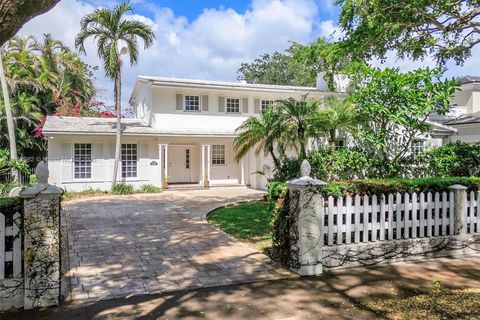
Active
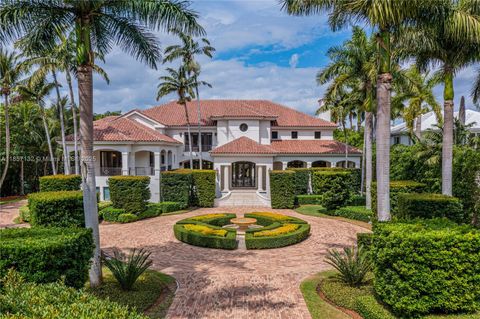
$3,950,000
4
bds
|
4
ba
|
3,270
sqft
|
built
1964
4310 Santa Maria St, Coral Gables, FL 33146
$-15,249
Cash flow
-20.1%
Cash-on-Cash Return
1.5%
Cap rate
0.2%
Rent to Value Ratio

Active
$505,000
1
bds
|
2
ba
|
725
sqft
|
built
1967
240 Galen Dr, Key Biscayne, FL 33149
$-907
Cash flow
-9.4%
Cash-on-Cash Return
4.0%
Cap rate
0.6%
Rent to Value Ratio
Active
$2,000,000
2
bds
|
3
ba
|
1,878
sqft
|
built
2004
1331 Brickell Bay Dr, Miami, FL 33131
$-7,492
Cash flow
-19.5%
Cash-on-Cash Return
1.7%
Cap rate
0.6%
Rent to Value Ratio
Active
$340,000
1
bds
|
1
ba
|
720
sqft
|
built
2004
6001 SW 70th St, South Miami, FL 33143
$-1,111
Cash flow
-17.0%
Cash-on-Cash Return
2.2%
Cap rate
0.6%
Rent to Value Ratio